. 2017 Oct 30;8(1):1197.
doi: 10.1038/s41467-017-01178-z.

Multi-dimensional genomic analysis of myoepithelial carcinoma identifies prevalent oncogenic gene fusions

Affiliations

Multi-dimensional genomic analysis of myoepithelial carcinoma identifies prevalent oncogenic gene fusions

Martin G Dalin et al. Nat Commun. .

Abstract

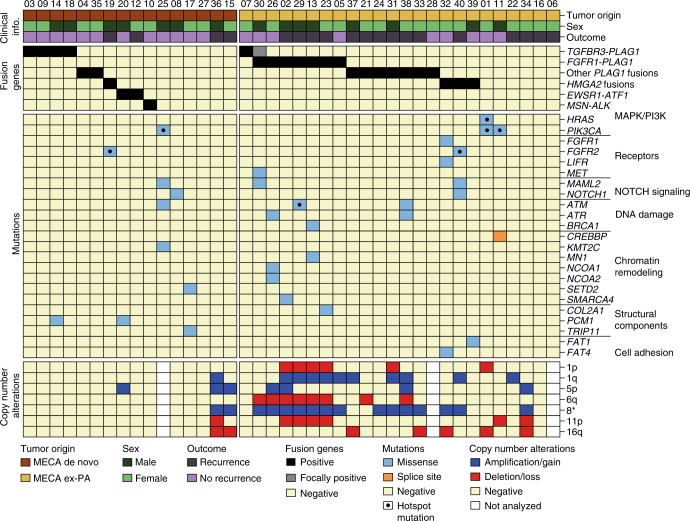
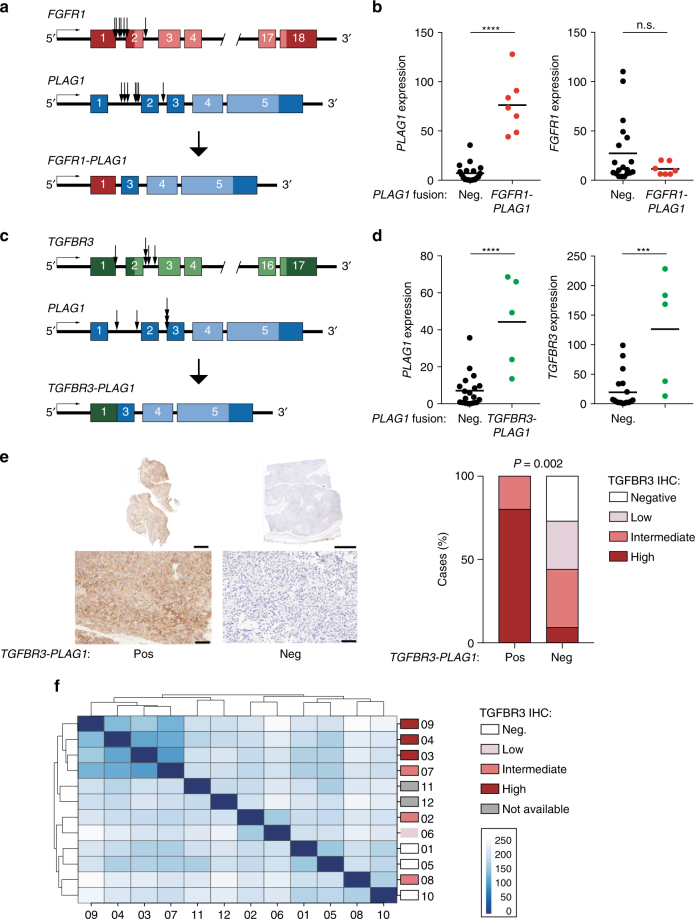
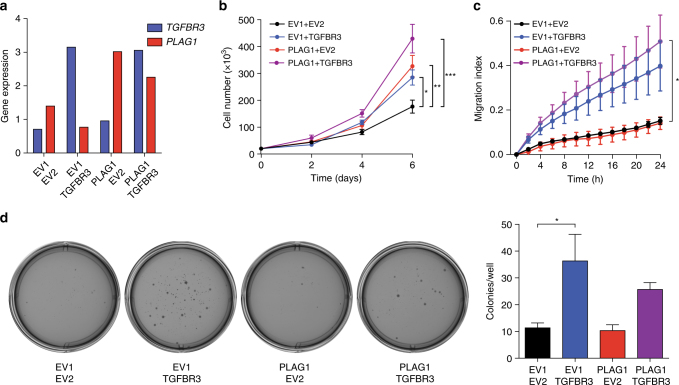
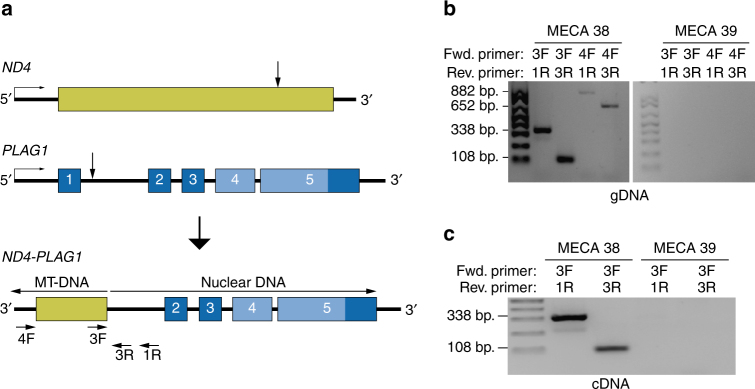
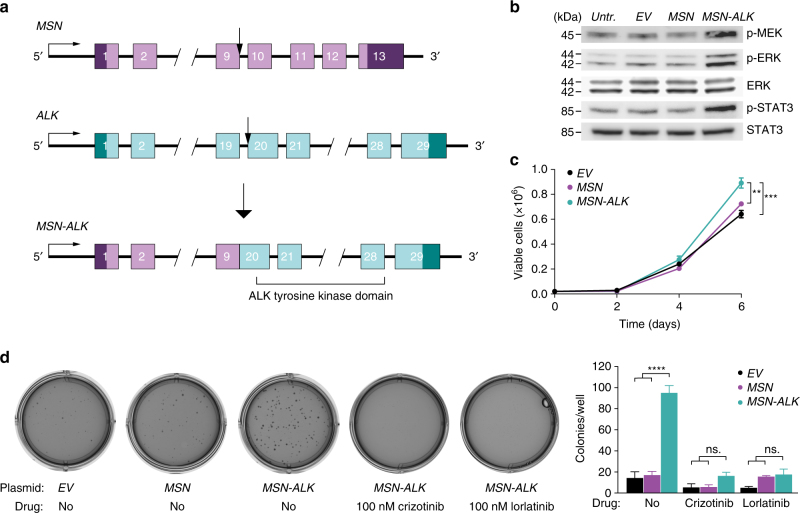
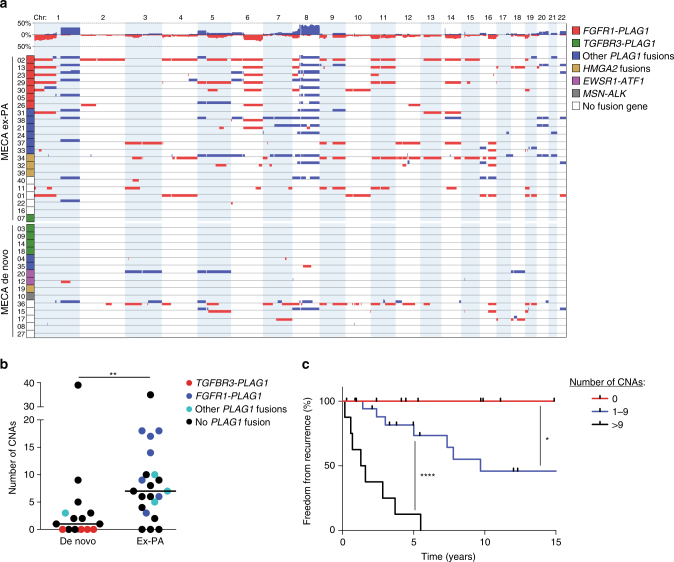
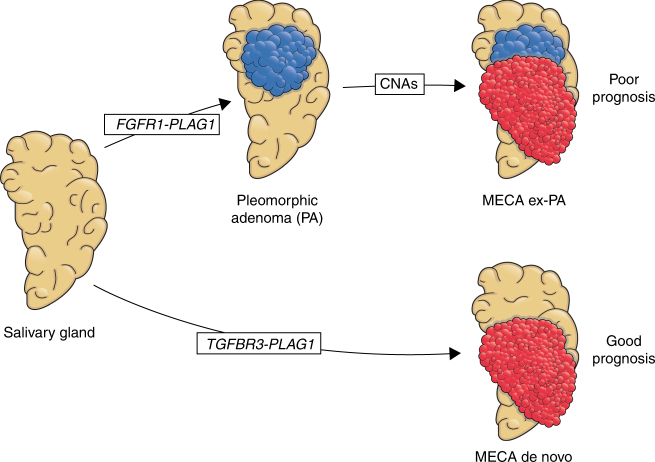
Myoepithelial carcinoma (MECA) is an aggressive salivary gland cancer with largely unknown genetic features. Here we comprehensively analyze molecular alterations in 40 MECAs using integrated genomic analyses. We identify a low mutational load, and high prevalence (70%) of oncogenic gene fusions. Most fusions involve the PLAG1 oncogene, which is associated with PLAG1 overexpression. We find FGFR1-PLAG1 in seven (18%) cases, and the novel TGFBR3-PLAG1 fusion in six (15%) cases. TGFBR3-PLAG1 promotes a tumorigenic phenotype in vitro, and is absent in 723 other salivary gland tumors. Other novel PLAG1 fusions include ND4-PLAG1; a fusion between mitochondrial and nuclear DNA. We also identify higher number of copy number alterations as a risk factor for recurrence, independent of tumor stage at diagnosis. Our findings indicate that MECA is a fusion-driven disease, nominate TGFBR3-PLAG1 as a hallmark of MECA, and provide a framework for future diagnostic and therapeutic research in this lethal cancer.


Conflict of interest statement

T.A.C. is a cofounder of Gritstone Oncology. The remaining authors declare no competing financial interests.

Figures

Fig. 1
Fig. 1
Genetic landscape of MECA. Clinical information, fusion genes, mutations, and arm-level copy number alterations in 40 cases of MECA. Mutations of genes listed in cancer census that are reported in more than one case in the COSMIC database are shown. Hotspot mutations are those reported in more than 25 cases in COSMIC
Fig. 2
Fig. 2
Detection of the FGFR1-PLAG1 and TGFBR3-PLAG1 fusion genes. a Illustration of the FGFR1-PLAG1 fusion gene. Arrows show locations of genomic break points for each of the tumors. b Expression of PLAG1 (left) and FGFR1 (right) in PLAG1 fusion-negative vs. FGFR1-PLAG1-positive tumors. Graphs show fragments per kilobase of exon per million fragments mapped (FPKM), based on RNA-seq data. ****P < 0.0001; Student’s t-test. n = 19 + 7. Horizontal lines show mean values. c Illustration of the TGFBR3-PLAG1 fusion gene. d Expression (FPKM) of PLAG1 (left) and TGFBR3 (right) in PLAG1 fusion-negative vs. TGFBR3-PLAG1-positive tumors. ***P < 0.001, ****P < 0.0001; Student’s t-test. n = 19 + 5. Horizontal lines show mean values. e Left, IHC showing TGFBR3 staining in whole tumor sections (upper panels, scale bars=5 mm) and enlargement of selected areas (lower panels, scale bars=100 μm). Right, quantification of IHC TGFBR3 levels in TGFBR3-PLAG1 positive vs. negative tumors. P (high TGFBR3) = 0.002, Fisher’s exact test. n = 5 + 34. f Poisson sample clustering based on gene expression in cohort 1, annotated by TGFBR3 IHC results
Fig. 3
Fig. 3
Overexpression of TGFBR3 and PLAG1 causes transformation of human salivary gland (HSG) cells. a RT-QPCR of TGFBR3 and PLAG1 mRNA levels in HSGs infected with constructs expressing combinations of PLAG1 or the corresponding empty vector (EV) 1, and TGFBR3 or the corresponding EV2. Data are mean using three technical replicates, normalized to the reference gene STLM. b Proliferation. Data are mean ± SEM using three technical replicates. *P < 0.05, **P < 0.01, ***P < 0.001; two-way ANNOVA with Dunnett’s multiple comparison test. The experiment was replicated three times. c Migration index. Data are mean ± SEM using four technical replicates. *P < 0.05; two-way ANNOVA with Dunnett’s multiple comparison test. The experiment was replicated two times. d Representative photographs (left) and quantification (right) of soft agar colony formation. Data are mean ± SEM from three technical replicates. *P < 0.05; one-way ANNOVA with Tukey’s multiple comparison test. The experiment was replicated two times
Fig. 4
Fig. 4
Detection of the novel mitochondrial/genomic DNA fusion gene ND4-PLAG1. a Illustration of ND4-PLAG1. MT mitochondrial. b PCRs of genomic DNA extracted from the ND4-PLAG1-positive tumor (case 38) and a fusion-negative tumor (case 39), using the denoted primer pairs. Of the 882 bp PCR product of primers 4F and 1R, 591 bp are mitochondrial and 291 bp are nuclear DNA. c PCRs of cDNA extracted from tumor 38 and 39
Fig. 5
Fig. 5
MSN-ALK is an activating and oncogenic fusion gene potentially targetable with ALK inhibitors. a Illustration of the MSN-ALK fusion gene. Arrows show genomic break points. b Western blot showing levels of ALK downstream signaling proteins in human salivary gland (HSG) cells expressing empty vector (EV), MSN, or MSN-ALK. P phosphorylated, kDa kilodalton. c Proliferation of HSG cells expressing EV, MSN, or MSN-ALK. Data are mean ± SEM using three technical replicates. **P < 0.01, ***P < 0.001; two-way ANOVA with Tukey’s multiple comparison test. The experiment was replicated two times. d Representative photographs (left) and quantification (right) of soft agar colony formation assay. Data are mean ± SEM using three technical replicates. ****P < 0.0001; one-way ANOVA with Tukey’s multiple comparison test. The experiment was replicated two times
Fig. 6
Fig. 6
The number of copy number alterations is associated with tumor origin and prognosis. a All significant CNAs in MECA tumors, grouped by origin and fusion gene status. b Number of CNAs in MECA de novo and MECA ex-PA tumors. **P < 0.01; Mann–Whitney test. n = 15 + 22. c Freedom from recurrence in patients with different number of CNAs. *P < 0.05, ****P < 0.0001; log-rank test. n = 9 (0 CNAs) + 20 (1–9 CNAs) + 8 (>9 CNAs)
Fig. 7
Fig. 7
The role of FGFR1-PLAG1 and TGFBR3-PLAG1 in MECA development

References

    1. Savera AT, Sloman A, Huvos AG, Klimstra DS. Myoepithelial carcinoma of the salivary glands: a clinicopathologic study of 25 patients. Am. J. Surg. Pathol. 2000;24:761–774. doi: 10.1097/00000478-200006000-00001. - DOI - PubMed
    1. Xiao CC, Baker AB, White-Gilbertson SJ, Day TA. Prognostic factors in myoepithelial carcinoma of the major salivary glands. Otolaryngol. Head Neck Surg. 2016;154:1047–1053. doi: 10.1177/0194599816637605. - DOI - PubMed
    1. Eveson J. W. A. P., Gnepp D. R., El-Naggar A. K. Pathology and Genetics of Head and Neck Tumours (International Agency for Research on Cancer, World Health Organization, Lyon, France, 2005).
    1. Katabi N, et al. Prognostic factors of recurrence in salivary carcinoma ex pleomorphic adenoma, with emphasis on the carcinoma histologic subtype: a clinicopathologic study of 43 cases. Hum. Pathol. 2010;41:927–934. doi: 10.1016/j.humpath.2009.12.011. - DOI - PubMed
    1. Kong M, et al. Prognostic factors in myoepithelial carcinoma of salivary glands: a clinicopathologic study of 48 cases. Am. J. Surg. Pathol. 2015;39:931–938. doi: 10.1097/PAS.0000000000000452. - DOI - PMC - PubMed

Publication types

MeSH terms

Substances