. 2017 Oct 30;8(1):1182.
doi: 10.1038/s41467-017-01172-5.

Sortilin limits EGFR signaling by promoting its internalization in lung cancer

Affiliations

Sortilin limits EGFR signaling by promoting its internalization in lung cancer

Hussein Al-Akhrass et al. Nat Commun. .

Abstract

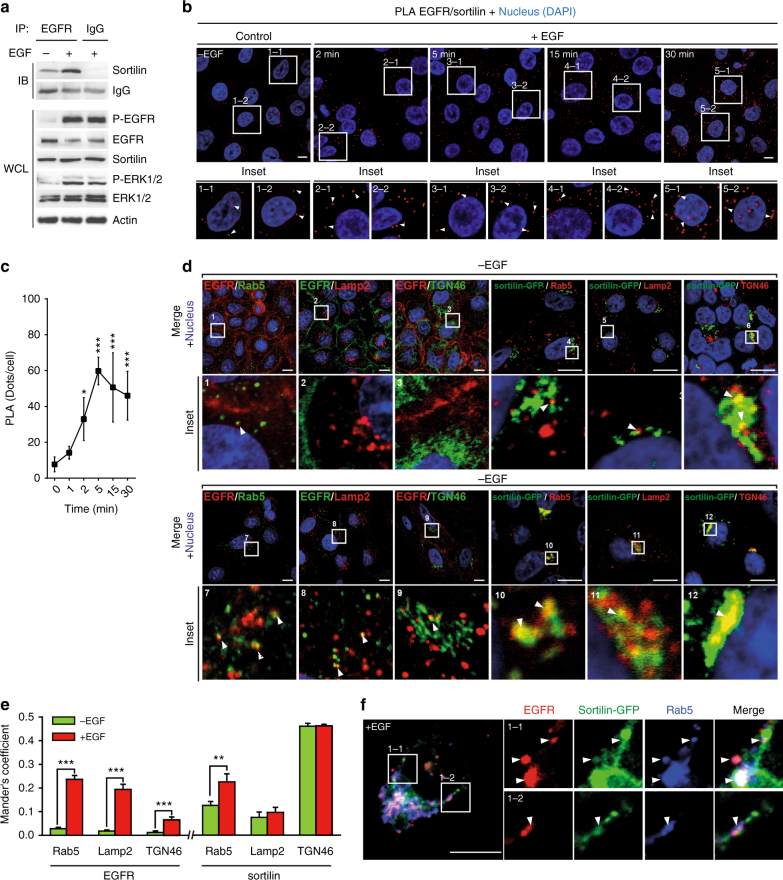
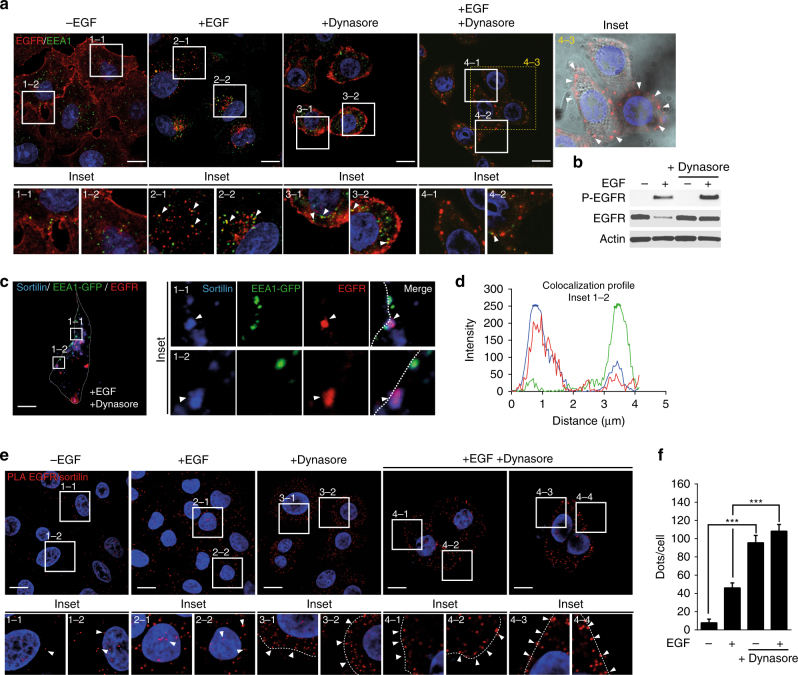
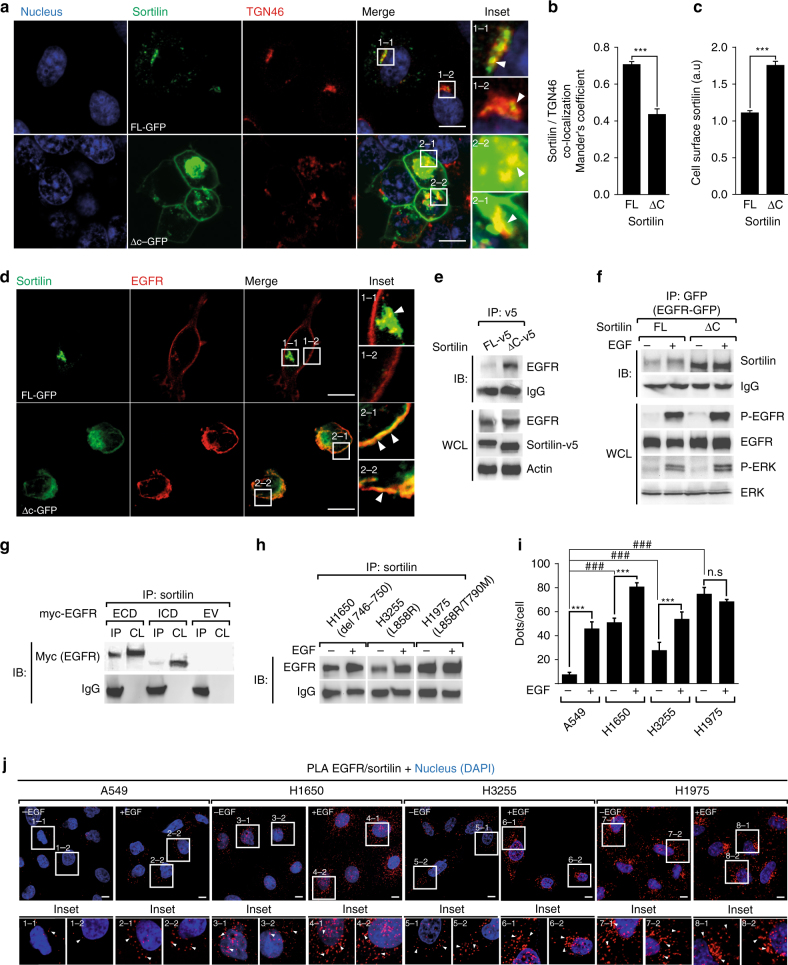
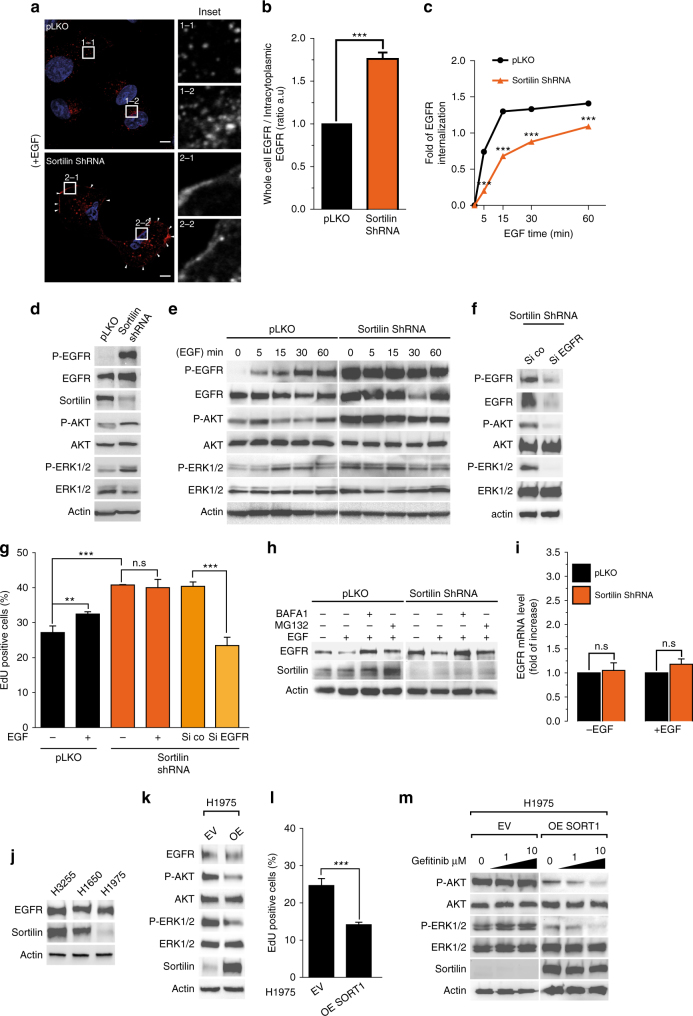
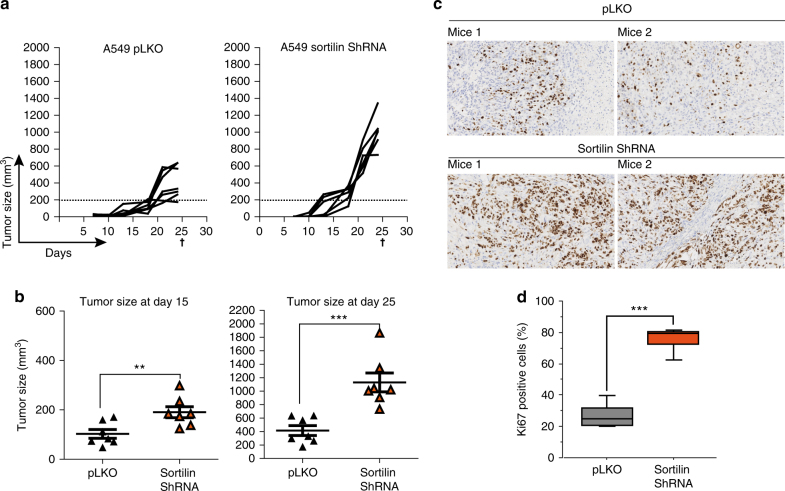
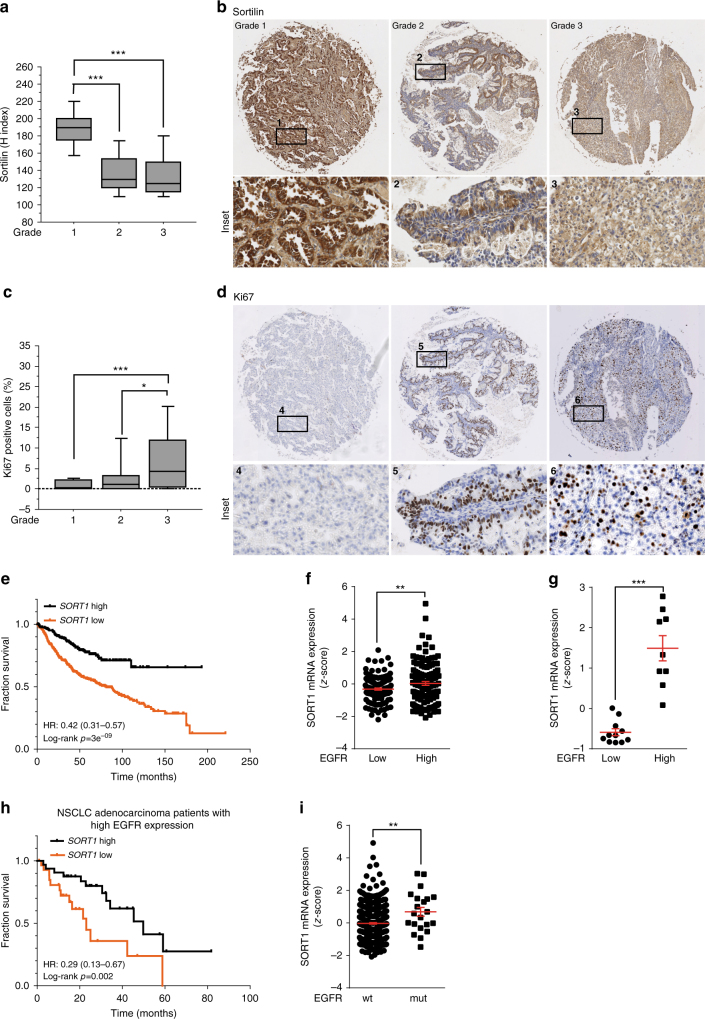
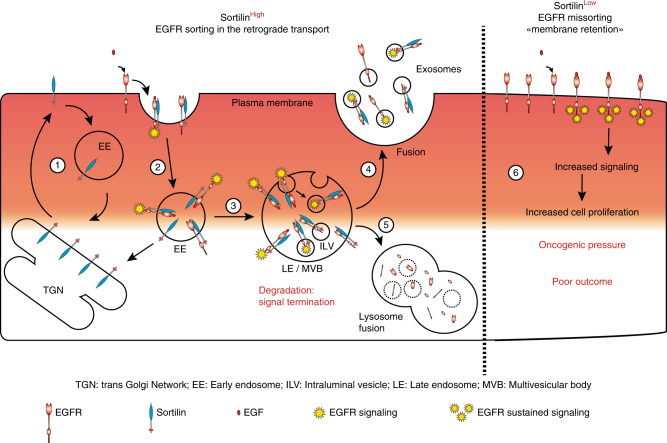
Tyrosine kinase receptors such as the epidermal growth factor receptor (EGFR) transduce information from the microenvironment into the cell and activate homeostatic signaling pathways. Internalization and degradation of EGFR after ligand binding limits the intensity of proliferative signaling, thereby helping to maintain cell integrity. In cancer cells, deregulation of EGFR trafficking has a variety of effects on tumor progression. Here we report that sortilin is a key regulator of EGFR internalization. Loss of sortilin in tumor cells promoted cell proliferation by sustaining EGFR signaling at the cell surface, ultimately accelerating tumor growth. In lung cancer patients, sortilin expression decreased with increased pathologic grade, and expression of sortilin was strongly correlated with survival, especially in patients with high EGFR expression. Sortilin is therefore a regulator of EGFR intracellular trafficking that promotes receptor internalization and limits signaling, which in turn impacts tumor growth.


Conflict of interest statement

The authors declare no competing financial interests.

Figures

Fig. 1
Fig. 1
EGF promotes the EGFR—sortilin interaction. a A549 cells grown in complete cell culture media were stimulated or not with EGF (50 ng/mL) for 30 min. Immunoprecipitations (IP) were performed using anti-EGFR antibody, and the immunocomplexes were immunoblotted (IB) using anti-sortilin antibody (top). In parallel, immunoblots for P-EGFR, EGFR, sortilin, P-ERK, and ERK were performed on whole-cell lysates (WCL); the isotypic lane Immunoglobulin G (IgG) represents the IP control. b Proximity ligation assays (PLA) were performed on A549 cells, non-stimulated or stimulated with EGF (50 ng/mL) for 2, 5, 15, and 30 min. Red spots indicate sites of proximity ligation assay amplification, reflecting the EGFR—sortilin interaction (white arrows). Scale bar, 10 µm. c Quantification of PLA time course, in comparison with non-stimulated cells. d A549 cells were stimulated or not with EGF (50 ng/mL) for 30 min, and then co-immunolabeled for EGFR and markers of the early endosome (Rab5), the late endosome/lysosome (LAMP2) and the trans-Golgi network (TGN46). For sortilin labeling, A549 cells were transiently transfected with sortilin-GFP to adapt a set of functional antibodies, and then immunolabeled for the same markers. Scale bar, 5 µm. e Quantitative analysis of EGFR or sortilin-GFP co-localization with the aforementioned organelle-specific markers. f A549 cells were transiently transfected with sortilin-GFP, and then stimulated with EGF (50 ng/mL) for 30 min. Next, cells were fixed and co-immunolabeled for EGFR and Rab5. Scale bar, 10 µm. All values represent means ± SD, Student’s t-test *P < 0.05; ***P < 0.001. Each experiment has been repeated at least three times
Fig. 2
Fig. 2
EGFR interacts with sortilin at the cell surface. a A549 cells were pretreated or not with the cell-permeable dynamin inhibitor Dynasore (40 µM) for 2 h, and then stimulated or not with EGF (50 ng/mL) for 15 min. Cells were immunolabeled for EGFR and the early endosome marker EEA1, and then analyzed by confocal microscopy. Scale bar, 10 µm. Inset 4–3: Bright-field image of A549 cells; white arrows show EGFR clusters at the cell surface. Scale bar, 10 µm. b A549 cells were pretreated or not with Dynasore (40 µM) for 2 h, and then stimulated or not with EGF (50 ng/mL) for 15 min. The cell lysates were analyzed by western blotting for P-EGFR and EGFR. c A549 cells were transfected with EEA1-GFP, pretreated with Dynasore (40 µM) for 2 h, then stimulated with EGF (50 ng/mL) for 30 min. Next, cells were co-immunolabeled for EGFR and sortilin. Scale bar, 10 µm. The co-localization profile is shown in d. e Proximity ligation assays (PLA) were performed on A549 cells under the same conditions described above in a. Scale bar, 10 µm. f PLA quantification in comparison with A549 non-stimulated cells. All values represent means ± SD, Student’s t-test ***P < 0.001. Each experiment has been repeated at least three times
Fig. 3
Fig. 3
C-terminally truncated sortilin strongly interacts with EGFR at the cell surface independently of ligand stimulation. a HEK293 cells were transiently transfected with either full-length (FL) or C-terminally truncated (Δc) sortilin-GFP. Cells were fixed and immunolabeled for the trans-Golgi network marker TGN46, and then analyzed by confocal microscope. Scale bar, 10 µm. b Bars show the Mander’s coefficient, indicating that FL-sortilin-GFP co-localized with TGN46 to a greater degree than Δc-sortilin-GFP. c Bars show quantification of cell surface GFP intensity. d Strong interaction between EGFR and Δc-sortilin at the plasma membrane. HEK293 cells were transiently co-transfected with EGFR and FL- or Δc sortilin-GFP, and then fixed and immunolabeled for EGFR; immunofluorescence was analyzed by confocal microscopy. Scale bar, 10 µm. e HEK293 cells were transiently co-transfected with EGFR and FL or Δc sortilin-v5. Immunoprecipitations (IP) were performed using anti-v5 antibody, and immunocomplexes were analyzed by western blotting using anti-EGFR antibody. In parallel, immunoblots of EGFR and sortilin-v5 were performed on whole-cell lysate (WCL). f HEK293 cells were transiently co-transfected with EGFR-GFP and FL- or Δc sortilin. Next, cells were stimulated or not with EGF (50 ng/mL) for 30 min and immunoprecipitated using anti-GFP antibody. Immunocomplexes were analyzed by western blotting for sortilin. In parallel, immunoblots of P-EGFR, EGFR, P-ERK, and ERK were performed on WCL. g HEK293 cells were transiently co-transfected with ΔC sortilin and the myc-tagged extra- or intracellular domain (ECD and ICD, respectively). Next, cell lysates (CL) were immunoprecipitated (IP) with anti-sortilin and immunoblotted with anti-myc. h NSCLC cell lines harboring EGFR deletion (H1650) or point mutations (H3255, H1975) were stimulated or not with EGF (50 ng/mL) for 30 min. Cell lysates were immunoprecipitated (IP) using anti-sortilin, and immunocomplexes were analyzed by western blotting with anti-EGFR. i PLA quantification performed on NSCLC cell lines stimulated or not with EGF (50 ng/mL) for 30 min. j Proximity ligation assays (PLA) were performed on NSCLC cells under the same conditions as described in h. All values represent means ± SD, Student’s t-test ***P < 0.001. Each experiment has been repeated at least three times
Fig. 4
Fig. 4
Loss of sortilin greatly perturbs EGFR internalization and dramatically promotes EGFR signaling. a A549 cells expressing shRNA targeting sortilin and control cells (pLKO) were stimulated with EGF (50 ng/mL) for 30 min, and then fixed and immunolabeled for EGFR. Immunofluorescence was analyzed by confocal microscopy. The ratio between whole-cell and intracytoplasmic EGFR intensities, reflecting EGFR membrane retention, is quantified in b. c Sortilin-depleted and control A549 cells (pLKO) were stimulated with EGF (50 ng/mL) over a 60 min time course. At each time point, cell surface EGFR was stained at 4 °C using Alexa Fluor 488 anti-EGFR, and then analyzed by flow cytometry. Curves represent mean fluorescence intensity in sortilin-depleted cells relative to the control. d Cell lysates from sortilin-depleted (sortilin shRNA) or control A549 cells (pLKO) were immunoblotted with the indicated antibodies. e A549 sortilin-depleted and control cells (pLKO) were stimulated with EGF (50 ng/mL) over a 60 min time course. Cell lysates were analyzed by western blotting for components of the canonical EGFR signaling pathway using the indicated antibodies. f Sortilin-depleted cells were transfected with control siRNA (Si co) or EGFR siRNA. Cell lysates were analyzed by western blotting with the indicated antibodies. g Representative histograms of cell proliferation, as determined by EdU incorporation. Sortilin-depleted cells transfected or not with EGFR siRNA and control A549 cells (pLKO) were stimulated with EGF (50 ng/mL) for 1 h, and then fixed and treated for EdU incorporation. Percentages of EdU-positive cells were calculated by flow-cytometric analysis. h Sortilin-depleted (sortilin shRNA) or control A549 cells (pLKO) were pretreated with bafilomycin A1 (BAFA1) or MG132 for 2 h, and then stimulated or not with EGF (50 ng/mL) for 30 min. Cell lysates were analyzed by western blotting for EGFR and sortilin protein expression. i Quantitative PCR analysis of EGFR expression in sortilin-depleted and control A549 cells (pLKO) with or without EGF stimulation (50 ng/mL for 30 min). Results are presented in terms of fold change after normalization against HPRT mRNA. j Cell lysates from H3255, H1650, and H1975 were analyzed for EGFR and sortilin protein expression. k H1975 cells were transfected or not with SORT1 overexpression vector, and cell lysates were then analyzed by western blotting for the indicated proteins. l Representative histograms of cell proliferation, as determined by EdU incorporation in sortilin-overexpressing and control H1975 cells. m Sortilin-overexpressing and control H1975 cells were treated with increasing doses of gefitinib for 24 h, and cell lysates were analyzed by western blotting for the indicated proteins. All values represent means ± SD, Student’s t-test ***P < 0.001. Each experiment has been repeated at least three times
Fig. 5
Fig. 5
Sortilin depletion dramatically accelerates tumor growth in vivo. a Tumor growth curves showing evolution of the tumor volume after engraftment of 1 × 106 sortilin-depleted or control A549 cells (pLKO). b Grouped column scatter shows the mean difference tumor volume between sortilin-depleted and control cells, 15 and 25 days after engraftment. c 25 days after engraftment, all mice were killed, and tumors were excised and subjected to immunohistochemical analysis. Tumors from sortilin-depleted or control A549 cells were stained using anti-Ki-67 antibody. Percentages of Ki-67-positive cells are quantified in d. All values represent means ± SD, Student’s t-test **P < 0.01, ***P < 0.001. Each experiment has been repeated at least three times
Fig. 6
Fig. 6
Sortilin expression decreased with the tumor aggressiveness. a Boxplot diagram represents the quantification (Hirsch index) of sortilin expression in human lung adenocarcinoma (n = 78) and highlights the high expression of sortilin at low grade, as seen in representative images in b: grade I, well-differentiated; grade II, moderately differentiated; grade III, poorly differentiated. Magnification ×50, insets ×200. c Boxplot diagram of the percentage of Ki-67-positive nuclei, reflecting cancer cell proliferation, and tumor aggressiveness in the same patients shown in b with representative images d. Magnification ×50, insets ×200. e Kaplan−Meier curves of overall survival were constructed for the following groups of patients with high (black curve, n = 248) or low (orange curve, n = 425) SORT1 expression, using the online tool at kmplot.com. f In silico analysis of SORT1 expression in lung adenocarcinoma with high or low EGFR expression; data were obtained from the MSKCC cBioPortal for Cancer Genomics database or Genome Expression Omnibus. g Quantitative PCR analyses for SORT1 and EGFR expression in a cohort of patients (n = 20) with high or low EGFR expression. h Kaplan−Meier curves showing the survival benefit provided by high-SORT1 expression (black curve, n = 32) relative to low SORT1 expression (orange curve, n = 30) on a subset patients with high-EGFR expression; data were obtained from the lung adenocarcinoma cohort in the MSKCC cBioPortal database (n = 522). i In silico analysis for SORT1 expression in lung adenocarcinoma with or without EGFR TKI−sensitive mutations, using data from the MSKCC cBioPortal for Cancer Genomics database or Genome Expression Omnibus. For Kaplan–Meier curves, the log-rank (Mantel-cox) is used test to determine the statistical significance of association sortilin high or low expression and overall survival within lung adenocarcinoma patients, *P < 0.05 **P < 0.01 ***P < 0.001, Hazard Ratio (HR) is reported in time-to-event analysis. For Boxplot diagrams, median values are indicated by the transverse line within the box. Student’s t-test *P < 0.05, **P < 0.01, ***P < 0.001. Each experiment has been repeated at least three times
Fig. 7
Fig. 7
Model of sortilin function in regulation of EGFR at the cell surface Representative scheme in which sortilin acts as a key regulator of EGFR retrograde transport. Sortilin is mainly localized at the trans-Golgi network (TGN), and the plasma membrane fraction of sortilin cycles continually between the cell surface and the TGN via the endosomes (1). Sortilin binds both unstimulated and stimulated EGFR to allow their internalization (2). Thus, EGFR undergoes intracellular trafficking and sortilin mediates its loading in intraluminal vesicles (3). This ultimately results either in EGFR release through exosomes (4) or receptor degradation (5), thus ensuring signal termination. Conversely, sortilin downregulation impairs EGFR internalization (6), and EGFR consequently retained at the cell surface. Moreover, in sortilin-downregulated cells, EGFR exists in a hyperphosphorylated state, and transduces a constitutive survival signal that promotes tumor growth

Comment in

References

    1. Cancer Genome Atlas Research Network Comprehensive molecular profiling of lung adenocarcinoma. Nature. 2014;511:543–550. doi: 10.1038/nature13385. - DOI - PMC - PubMed
    1. Lemmon MA, Schlessinger J. Cell signaling by receptor tyrosine kinases. Cell. 2010;141:1117–1134. doi: 10.1016/j.cell.2010.06.011. - DOI - PMC - PubMed
    1. Ullrich A, et al. Human epidermal growth factor receptor cDNA sequence and aberrant expression of the amplified gene in A431 epidermoid carcinoma cells. Nature. 1984;309:418–425. doi: 10.1038/309418a0. - DOI - PubMed
    1. Tomas A, et al. WASH and Tsg101/ALIX-dependent diversion of stress-internalized EGFR from the canonical endocytic pathway. Nat. Commun. 2015;6:7324. doi: 10.1038/ncomms8324. - DOI - PMC - PubMed
    1. Capuani F, et al. Quantitative analysis reveals how EGFR activation and downregulation are coupled in normal but not in cancer cells. Nat. Commun. 2015;6:7999. doi: 10.1038/ncomms8999. - DOI - PMC - PubMed

Publication types