. 2017 Oct 30;7(1):14295.
doi: 10.1038/s41598-017-14533-3.

Hydrogen Bond Variations of Influenza A Viruses During Adaptation in Human

Affiliations

Hydrogen Bond Variations of Influenza A Viruses During Adaptation in Human

Jiejian Luo et al. Sci Rep. .

Abstract

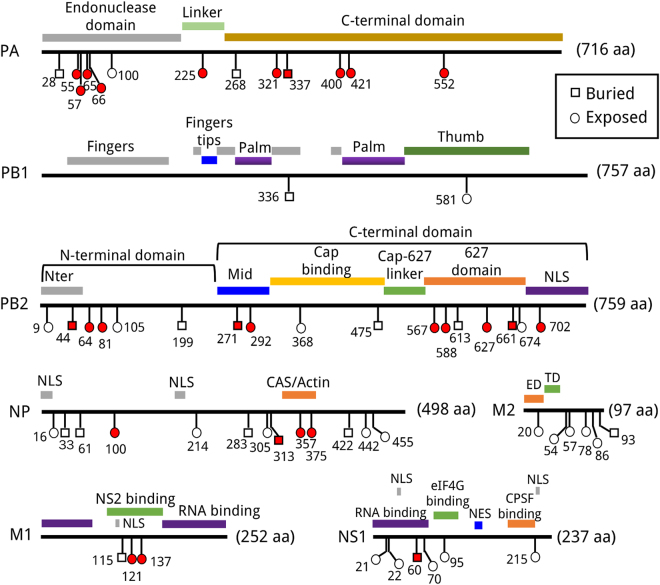
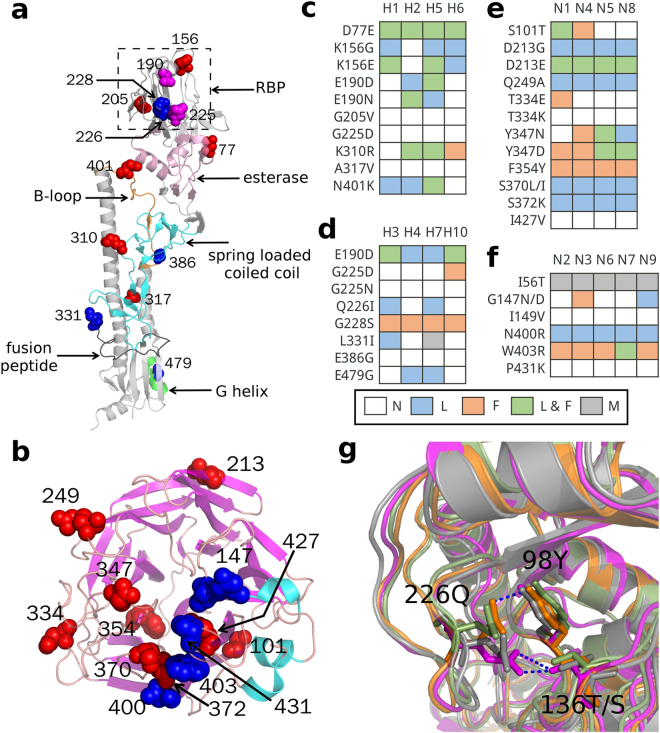
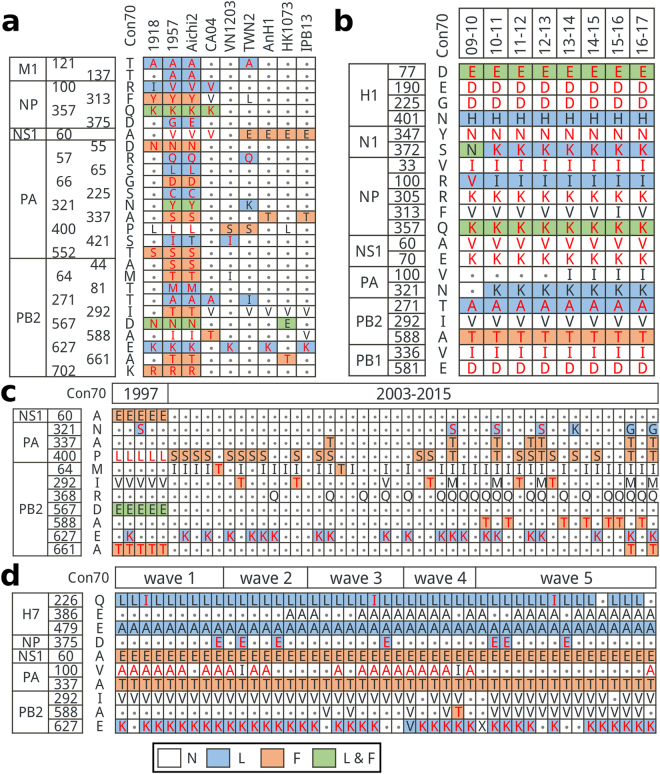
Many host specific mutations have been detected in influenza A viruses (IAVs). However, their effects on hydrogen bond (H-bond) variations have rarely been investigated. In this study, 60 host specific sites were identified in the internal proteins of avian and human IAVs, 27 of which contained mutations with effects on H-bonds. Besides, 30 group specific sites were detected in HA and NA. Twenty-six of 36 mutations existing at these group specific sites caused H-bond loss or formation in at least one subtype. The number of mutations in isolations of 2009 pandemic H1N1, human-infecting H5N1 and H7N9 varied. The combinations of mutations and H-bond changes in these three subtypes of IAVs were also different. In addition, the mutations in isolations of H5N1 distributed more scattered than those in 2009 pandemic H1N1 and H7N9. Eight wave specific mutations in isolations of the fifth H7N9 wave were also identified. Three of them, R140K in HA, Y170H in NA, and R340K in PB2, were capable of resulting in H-bond loss. As mentioned above, these host or group or wave specific H-bond variations provide us with a new field of vision for understanding the changes of structural features in the human adaptation of IAVs.


Conflict of interest statement

The authors declare that they have no competing interests.

Figures

Figure 1
Figure 1
Linear mapping of host specific sites of internal proteins against known functional domains. Functional regions of proteins were highlighted with color bars. Buried sites and exposed sites were labeled as square and round, respectively. The sites with mutations leading to the H-bond loss or formation were colored as red. Nter: N-terminal. NLS: nuclear localization signal. NES: nuclear export signal. ED: extracellular domain. TD: transmembrane domain.
Figure 2
Figure 2
Group specific sites and their H-bond variations in HA and NA. (a) The distribution of group specific sites on the structures of HA (PDB:4O5N). Sites of group 1 HA and group 2 HA were colored as red and blue, respectively. The sites 190 and 225 in magenta at the receptor binding pocket (RBP) of HA were common in two groups. (b) The distribution of group specific sites on the structures of NA (PDB:3TIA). Sites of group 1 NA and group 2 NA were colored as red and blue, respectively. H-bond variations of group specific sites in subtypes of group 1 HA (c), group 2 HA (d), group 1 NA (e), and group 2 NA (f). The background colors of each cell were representative for the state of H-bond variations. white: No H-bond variations marked as N; light blue: H-bond loss marked as L; orange: H-bond formation marked as F; light green: both H-bond loss and formation marked as L & F; gray: the sites which were absent in predicted structures because of incomplete templates of crystal structures were marked as M. (g) Superposition model of RBP of H3 (orange), H4 (light green), H7 (magentas), and H10 (gray). Residues 226Q, 98Y, and 136T/S were shown in stick mode. HB(226Q, 98Y, Nε2-H…Oη) in H3, HB(136T, 226Q, Oγ1-H…Oε1) and HB(226Q, 137T, Nε2-H…Oγ1) in H7 were shown in blue dot line.
Figure 3
Figure 3
H-bond variations in pandemic and sporadic human-infecting IAVs. (a) The residue usages of representative isolations at the 27 H-bond variation sites. The representative strains were listed as follow. 1918: A/Brevig Mission/1/1918(H1N1); 1957: A/Albany/20/1957(H2N2); Aichi2: A/Aichi/2/1968(H3N2); CA04: A/California/04/2009(H1N1); VN1203: A/Viet Nam/1203/2004(H5N1); TWN2: A/Taiwan/2/2013(H6N1); AnH1: A/Anhui/1/2013(H7N9); HK1073: A/HongKong/1073/99(H9N2); IPB13: A/Jiangxi/IPB13/2013(H10N8). (b) Dominant mutations and their H-bond variations in pH1N1 from 09–10 season to 16–17 season. (c) Mutations and their H-bond variations in human-infecting H5N1 isolations collected from 1997 to 2015. (d) Mutations and their H-bond variations in the five waves of H7N9 from 2013 to 2017. The columns of (c) and (d) were representative strains arranged chronologically. The background color of each cell was representative for the state of H-bond variations. white: No H-bond variations marked as N; light blue: H-bond loss marked as L; orange: H-bond formation marked as F; light green: both H-bond loss and formation marked as L & F. Con70 means the consensus sequence (70% threshold) of avian IAVs. Residues matched with Con70 were represented with dots. Residues prefer existing in human H1N1 and H3N2 (Human-preferential residues) were in a red font. Representative strains in (c) and (d) were listed in Tables S6 and S7, respectively.
Figure 4
Figure 4
Wave specific mutations and H-bond variations in the fifth H7N9 wave. (a) Residue usages and H-bond variations at the eight wave specific sites of the fifth wave. Residues matched with the strain A/Anhui/1/2013 (H7N9, AnH1) were represented with dots. The background color of each cell was representative for the state of H-bond variations. white: No H-bond variations; light blue: H-bond loss; orange: H-bond formation; light green: both H-bond loss and formation. (b and c) Mutation R140K of HA and the loss of HB(140R, 141R, Nη1-H…O). (d and e) Mutation Y170H of NA and the loss of HB(170Y, 113D, Oη-H…Oδ2). (f and g) Mutation R340K in cap binding domain of PB2 and the loss of HB(340R, 358E, Nε-H…Oε2) and HB(340R, 342E, Nη2-H…Oε2). The helix, sheet and loop were colored by cyan, magentas and orange, respectively. H-bonds were shown in blue dot line. Representative strains in (a) were listed in Table S7.

References

    1. Lozano R, et al. Global and regional mortality from 235 causes of death for 20 age groups in 1990 and 2010: A systematic analysis for the Global Burden of Disease Study 2010. Lancet. 2012;380:2095–2128. doi: 10.1016/S0140-6736(12)61728-0. - DOI - PMC - PubMed
    1. Cauldwell AV, et al. Viral determinants of influenza A virus host range. J. Gen. Virol. 2014;95:1193–1210. doi: 10.1099/vir.0.062836-0. - DOI - PubMed
    1. De Jong MD, Hien TT. Avian influenza A (H5N1) J. Clin. Virol. 2006;35:2–13. doi: 10.1016/j.jcv.2005.09.002. - DOI - PMC - PubMed
    1. Watanabe T, Watanabe S, Maher EA, Neumann G, Kawaoka Y. Pandemic potential of avian influenza A (H7N9) viruses. Trends Microbiol. 2014;22:623–631. doi: 10.1016/j.tim.2014.08.008. - DOI - PMC - PubMed
    1. Stevens J, et al. Glycan microarray analysis of the hemagglutinins from modern and pandemic influenza viruses reveals different receptor specificities. J. Mol. Biol. 2006;355:1143–1155. doi: 10.1016/j.jmb.2005.11.002. - DOI - PubMed

Publication types

MeSH terms

Substances

LinkOut - more resources