. 2017 Oct 30;7(1):14329.
doi: 10.1038/s41598-017-14720-2.

Biomechanical, ultrastructural, and electrophysiological characterization of the non-human primate experimental glaucoma model

Affiliations

Biomechanical, ultrastructural, and electrophysiological characterization of the non-human primate experimental glaucoma model

VijayKrishna Raghunathan et al. Sci Rep. .

Abstract

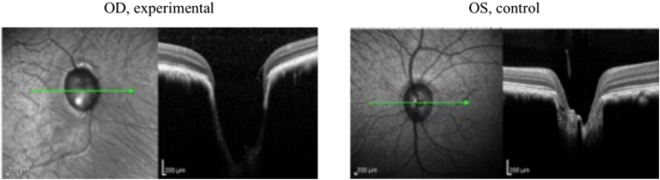
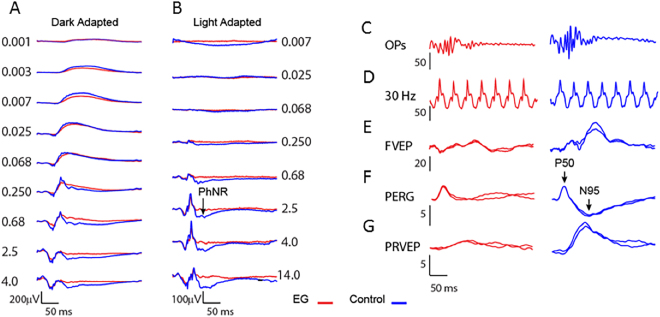
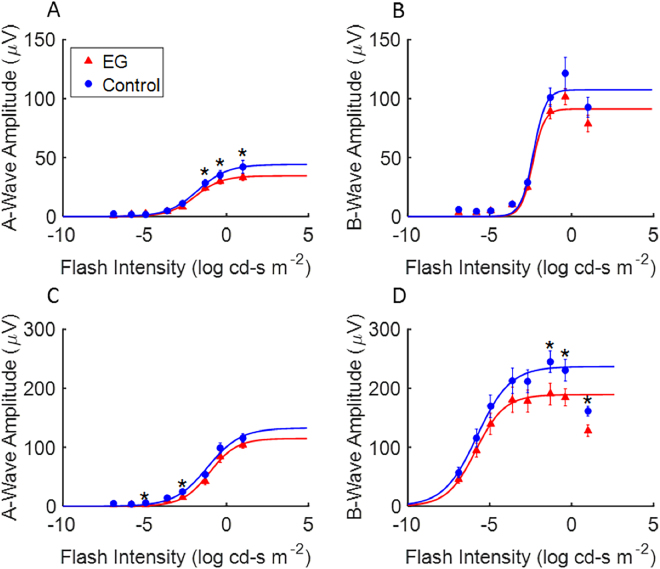
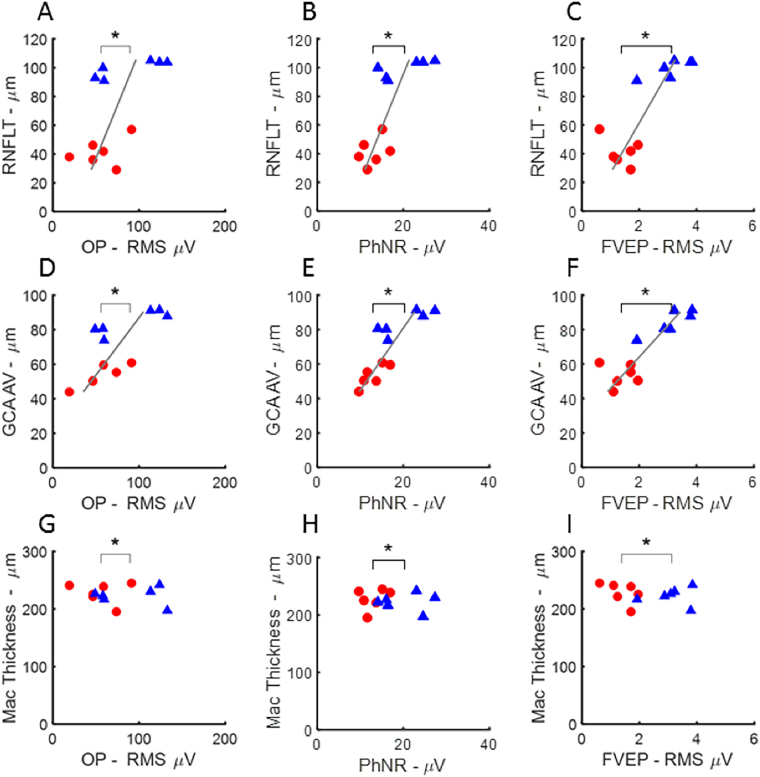
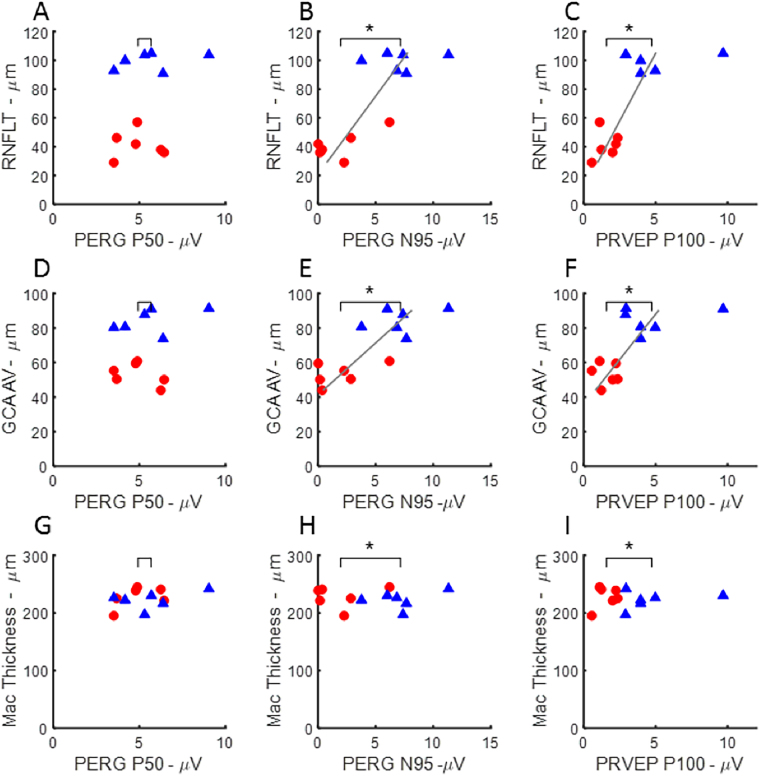
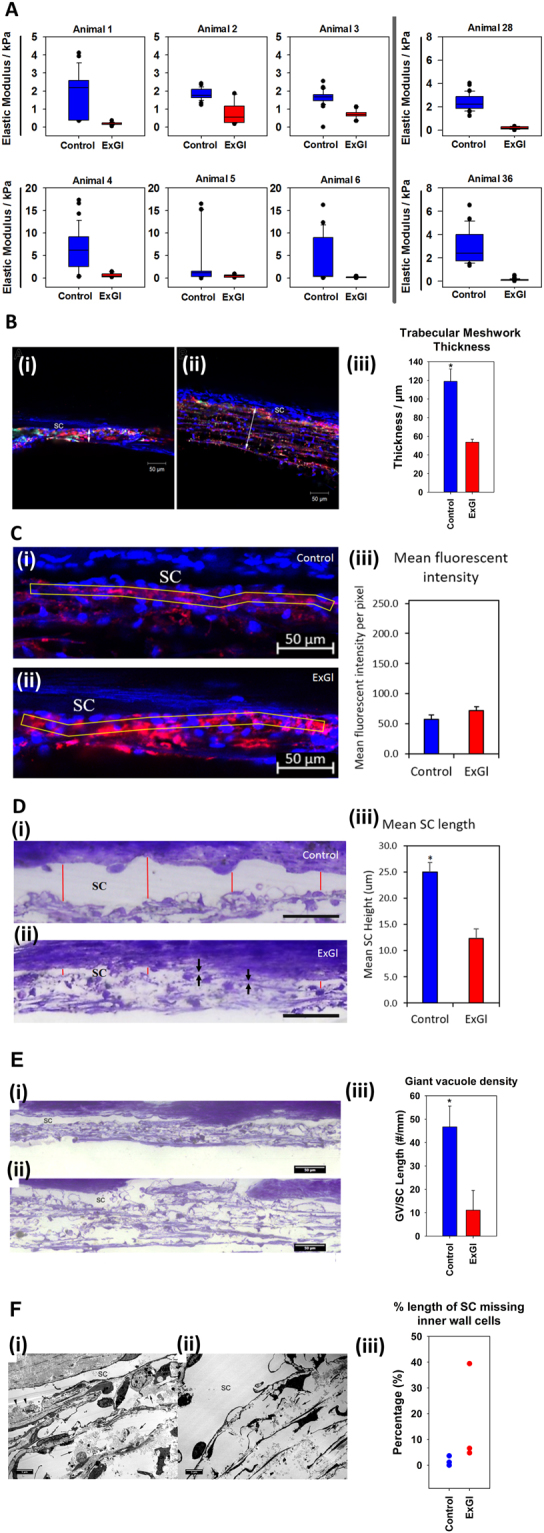
Laser-induced experimental glaucoma (ExGl) in non-human primates (NHPs) is a common animal model for ocular drug development. While many features of human hypertensive glaucoma are replicated in this model, structural and functional changes in the unlasered portions of trabecular meshwork (TM) of laser-treated primate eyes are understudied. We studied NHPs with ExGl of several years duration. As expected, ExGl eyes exhibited selective reductions of the retinal nerve fiber layer that correlate with electrophysiologic measures documenting a link between morphologic and elctrophysiologic endpoints. Softening of unlasered TM in ExGl eyes compared to untreated controls was observed. The degree of TM softening was consistent, regardless of pre-mortem clinical findings including severity of IOP elevation, retinal nerve fiber layer thinning, or electrodiagnostic findings. Importantly, this softening is contrary to TM stiffening reported in glaucomatous human eyes. Furthermore, microscopic analysis of unlasered TM from eyes with ExGl demonstrated TM thinning with collapse of Schlemm's canal; and proteomic analysis confirmed downregulation of metabolic and structural proteins. These data demonstrate unexpected and compensatory changes involving the TM in the NHP model of ExGl. The data suggest that compensatory mechanisms exist in normal animals and respond to elevated IOP through softening of the meshwork to increase outflow.


Conflict of interest statement

The authors declare that they have no competing interests.

Figures

Figure 1
Figure 1
Representative pre-euthanasia OCT images from Animal Number 5 demonstrate optic nerve head (ONH) cupping, neuroretinal rim thinning, and posterior displacement of the lamina cribrosa. (OD = Right Eye; OS = Left Eye).
Figure 2
Figure 2
Examples of electrophysiologic recordings from Set B (n = 6 animals). ExGl eye indicated in red, fellow control eye in blue. (A) Dark-adapted full-field ERG flash intensity series. (B) Light adapted full-field single flash intensity series. Note the emergence of the photopic negative response (PhNR) at the higher flash strengths. (C) Oscillatory potentials (OPs) band-pass filtered from the DA 2.5 flash intensity ERG. (D) Light adapted full-field 30 Hz flicker. (E) Light adapted flash-evoked cortical potential (FVEP). (F) ERG evoked by checkerboard pattern reversing at 2 Hz (PERG). (G) cortical VEP evoked by the 2 Hz pattern stimulus.
Figure 3
Figure 3
Flash intensity series under dark- and light- adapted conditions for ExGl eyes (Red, triangles) and fellow control eyes (Blue, circles) in Set B (n = 6 animals). (A) Dark adapted a-wave amplitude versus flash strength. (B) Dark adapted b-wave amplitude versus flash strength. (C) Light adapted a-wave amplitude versus flash strength, (D) Light adapted b-wave amplitude versus flash strength. Data points fitted with compressive non-linear function (see text).
Figure 4
Figure 4
Scatter plots illustrating mean differences and correlations between full-field electrophysiological measures and OCT measures of retinal nerve fiber layer thickness (RNFLT from manual segmentation of Spectralis™), average ganglion cell analysis from the Cirrus™ (GCA AV), and macular thickness estimates from the Cirrus™ (Mac Thickness) in Set B (n = −6 animals). Full-field electrophysiology parameters plotted versus OCT measures for ExGl (red, circles) and control (blue, triangles) eyes. Bracket tick marks indicate the means of the parameters for ExGl and control eyes. Significant differences between eyes for the parameter are indicated by asterisks. Significantly thinner segmented OCT layers were present in ExGl eyes, compared with controls, for RNFLT (p < 0.01) and GCA AV (p < 0.01), but not macular thickness (p > 0.6). Significantly lower amplitude electrophysiologic responses were present in ExGl eyes for full-field electrophysiology measures OPs (p < 0.01), PhNRs (p < 0.01), and FVEPs (p < 0.01). Significant correlations between RNFLT electrophysiology parameters are indicated by the presence of a gray line showing the least-squares linear fit. Significant correlations between RNFLT and the full-field electrophysiology measures were found for PhNR (p < 0.01), OPs (p < 0.01) and FVEP (p < 0.01), AC). GCA AV also showed strong positive correlations with OP, PhNR and FVEP amplitudes, DE) Macular Thickness was not affected by ExGl and was not correlated with these full-field electrophysiology measures GI). Additional plots of full-field ERGs and OCTs are shown in the Supplemental Data.
Figure 5
Figure 5
Relationship between electrophysiology elicited by pattern-stimulation and OCT measure in eyes with ExGl (red, circles) and fellow control eyes (blue, triangles) from Set B (n = 6 animals). Significant differences between means and significant correlations indicated as in Fig. 4. PERG N95 and PRVEP P100, but not PERG P50 amplitudes were significantly lower in ExGl compared with fellow control eyes, indicated by starred horizontal brackets (]*). RNFLT was strongly correlated with PERG N95 and PRVEP P100, but not PERG P50, A–C). Likewise, PERG N95 and PRVEP P100 amplitudes were highly correlated with GCA AV, but not the PERG P50 (D–F). There was no correlation between Macular Thickness OCT and pattern-elicited ERG or VEP measures (G–I).
Figure 6
Figure 6
Comparison of results of atomic force microscopy (AFM), confocal microscopy, light microscopy, and transmission electron microscopy (TEM) between eyes with experimental glaucoma (ExGl/OD) and untreated control (OS) eyes (n = 8 animals for AFM; n = 3 animals for microscopy). (A) Box and whisker plots demonstrating the relative elastic moduli of untreated normal eyes (blue) and eyes with ExGl (red). (B) Comparison of the trabecular meshwork (TM) thickness between eyes with ExGl and normal control eyes. (i-ii): Representative confocal images show that the TM thickness (double arrow) was smaller in a high-tracer region of an eye with ExGl (i) compared to similar region of a normal eye (ii). SC = Schlemm’s canal. (iii): The TM thickness was significantly smaller in the high-tracer regions of eyes with ExGl compared to similar regions of the normal eyes. *: p < 0.05. Fluorescence of the tracer dye is indicated in red. (C) Fluorescence Intensity (i-ii) Representative confocal images showed no significant difference in (iii) fluorescence intensity between non-lasered regions of ExGl eyes and similar region of normal control eyes. (D) Height of Schlemm’s canal (SC). (i-ii): Representative light microcopy images showed that the (iii) height of SC was significantly narrower in ExGl than normal control eyes (red lines). SC was collapse in the some regions (arrows) in ExGl eyes. (E): Giant vacuole density. (i-ii): Representative light microcopy images showed significantly fewer giant vacuoles in the non-lasered region of an eye with ExGl (i) compared to the high-tracer region of a normal eye (ii). (iii): Significantly more giant vacuoles were found in the high-tracer region of normal eyes compared to the non-lasered region of eyes with ExGl (*p < 0.05). (F) Comparison of ultrastructure of the Schlemm’s canal (SC) and juxtacanalicular tissue (JCT) between eyes with ExGl and normal control eyes. (i): A representative electron microscopy image of the JCT and inner wall of SC from an eye with ExGl. Loose and expanded JCT was seen in the high-tracer region (arrow). SC was narrower compared to normal control eye, some inner wall endothelial cells along SC were lost (arrowheads), and some tracers were observed inside SC. More tracers were observed in the high-tracer regions of the eyes with ExGl compared to normal eyes. (ii): An electron microscopy image of the JCT and inner wall region from a normal eye. Loose and expanded JCT was seen in the high-tracer region (arrow). SC was open and inner wall cells were intact. (iii): Percent length of SC missing inner wall endothelial cells. More inner wall endothelial cells along SC appeared to be lost in the eyes with ExGl compared to the normal eyes.

References

    1. Quigley HA, Broman AT. The number of people with glaucoma worldwide in 2010 and 2020. Br J Ophthalmol. 2006;90:262–267. doi: 10.1136/bjo.2005.081224. - DOI - PMC - PubMed
    1. Group CN-TGS. Comparison of glaucomatous progression between untreated patients with normal-tension glaucoma and patients with therapeutically reduced intraocular pressures. American journal of ophthalmology. 1998;126:487–497. doi: 10.1016/S0002-9394(98)00223-2. - DOI - PubMed
    1. Heijl A, et al. Reduction of intraocular pressure and glaucoma progression: results from the Early Manifest Glaucoma Trial. Arch Ophthalmol. 2002;120:1268–1279. doi: 10.1001/archopht.120.10.1268. - DOI - PubMed
    1. Lee DA, Higginbotham EJ. Glaucoma and its treatment: a review. Am J Health Syst Pharm. 2005;62:691–699. doi: 10.2146/ajhp050311. - DOI - PubMed
    1. Rasmussen CA, Kaufman PL. Exciting directions in glaucoma. Can J Ophthalmol. 2014;49:534–543. doi: 10.1016/j.jcjo.2014.08.007. - DOI - PMC - PubMed

Publication types