. 2017 Oct 30;7(1):14341.
doi: 10.1038/s41598-017-14767-1.

A cell based, high throughput assay for quantitative analysis of Hedgehog pathway activation using a Smoothened activation sensor

Affiliations

A cell based, high throughput assay for quantitative analysis of Hedgehog pathway activation using a Smoothened activation sensor

Evgenii A Albert et al. Sci Rep. .

Abstract

The Hedgehog (Hh) signalling cascade plays an important role in development and disease. In the absence of Hh ligand, activity of the key signal transducer Smoothened (Smo) is downregulated by the Hh receptor Patched (Ptc). However, the mechanisms underlying this inhibition, and especially its release upon ligand stimulation, are still poorly understood, in part because tools for following Smo activation at the subcellular level were long lacking. To address this deficit we have developed a high throughput cell culture assay based on a fluorescent sensor for Drosophila Smo activation. We have screened a small molecule inhibitor library, and observed increased Smo sensor fluorescence with compounds aimed at two major target groups, the MAPK signalling cascade and polo and aurora kinases. Biochemical validation for selected inhibitors (dobrafenib, tak-733, volasertib) confirmed the screen results and revealed differences in the mode of Smo activation. Furthermore, monitoring Smo activation at the single cell level indicated that individual cells exhibit different threshold responses to Hh stimulation, which may be mechanistically relevant for the formation of graded Hh responses. Together, these results thus provide proof of principle that our assay may become a valuable tool for dissecting the cell biological basis of Hh pathway activation.


Conflict of interest statement

The authors declare that they have no competing interests.

Figures
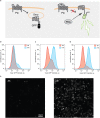
Figure 1
Figure 1
Direct detection of Smo activation using a SmoIP transgenic S2 cell line. (a) SmoIP detection principle. In the inactive state, an intramolecular loop in the Smo cytoplasmic tail forces an inserted cpGFP cassette from the Inverse Pericam (IP) Ca2+ sensor into a nonfluorescent conformation. During pathway activation, dissolution of this loop by Smo phosphorylation allows the IP cassette to relax into a fluorescent state. (bd) FACS analysis of UAS-SmoIP transgenic cell lines following 24 h stimulation with Hh conditioned medium. Cells were screened as a polyclonal line following 3 weeks selection (b), following iterative sorting of strongly responding cells (c), and as a single cell derived, clonal line (cl14) (d). (e) Confocal live-cell images of cl14 response to Hh.
Figure 2
Figure 2
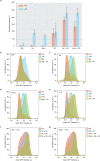
The SmoIP assay captures the endogenous pathway response to chemical perturbation. (a) Average effect of h89 (PKA inhibitor), fsk, IBMX (PKA activators), and OA (phosphatase inhibitor), alone or in combination, on baseline and Hh induced SmoIP fluorescence response. Effect of Hh stimulation on untreated cells set to 100% (dashed line). N = 3–6 replicates per experiment, *p < 0.05 relative to control Hh stimulation, Mann-Whitney U-test, error bars indicate SD. (bg) FACS histograms for individual experiments using the indicated components.
Figure 3
Figure 3
Time and concentration dependence of the SmoIP response. (a) SmoIP fluorescence signal of cl14 cells stimulated 1:1 with Hh conditioned medium plotted against stimulation time (b) SmoIP fluorescence signal of cl14 cells after 24 h of stimulation plotted against ratio of Hh conditioned and fresh medium. (c) FACS histograms for individual points of the concentration curve, numbers represent ration between condition and fresh medium. (a,b) N = 2–6 replicates, error bars indicate SD.
Figure 4
Figure 4
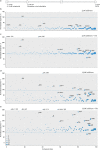
Screening a small molecule inhibitor library for modulation of SmoIP fluorescence. (a) Schematic representation of screen setup. (be) Normalized effect of inhibitors grouped according to their primary targets on SmoIP fluorescence. Effect of Hh stimulation on untreated cells set as 100% (dashed line). Diameter of circle reflects number of components per cluster, cutoff N ≥ 3, clusters sorted along X axis accordingly. (b,c), inhibitors used at 2 µM, (d,e) at 15 µM.
Figure 5
Figure 5
Inhibitor classes with consistent effect on Smo activation. SmoIP fluorescence of cl14 cells stimulated for 24 h with Hh conditioned medium in the presence of individual compounds inhibiting the indicated, selected primary targets. Effect of Hh stimulation on untreated cells set as 100% (dashed line). Inhibitor concentration 15 µM, red bars indicate median, red boxes mark compounds selected for subsequent independent validation experiments.
Figure 6
Figure 6
Validation of screen results for selected inhibitors. (a) FACS histograms of SmoIP fluorescence following treatment with 15 µM tak-733 (MEK inhibitor), dobrafenib (dbn, Raf inhibitor) or volasertib (vlt, polo inhibitor) in the presence or absence of Hh. Red and blue dashed line indicate baseline and Hh induced fluorescence, respectively, in untreated control cells. (b) Confocal live-cell images corresponding to the histograms in (a). (ce) Western blots for GFP, Smo and Ptc on lysates of Cl14 (c), S2 (d) and cl8 cells (e) in the presence of indicated inhibitors. Tubulin (c,e) or actin (d) used as loading control. (f) Ptc transcription in S2 cells following inhibitor treatment. Expression normalized to GAPDH2, N = 3–4, mean ± sd, *p < 0.05, Mann-Whitney U-test.

References

    1. Briscoe J, Therond PP. The mechanisms of Hedgehog signalling and its roles in development and disease. Nat Rev Mol Cell Biol. 2013;14:416–429. doi: 10.1038/nrm3598. - DOI - PubMed
    1. Kuwabara PE, Labouesse M. The sterol-sensing domain: multiple families, a unique role? Trends in genetics: TIG. 2002;18:193–201. doi: 10.1016/S0168-9525(02)02640-9. - DOI - PubMed
    1. Taipale J, Cooper MK, Maiti T, Beachy PA. Patched acts catalytically to suppress the activity of Smoothened. Nature. 2002;418:892–897. doi: 10.1038/nature00989. - DOI - PubMed
    1. Nachtergaele S, et al. Oxysterols are allosteric activators of the oncoprotein Smoothened. Nat Chem Biol. 2012;8:211–220. doi: 10.1038/nchembio.765. - DOI - PMC - PubMed
    1. Byrne, E. F. et al. Structural basis of Smoothened regulation by its extracellular domains. Nature535 (2016). - PMC - PubMed

Publication types

MeSH terms

LinkOut - more resources