

A Computational Method of Defining Potential Biomarkers based on Differential Sub-Networks
- PMID: 29085035
- PMCID: PMC5662748
- DOI: 10.1038/s41598-017-14682-5
A Computational Method of Defining Potential Biomarkers based on Differential Sub-Networks
Abstract
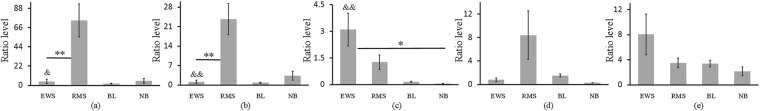
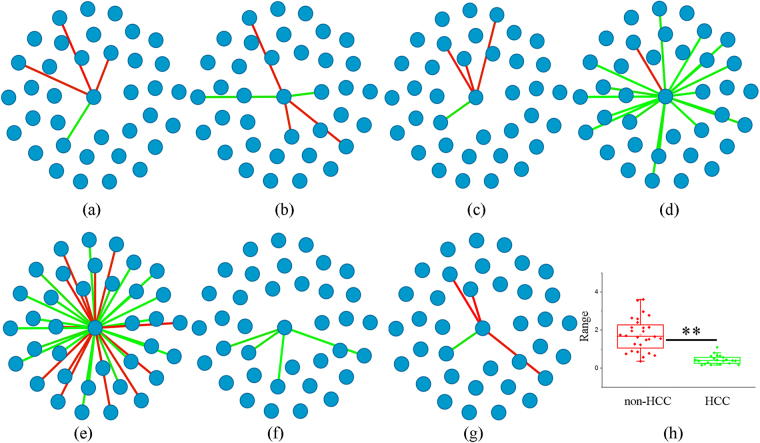
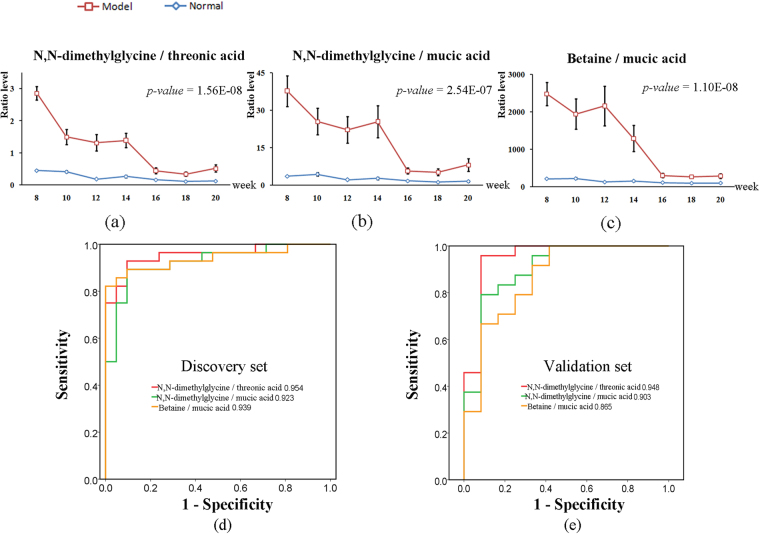
Analyzing omics data from a network-based perspective can facilitate biomarker discovery. To improve disease diagnosis and identify prospective information indicating the onset of complex disease, a computational method for identifying potential biomarkers based on differential sub-networks (PB-DSN) is developed. In PB-DSN, Pearson correlation coefficient (PCC) is used to measure the relationship between feature ratios and to infer potential networks. A differential sub-network is extracted to identify crucial information for discriminating different groups and indicating the emergence of complex diseases. Subsequently, PB-DSN defines potential biomarkers based on the topological analysis of these differential sub-networks. In this study, PB-DSN is applied to handle a static genomics dataset of small, round blue cell tumors and a time-series metabolomics dataset of hepatocellular carcinoma. PB-DSN is compared with support vector machine-recursive feature elimination, multivariate empirical Bayes statistics, analyzing time-series data based on dynamic networks, molecular networks based on PCC, PinnacleZ, graph-based iterative group analysis, KeyPathwayMiner and BioNet. The better performance of PB-DSN not only demonstrates its effectiveness for the identification of discriminative features that facilitate disease classification, but also shows its potential for the identification of warning signals.
Conflict of interest statement
The authors declare that they have no competing interests.
Figures

References
-
- Saccenti E, Hoefsloot HCJ, Smilde AK, Westerhuis JA, Hendriks MMWB. Reflections on univariate and multivariate analysis of metabolomics data. Metabolomics. 2013;10:361–374. doi: 10.1007/s11306-013-0598-6. - DOI
-
- Guyon I, Weston J, Barnhill S, Vapnik V. Gene selection for cancer classification using support vector machines. MLear. 2002;46:389–422.
-
- Goldberg DE, Holland JH. Genetic algorithms and machine learning. MLear. 1988;3:95–99.
Publication types
MeSH terms
Substances
LinkOut - more resources
Full Text Sources
Other Literature Sources
