Randomized Controlled Trial
. 2017 Aug 22:115:T4.
eCollection 2017 Aug.

Evaluation of Visual Field and Imaging Outcomes for Glaucoma Clinical Trials (An American Ophthalomological Society Thesis)

Affiliations
Randomized Controlled Trial

Evaluation of Visual Field and Imaging Outcomes for Glaucoma Clinical Trials (An American Ophthalomological Society Thesis)

David F Garway-Heath et al. Trans Am Ophthalmol Soc. .

Abstract

Purpose: To evaluate the ability of various visual field (VF) analysis methods to discriminate treatment groups in glaucoma clinical trials and establish the value of time-domain optical coherence tomography (TD OCT) imaging as an additional outcome.

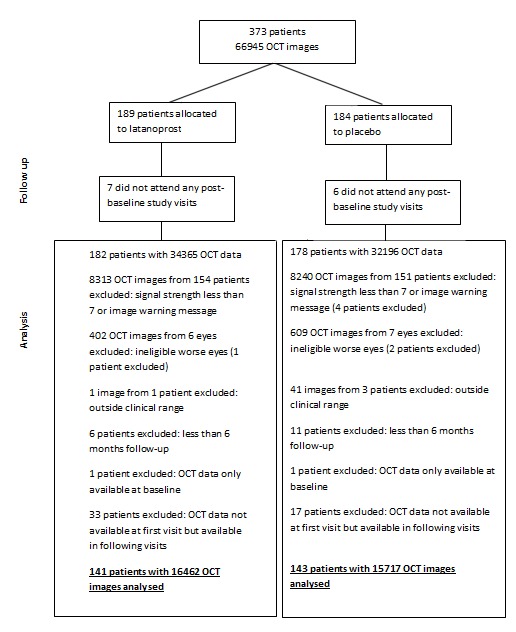
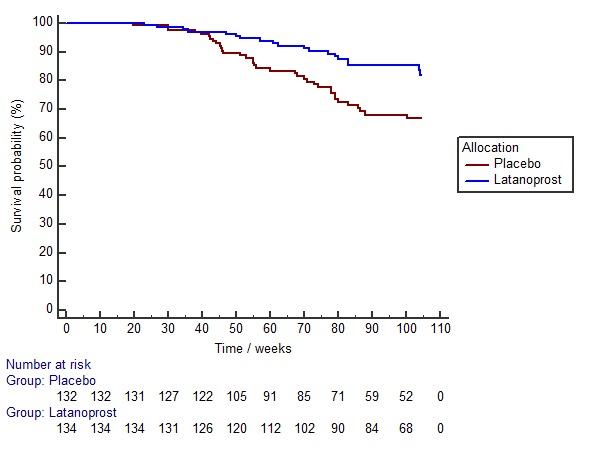
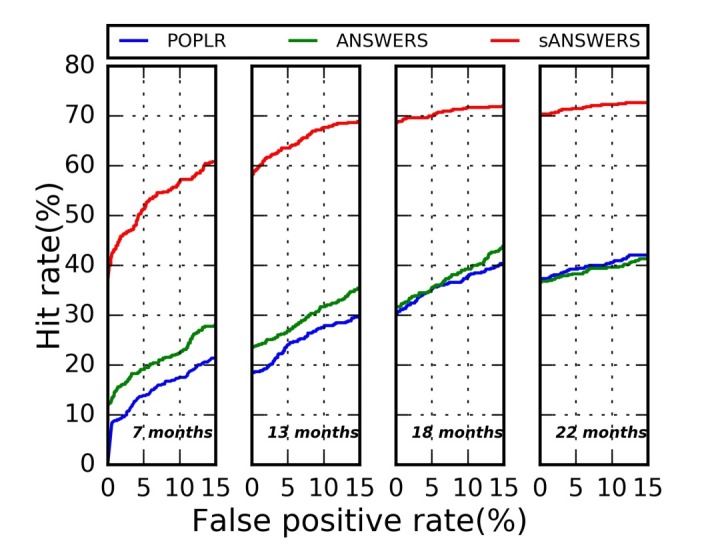
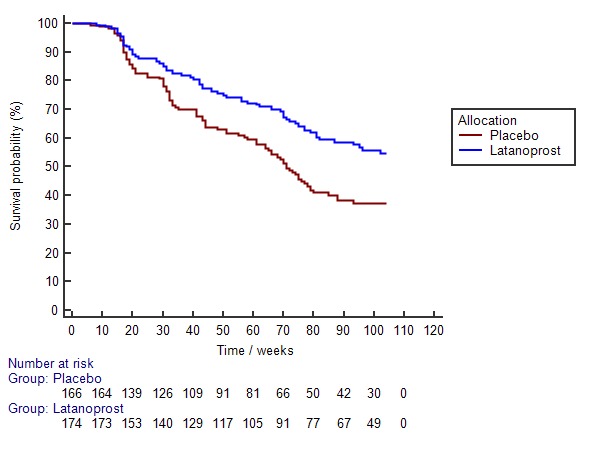
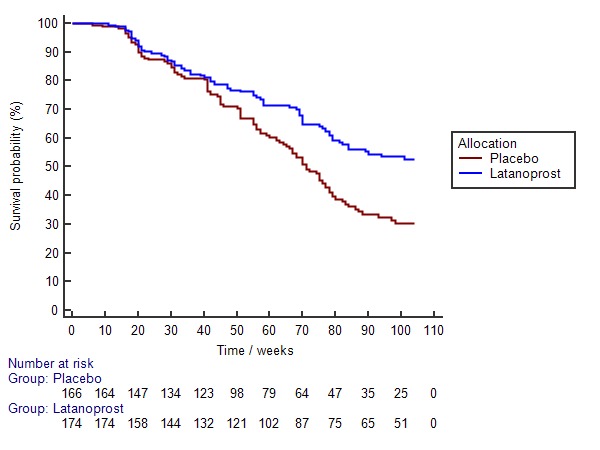
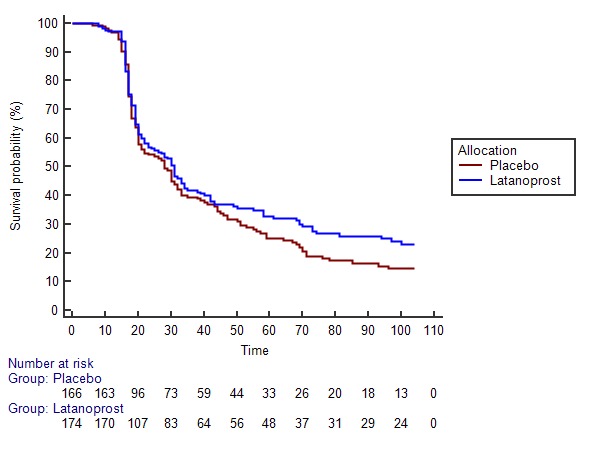
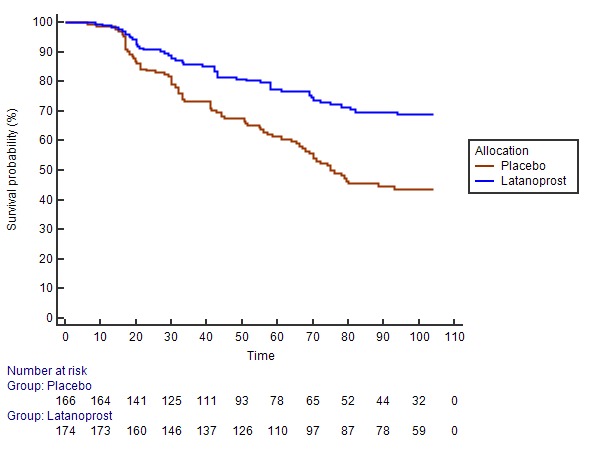
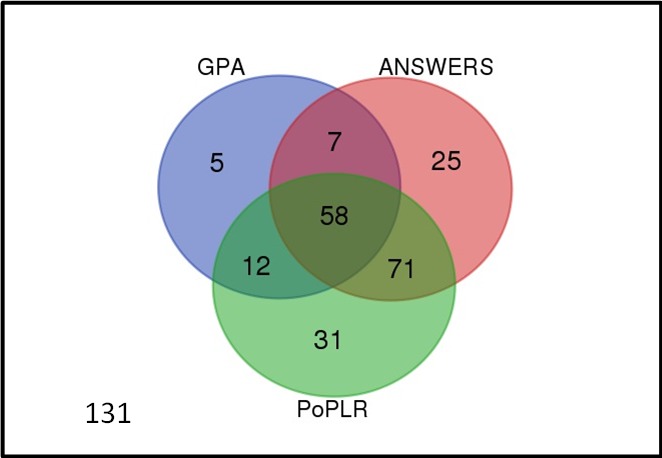
Methods: VFs and retinal nerve fibre layer thickness (RNFLT) measurements (acquired by TD OCT) from 373 glaucoma patients in the UK Glaucoma Treatment Study (UKGTS) at up to 11 scheduled visits over a 2 year interval formed the cohort to assess the sensitivity of progression analysis methods. Specificity was assessed in 78 glaucoma patients with up to 11 repeated VF and OCT RNFLT measurements over a 3 month interval. Growth curve models assessed the difference in VF and RNFLT rate of change between treatment groups. Incident progression was identified by 3 VF-based methods: Guided Progression Analysis (GPA), 'ANSWERS' and 'PoPLR', and one based on VFs and RNFLT: 'sANSWERS'. Sensitivity, specificity and discrimination between treatment groups were evaluated.

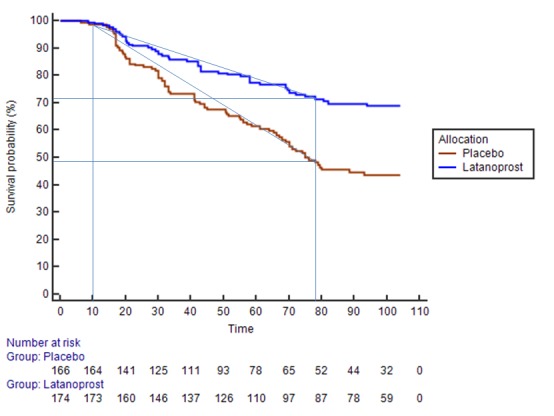
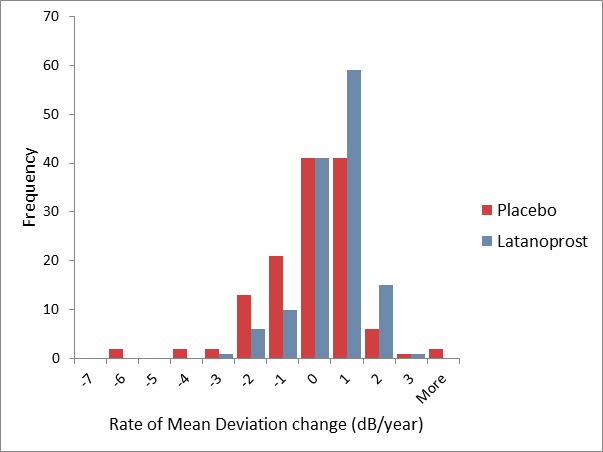
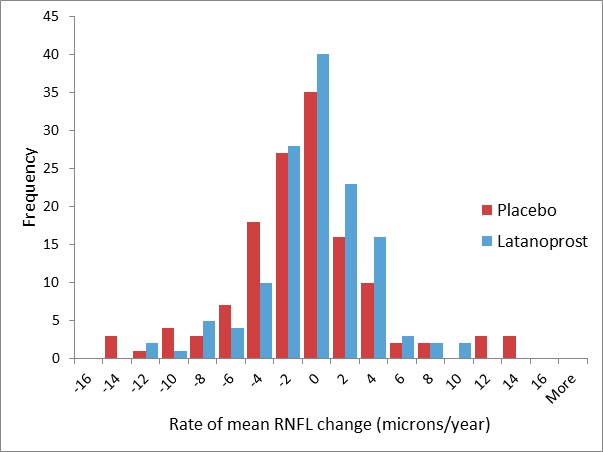
Results: The rate of VF change was significantly faster in the placebo, compared to active treatment, group (-0.29 vs +0.03 dB/year, P<.001); the rate of RNFLT change was not different (-1.7 vs -1.1 dB/year, P=.14). After 18 months and at 95% specificity, the sensitivity of ANSWERS and PoPLR was similar (35%); sANSWERS achieved a sensitivity of 70%. GPA, ANSWERS and PoPLR discriminated treatment groups with similar statistical significance; sANSWERS did not discriminate treatment groups.

Conclusions: Although the VF progression-detection method including VF and RNFLT measurements is more sensitive, it does not improve discrimination between treatment arms.


Figures

APPENDIX FIGURE 1
APPENDIX FIGURE 1
APPENDIX FIGURE 2
APPENDIX FIGURE 2
FIGURE 1
FIGURE 1
Flow chart for subject and test data selection. Each OCT scan is comprised of 3 peripapillary sweeps; for the purpose of this analysis, each sweep is counted as an image.
FIGURE 2
FIGURE 2
Survival curves based on the ‘ANSWERS AND PoPLR’ outcome criterion. The vertical grey lines mark the 10-week (earliest possible progression) and 78-week (18-month) time points. The diagonal grey lines approximate the cumulative proportion of participants with an endpoint between 10 and 78 weeks.
FIGURE 3
FIGURE 3
Distribution of the rates of visual field mean deviation change for the subset of UK Glaucoma Treatment Study participants with OCT images (placebo, 143 participants; latanoprost, 141 participants)
FIGURE 4
FIGURE 4
Distribution of the rates of optical coherence tomography retinal nerve fiber layer thickness change for the subset of UK Glaucoma Treatment Study participants with OCT images (placebo, 143 participants; latanoprost, 141 participants)
FIGURE 5
FIGURE 5
Kaplan-Meier survival curves for the subset of UK Glaucoma Treatment Study participants with OCT images applying the Guided Progression Analysis criterion for progression.
FIGURE 6
FIGURE 6
The ‘hit rate’ is the proportion of UK Glaucoma Treatment Study participants identified as deteriorating at criterion false positive rates between 0 and 15%. Analyses are shown for ANSWERS, PoPLR and sANSWERS models. Data are show for series intervals (baseline to final observation) of up to 7, 13, 18 and 22 months. The shorter series are a subset of the longer series, so that an eye identified as ‘progressed’ earlier in the series is carried forward as ‘progressed’ in the later series. Data are shown for 445 eyes of 353 participants.
FIGURE 7
FIGURE 7
Kaplan-Meier survival curves for the subset of UK Glaucoma Treatment Study participants with OCT images applying the ANSWERS criterion for progression.
FIGURE 8
FIGURE 8
Kaplan-Meier survival curves for the subset of UK Glaucoma Treatment Study participants with OCT images applying the PoPLR criterion for progression.
FIGURE 9
FIGURE 9
Kaplan-Meier survival curves for the subset of UK Glaucoma Treatment Study participants with OCT images applying the structure-guided ANSWERS (sANSWERS) criterion for progression.
FIGURE 10
FIGURE 10
Kaplan-Meier survival curves for the subset of UK Glaucoma Treatment Study participants with OCT images applying the ‘ANSWERS AND PoPLR’ criterion for progression.
FIGURE 11
FIGURE 11
Venn diagram illustrating the agreement for UK Glaucoma Treatment Study participants identified as progressing by Guided Progression Analysis, ANSWERS and PoPLR criteria for progression. The numbers represent the number of participants in each category.
FIGURE 12
FIGURE 12
Illustration of a Weibull probability density function (κ=0.5, λ=1)

References

    1. Weinreb RN, Kaufman PL. The glaucoma research community and FDA look to the future: a report from the NEI/FDA CDER Glaucoma Clinical Trial Design and Endpoints Symposium. Invest Ophthalmol Vis Sci. 2009;50(4):1497–1505. - PubMed
    1. Henson DB, Chaudry S, Artes PH, Faragher EB, Ansons A. Response variability in the visual field: comparison of optic neuritis, glaucoma, ocular hypertension, and normal eyes. Invest Ophthalmol Vis Sci. 2000;41(2):417–421. - PubMed
    1. Artes PH, Iwase A, Ohno Y, Kitazawa Y, Chauhan BC. Properties of perimetric threshold estimates from Full Threshold, SITA Standard, and SITA Fast strategies. Invest Ophthalmol Vis Sci. 2002;43(8):2654–2659. - PubMed
    1. Russell RA, Crabb DP, Malik R, Garway-Heath DF. The relationship between variability and sensitivity in large-scale longitudinal visual field data. Invest Ophthalmol Vis Sci. 2012;53(10):5985–5990. - PubMed
    1. Chauhan BC, Garway-Heath DF, Goni FJ, et al. Practical recommendations for measuring rates of visual field change in glaucoma. Br J Ophthalmol. 2008;92(4):569–573. - PMC - PubMed

Publication types