. 2017 Sep 29:11:88.
doi: 10.3389/fncom.2017.00088. eCollection 2017.

The Effects of GABAergic Polarity Changes on Episodic Neural Network Activity in Developing Neural Systems

Affiliations

The Effects of GABAergic Polarity Changes on Episodic Neural Network Activity in Developing Neural Systems

Wilfredo Blanco et al. Front Comput Neurosci. .

Abstract

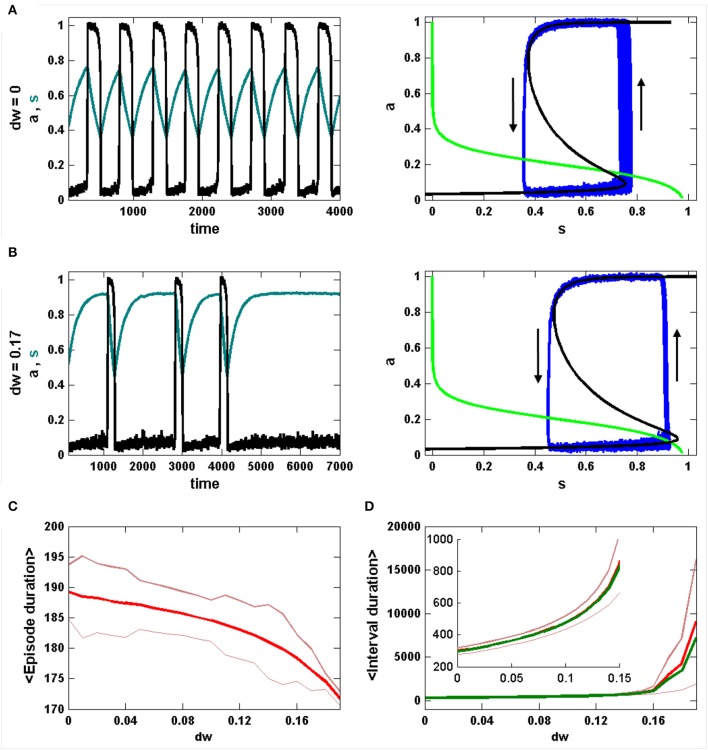
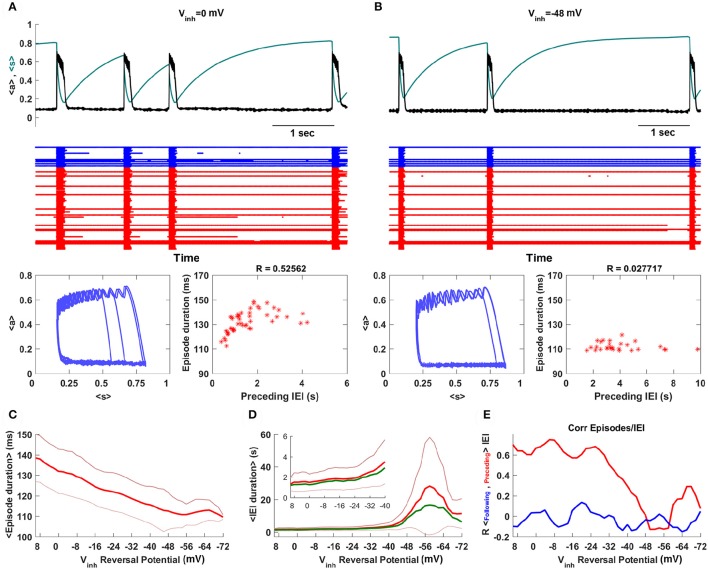
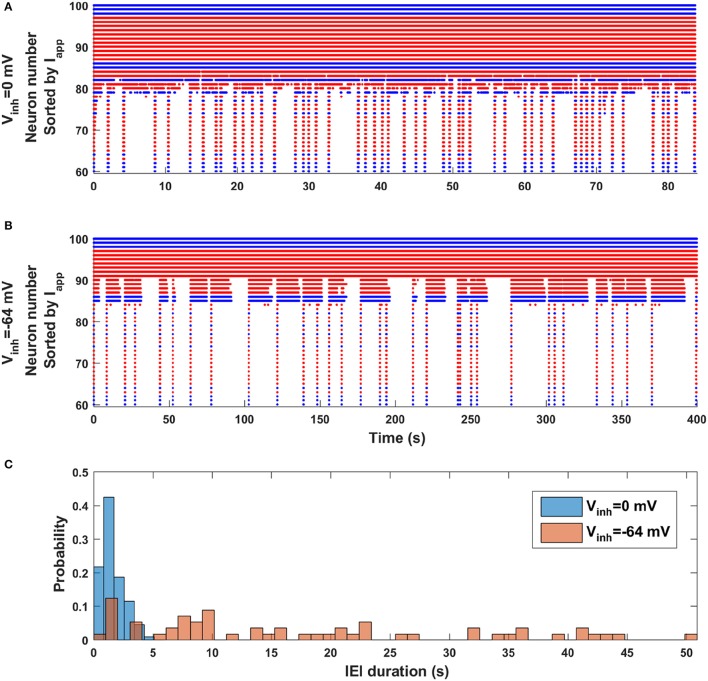
Early in development, neural systems have primarily excitatory coupling, where even GABAergic synapses are excitatory. Many of these systems exhibit spontaneous episodes of activity that have been characterized through both experimental and computational studies. As development progress the neural system goes through many changes, including synaptic remodeling, intrinsic plasticity in the ion channel expression, and a transformation of GABAergic synapses from excitatory to inhibitory. What effect each of these, and other, changes have on the network behavior is hard to know from experimental studies since they all happen in parallel. One advantage of a computational approach is that one has the ability to study developmental changes in isolation. Here, we examine the effects of GABAergic synapse polarity change on the spontaneous activity of both a mean field and a neural network model that has both glutamatergic and GABAergic coupling, representative of a developing neural network. We find some intuitive behavioral changes as the GABAergic neurons go from excitatory to inhibitory, shared by both models, such as a decrease in the duration of episodes. We also find some paradoxical changes in the activity that are only present in the neural network model. In particular, we find that during early development the inter-episode durations become longer on average, while later in development they become shorter. In addressing this unexpected finding, we uncover a priming effect that is particularly important for a small subset of neurons, called the "intermediate neurons." We characterize these neurons and demonstrate why they are crucial to episode initiation, and why the paradoxical behavioral change result from priming of these neurons. The study illustrates how even arguably the simplest of developmental changes that occurs in neural systems can present non-intuitive behaviors. It also makes predictions about neural network behavioral changes that occur during development that may be observable even in actual neural systems where these changes are convoluted with changes in synaptic connectivity and intrinsic neural plasticity.

Keywords: GABAergic neurons; activity episodes; developing neural networks; excitatory-inhibitory balance; heterogeneity.


Figures

Figure 1
Figure 1
A snapshot of spontaneous episodic activity features over a range of inhibitory weight (dw) values in the mean field model. (A) Spontaneous episodic activity (a, black curve) and synaptic efficacy (s, dark green curve) and the trajectory in the phase plane (blue curve, right panel) with dw = 0. The s- and a-nullclines (with no noise, n = 0) are superimposed. The s-nullcline is in green and the a-nullcline is in black. (B) With dw = 0.17 the episodes are shorter, the intervals are longer, and there is less variability in the values of s where an episode begins. (C) The mean episode duration (bold red curve) declines monotonically with dw. Thin red curves are mean ± standard error. (D) Interval durations increase slowly with dw until dw = 0.17, beyond which the increase in interval duration is much more extreme and the mean (thick red curve) and median (thick green curve) begin to diverge. The thin red curves are the mean ± standard error.
Figure 2
Figure 2
Analysis of episode durations and inter-episode interval (IEI) durations generated by the mean field model. (A) Without inhibition (dw = 0) the IEI durations have a unimodal distribution and the episode duration is strongly correlated with the preceding IEI, but not the following IEI. (B) With inhibition (dw = 0.17) the IEI durations have a long tail at higher values and the correlation between episode duration and preceding IEI duration is lost. (C) The IEI duration distributions are shown together for a range of values of dw. The peak of the distribution moves rightward and the distribution spreads out for larger dw. (D) The correlation between episode duration and preceding IEI duration (red) drops sharply beyond dw = 0.14. There is never a correlation between episode duration and the following IEI duration (blue).
Figure 3
Figure 3
Spontaneous episodic activity of the neural network model with 100 neurons, of which 20 are GABAergic, and all-to-all coupling. (A) A snapshot of the episodic activity, showing the population-mean synaptic activity <a> and efficacy <s>. In the raster plot the blue traces correspond to GABAergic neurons, while the red traces correspond to glutamatergic neurons. In this simulation Vinh = 0 mV, corresponding to early development when GABAergic synapses are excitatory. (B) Later in development the GABAergic neurons become inhibitory, as in this case with Vinh = −48 mV. There is much less variation in 〈s〉 at the start of an episode, and no correlation between the durations of episodes and the preceding IEI. (C) The mean episode duration declines as the synaptic reversal potential of GABAergic neurons is changed from excitatory to inhibitory. The thick red curve is the mean and the thin red curves are mean plus/minus standard deviation. (D) As expected, the mean IEI duration increases as the GABAergic synapses are made more inhibitory, but unexpectedly it reaches a maximum and then declines with greater inhibition. In addition to mean and standard deviation, the median (thick green curve) is also plotted. (E) The correlation between episode duration and preceding IEI declines as GABAergic neurons become inhibitory, and there is never a correlation between episode duration and the following IEI duration.
Figure 4
Figure 4
Activity at three values of Vinh. (A) To the left of the IEI duration peak, Vinh = −52 mV, the intermediate neurons mostly continue to fire during intervals and an episode is sometimes initiated when an intermediate neuron fires. As a result, 〈s〉 is flat during the intervals and there is no priming. There is a single large peak in the distribution of 〈s〉 during the intervals. (B) At the peak of the IEI duration distribution, Vinh = −58 mV, some of the intermediate neurons turn off during intervals (**), causing 〈s〉 to rise and priming the system for a new episode. There are now two peaks in the distribution of 〈s〉 during the intervals, corresponding to primed (**) and unprimed (*) states of the network. (C) To the right of the IEI duration peak, Vinh = −64 mV, the priming effect is accentuated. The activity during the IEIs is now lower and as a consequence the primed peak in the 〈s〉 distribution is now dominant.
Figure 5
Figure 5
The intermediate population of neurons drives the episodic activity of the entire population. Neurons are sorted according to the value of Iapp. (A) Most neurons do not fire between episodes, and some fire all the time. However, one or more neurons of the intermediate population (in the gray region) fires before an episode, acting as a trigger. The orange arrows (Vinh = −58 mV) in the raster plot indicate time points in which the intermediate neurons begin to turn off, inducing priming, or turn on, triggering a new episode. The yellow arrows have a similar interpretation, but with Vinh = −64 mV. (B) Bifurcation diagram for a single uncoupled neuron shows that the intermediate neurons (gray region) have Iapp values near the start of the tonic spiking branch. The diagram shows the stationary branch (black) and periodic branch (red), with stable portions indicated by a solid curve and unstable portions by a dashed curve. SNP, saddle node of periodics bifurcation; subHB, subcritical Hopf bifurcation. (C,D) Blowup raster plots highlighting the activity of the intermediate neurons. Episodes are indicated by orange and yellow bands. (E) Time courses of the efficacy variables, s, for neurons 87 (dashed green) and 90 (dashed red), along with the mean efficacy, <s> (solid green), and the mean activity, <a> (black), with Vinh = −64 mV. In the s traces, plus signs correspond to a spiking neuron.
Figure 6
Figure 6
Change in episode regularity as GABAergic synapses switch from excitatory to inhibitory in the neural network model. (A) The activity raster plot for the case of excitatory GABAergic synapses (Vinh = 0 mV) shows many short IEIs with a few longer IEI. (B) The raster plot for inhibitory GABAergic synapses (Vinh = −64 mV) displays a wide range of IEI durations, with little pattern. (C) Histograms of IEI durations for excitatory (blue) and inhibitory (orange) GABAergic synapses indicate a great deal of regularity in the occurrence of episodes when the synapses are excitatory, but little or no regularity when the synapses are inhibitory.

References

    1. Ben-Ari Y. (2002). Excitatory actions of gaba during development: the nature of the nurture. Nat. Rev. Neurosci. 3, 728–739. 10.1038/nrn920 - DOI - PubMed
    1. Ben-Ari Y. J., Gaiarsa L., Tyzio R., Khazipov R. (2007). GABA: a pioneer transmitter that excites immature neurons and generates primitive oscillations. Physiol. Rev. 87, 1215–1284. 10.1152/physrev.00017.2006 - DOI - PubMed
    1. Bertram R. (2015). Mathematical Modeling in Neuroendocrinology. Comp. Physiol. 5, 911–927. 10.1002/cphy.c140034 - DOI - PubMed
    1. Bregestovski P., Bernard C. (2012). Excitatory GABA: how a correct observation may turn out to be an experimental artifact. Front. Pharmacol. 3:65. 10.3389/fphar.2012.00065 - DOI - PMC - PubMed
    1. Fletcher P., Bertram R., Tabak J. (2016). From global to local: exploring the relationship between parameters and behaviors in models of electrical excitability. J. Comput. Neurosci. 40, 331–345. 10.1007/s10827-016-0600-1 - DOI - PubMed