. 2017 Oct 16;4(5):ENEURO.0195-17.2017.
doi: 10.1523/ENEURO.0195-17.2017. eCollection 2017 Sep-Oct.

Quantifying Mesoscale Neuroanatomy Using X-Ray Microtomography

Affiliations

Quantifying Mesoscale Neuroanatomy Using X-Ray Microtomography

Eva L Dyer et al. eNeuro. .

Abstract

Methods for resolving the three-dimensional (3D) microstructure of the brain typically start by thinly slicing and staining the brain, followed by imaging numerous individual sections with visible light photons or electrons. In contrast, X-rays can be used to image thick samples, providing a rapid approach for producing large 3D brain maps without sectioning. Here we demonstrate the use of synchrotron X-ray microtomography (µCT) for producing mesoscale (∼1 µm 3 resolution) brain maps from millimeter-scale volumes of mouse brain. We introduce a pipeline for µCT-based brain mapping that develops and integrates methods for sample preparation, imaging, and automated segmentation of cells, blood vessels, and myelinated axons, in addition to statistical analyses of these brain structures. Our results demonstrate that X-ray tomography achieves rapid quantification of large brain volumes, complementing other brain mapping and connectomics efforts.

Keywords: Automated segmentation; X-ray microtomography; cell counting; electron microscopy; neocortex; neuroanatomy.


Conflict of interest statement

Authors report no conflict of interest.

Figures
None
Graphical abstract
Fig. 1.
Fig. 1.
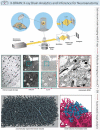
Synchrotron X-ray tomography of a millimeter-scale brain sample. A schematic illustration of the imaging setup is displayed along the bottom: from left to right, the synchrotron X-ray source interacting with an embedded sample of somatosensory cortex as it is rotated during the collection of multi-angle projections. To collect this projection data, X-rays are passed through a scintillator crystal that converts the energy into visible light photons. These photons are then focused onto a light camera sensor, before a sinogram is generated via data collection from a row of sensor pixels. In the three panels above, visualizations of the neocortical sample preparation (a), location of the mounted sample within the instrument (b), and conversion and focusing of X-rays into light photons (c).
Fig. 2.
Fig. 2.
Synchrotron X-ray imaging provides micron resolution within a neocortical volume. a, Microscopic visualization of cells, blood vessels, and dendrites within an X-ray–imaged volume of somatosensory cortex. Each panel shows one of three perspectives within the xyz coordinate framework (panels to the right are 11.5 µm wide, large panel to the left is 100 µm wide). b, Digital rendering of a manually reconstructed subset of blood vessels and cell bodies (nuclei highlighted) selected from within the neocortical volume. c, Photomicrographs of a subvolume within this sample, using µCT and EM to identify overlapping regions. These images were collected at three different pixel sizes (0.65 µm, 100 nm, 3 nm). In the left panel, a subset of a single virtual slice from an X-ray tomogram that spans the neocortical volume (0.65 µm pixel size). Outlined in blue to the right of this is a subset of the volume (within a) that highlights a configuration of three cell bodies and distinct proximal microvessels. This sample was subsequently serially sectioned and imaged in a scanning electron microscope. These cells are located in the EM dataset (inset), the ultrastructure of which is well preserved, even after µCT (right in red).
Fig. 3.
Fig. 3.
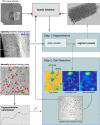
Image processing and computer vision pipeline for segmentation and cell detection. Block diagram displaying the entire X-BRAIN workflow is described. The integration of sparsely labeled training data into our segmentation module (Step 1) is used to train a random forest classifier using ilastik. Densely annotated training data are used to perform hyperparameter optimization to tune our cell detection algorithm in Step 2. The final map of detected cells is displayed at the bottom of Step 2, with detected cells overlaid on the original X-ray image. Solid arrows, inputs into a module; dashed arrows, outputs; filled circle terminal, outputs that are stored in the spatial database.
Fig. 4.
Fig. 4.
Visualization of X-ray image data, overlaid probability maps, and final segmentations. On the left, an X-ray micrograph. On the right, clockwise from upper left: vessel probabilities, cell probabilities, cell probabilities and segmentations, and the segmentations of cells and vessels.
Fig. 5.
Fig. 5.
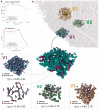
Automated methods for segmentation and cell detection reveal dense mesoscale brain maps. a, Performance of vessel segmentation and cell detection methods, as hyperparameters that affect the performance of the method, are varied. To optimize performance of the vessel segmentation method, the f2 score is computed—emphasizing recall—for multiple operating points (each curve represents a fixed parameter set with a varying vessel segmentation threshold). To measure performance for cell detection, the f1 score—balancing precision and recall—is calculated for multiple operating points as the stopping criterion is increased (x axis) in the greedy cell finder algorithm. Highlighted curves within each plot and the accompanying “star” indicate optimal hyperparameter performance. b, Results of cell detection and vessel segmentation algorithms on manually annotated test datasets. The training volumes V1 (195 × 195 × 65 µm and V2 (130 × 130 × 65 µm) and test volume V3 (130 × 130 × 130 µm) are visualized within the entire volume of X-ray–imaged tissue. c, Training volumes V1 and V2 and test volume V3 individually visualized. In each manually annotated subvolume, the results of X-BRAIN are overlaid, based on the best operating point selected by the parameter optimization approach in a. The precision (p) and recall (r) values for each subvolume are further annotated.
Fig. 6.
Fig. 6.
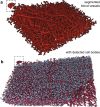
Visualization of 3D reconstructions of the neural architecture within a millimeter-scale neocortical sample. a, Renderings of the vessel segmentation algorithm output across the depth of the entire analyzed sample. b, Visual perspective of the cell detection algorithm output integrated with renderings from vasculature displayed in a, with hatched inset showing the same subset of both neurons and vessels.
Fig. 7.
Fig. 7.
Spatial statistics of X-ray volumes reveal layering and spatially diverse distribution of cell bodies. Top right, histograms of the estimates of the cell density over the extent of the entire sample of mouse cortex, distances between the center of each cell and its nearest neighbor (cell-to-cell distances), and distances between the center of each cell and the closest vessel voxel (cell-to-vessel distances). Top left, 3D rendering of the detected cells and vessels in the entire sample, with a manually labeled cube (V1) highlighted in blue. To confirm the 3D structure of this visualization (bottom left), confirmation is provided in the maps provided to the right: cell probability (red indicating high probability), detected cells (each detected cell displayed in a different color), and density estimates (bright yellow indicating high density). These results provide further confirmation that the 3D structure of the sample is preserved within our density estimate.
Fig. 8.
Fig. 8.
Axonal reconstructions obtained through manual and automated methods yields high agreement. Segmented outputs are overlaid onto X-ray neocortical images (xy, xz, yz planes in the upper panels) and reconstructed in the lower panels for the proposed automated segmentation method (a) and manual annotations (b).

References

    1. Arillo A, Peñalver E, Pérez-De La Fuente R, Delclòs X, Criscione J, Barden PM, Riccio ML, Grimaldi DA (2015) Long-proboscid brachyceran flies in Cretaceous amber (Diptera: Stratiomyomorpha: Zhangsolvidae). Syst Entomol 40:242–267. 10.1111/syen.12106 - DOI
    1. Bleckert AA, Brittain D, Borseth J, Bumbarger, Perkins DJ, Williams D, Takeno M, Reid D, Castelli D, Sullivan D, Keenan T, Reid C, Da Costa NDa (2016) Linking functional and anatomical circuit connectivity using fast parallelized TEM imaging. Abstract Number: 186.04. Society for Neuroscience Annual Meeting (SFN).
    1. Briggman KL, Bock DD (2012) Volume electron microscopy for neuronal circuit reconstruction. Curr Opin Neurobiol 22:154–161. 10.1016/j.conb.2011.10.022 - DOI - PubMed
    1. Burns, R, Lillaney, K, Berger, DR, Grosenick, L, Deisseroth, K, Reid, RC, Roncal, WG, Manavalan, P, Bock, DD, Kasthuri, N, et al. (2013). The Open Connectome Project data cluster: scalable analysis and vision for high-throughput neuroscience. In Proc. of the 25th International Conference on Scientific and Statistical Database Management, 27 ACM. - PMC - PubMed
    1. Bushong EA, Johnson DD, Kim K-Y, Terada M, Hatori M, Peltier ST, Panda S, Merkle A, Ellisman MH (2015) X-ray microscopy as an approach to increasing accuracy and efficiency of serial block-face imaging for correlated light and electron microscopy of biological specimens. Microsc Microanal 21:231–238. 10.1017/S1431927614013579 - DOI - PMC - PubMed

Publication types

LinkOut - more resources