. 2017 Aug 14;9(1):45.
doi: 10.1186/s13321-017-0232-0.

Beyond the hype: deep neural networks outperform established methods using a ChEMBL bioactivity benchmark set

Affiliations

Beyond the hype: deep neural networks outperform established methods using a ChEMBL bioactivity benchmark set

Eelke B Lenselink et al. J Cheminform. .

Abstract

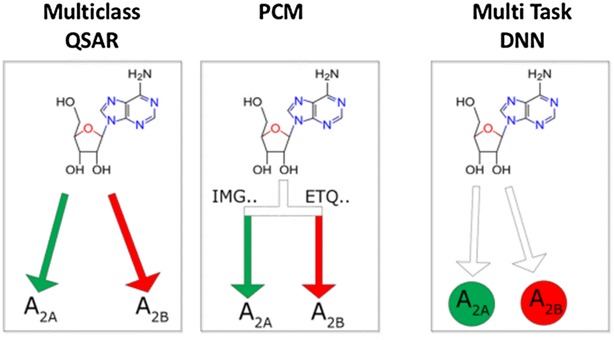
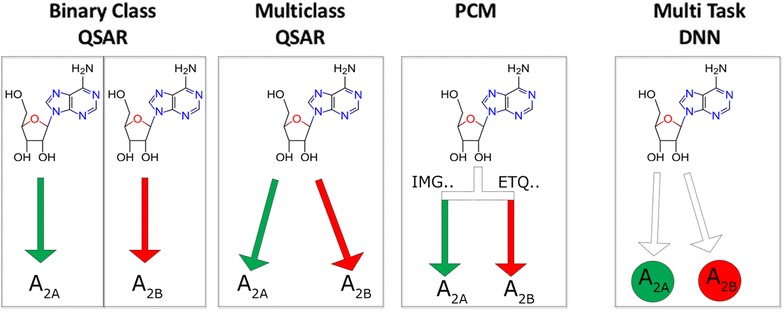
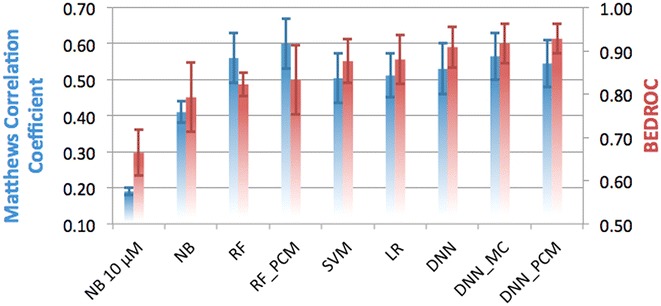
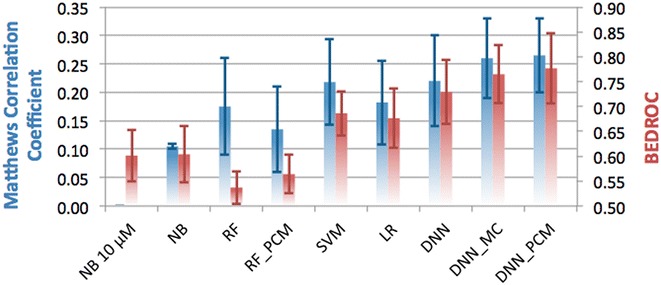
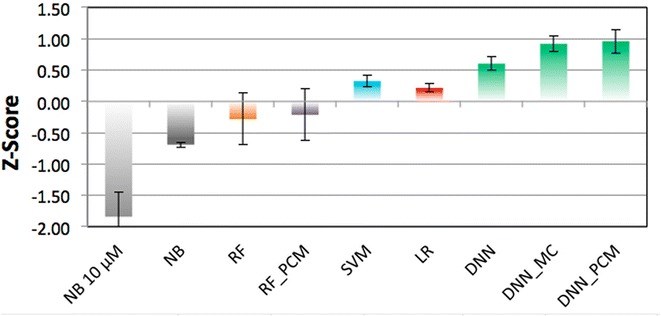
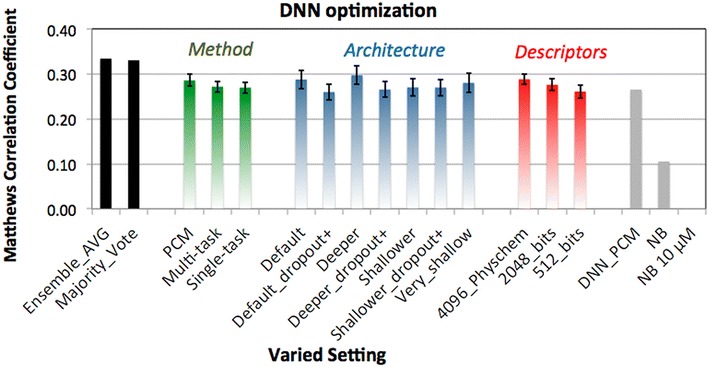
The increase of publicly available bioactivity data in recent years has fueled and catalyzed research in chemogenomics, data mining, and modeling approaches. As a direct result, over the past few years a multitude of different methods have been reported and evaluated, such as target fishing, nearest neighbor similarity-based methods, and Quantitative Structure Activity Relationship (QSAR)-based protocols. However, such studies are typically conducted on different datasets, using different validation strategies, and different metrics. In this study, different methods were compared using one single standardized dataset obtained from ChEMBL, which is made available to the public, using standardized metrics (BEDROC and Matthews Correlation Coefficient). Specifically, the performance of Naïve Bayes, Random Forests, Support Vector Machines, Logistic Regression, and Deep Neural Networks was assessed using QSAR and proteochemometric (PCM) methods. All methods were validated using both a random split validation and a temporal validation, with the latter being a more realistic benchmark of expected prospective execution. Deep Neural Networks are the top performing classifiers, highlighting the added value of Deep Neural Networks over other more conventional methods. Moreover, the best method ('DNN_PCM') performed significantly better at almost one standard deviation higher than the mean performance. Furthermore, Multi-task and PCM implementations were shown to improve performance over single task Deep Neural Networks. Conversely, target prediction performed almost two standard deviations under the mean performance. Random Forests, Support Vector Machines, and Logistic Regression performed around mean performance. Finally, using an ensemble of DNNs, alongside additional tuning, enhanced the relative performance by another 27% (compared with unoptimized 'DNN_PCM'). Here, a standardized set to test and evaluate different machine learning algorithms in the context of multi-task learning is offered by providing the data and the protocols. Graphical Abstract .

Keywords: ChEMBL; Cheminformatics; Chemogenomics; Deep neural networks; Proteochemometrics; QSAR.


Figures

Graphical Abstract
Graphical Abstract
.
Fig. 1
Fig. 1
Differences between methods for modeling bioactivity data exemplified by the ligand adenosine which is more active (designated as ‘active’) on the adenosine A2A receptor, than on the A2B receptor (‘inactive’, using PChEMBL > 6.5 as a cutoff). With binary class QSAR, individual models are constructed for every target. With multiclass QSAR one model is constructed based on the different target labels (A2A_active, A2B_inactive). With PCM one model is constructed where the differences between proteins are considered in the descriptors (i.e. based on the amino acid sequence). With multiclass DNN a single output node is explicitly assigned to each target
Fig. 2
Fig. 2
Performance of the different methods in the random split validation, grouped by underlying algorithm and colored by metric used. On the left y-axis, and in blue the MCC is shown, while on the right y-axis and in red the BEDROC (α = 20) score is shown. Default, single class algorithms are shown, and for several algorithms the performance of PCM and multi-class implementations is shown. Error bars indicate SEM. Mean MCC is 0.49 (±0.04) and mean BEDROC is 0.85 (±0.03)
Fig. 3
Fig. 3
Performance of the different methods in the temporal split validation, grouped by underlying algorithm and colored by metric used. On the left y-axis, and in blue the MCC is shown, while on the right y-axis and in red the BEDROC (α = 20) score is shown. Default, single class algorithms are shown, and for several algorithms the performance of PCM and multi-class implementations is shown. Error bars indicate SEM. Mean MCC is 0.17 (±0.03) and mean BEDROC is 0.66 (±0.03)
Fig. 4
Fig. 4
Comparison of the mean z-scores obtained by the different methods. Bars are colored by method and error bars indicate SEM, best performance is by the DNN (0.96 ± 0.19, 0.92 ± 0.13, and 0.60 ± 0.11 respectively), followed by SVM (0.32 ± 0.09), LR (0.22 ± 0.06), RF (−0.21 ± 0.41 and −0.28 ± 0.41), and finally NB (−0.69 ± 0.04 and −1.84 ± 0.40)
Fig. 5
Fig. 5
Average performance of the individual DNN grouped per method, architecture and descriptors. Average value is shown for all models trained sharing a setting indicated on the x-axis, error bars represent the SEM of that average. Black bars on the left represent the ensemble methods (average value and majority vote). Grey bars on the right indicate the previous best performing DNN (DNN_PCM), NB with activity cut-off at 6.5 log units and z-score calculation, and default NB with activity cut-off at 10 μM. We observed PCM to be the best way to model the data (green bars), architecture 3 to be the best performing (blue bars), and usage of 4096 bit descriptors with additional physicochemical property descriptors to perform the best (red bars). Using ensemble methods further improves performance (black bars)

References

    1. Protein Data Bank (2017) Yearly growth of total structures 2017 [July 7th 2017]. http://www.rcsb.org/pdb/statistics/contentGrowthChart.do?content=total
    1. Hu Y, Bajorath J. Growth of ligand–target interaction data in ChEMBL is associated with increasing and activity measurement-dependent compound promiscuity. J Chem Inf Model. 2012;52(10):2550–2558. doi: 10.1021/ci3003304. - DOI - PubMed
    1. Jasial S, Hu Y, Bajorath J. Assessing the growth of bioactive compounds and scaffolds over time: implications for lead discovery and scaffold hopping. J Chem Inf Model. 2016;56(2):300–307. doi: 10.1021/acs.jcim.5b00713. - DOI - PubMed
    1. Gaulton A, Bellis LJ, Bento AP, Chambers J, Davies M, Hersey A, et al. ChEMBL: a large-scale bioactivity database for drug discovery. Nucleic Acids Res. 2012;40:D1100–D1107. doi: 10.1093/nar/gkr777. - DOI - PMC - PubMed
    1. Bento AP, Gaulton A, Hersey A, Bellis LJ, Chambers J, Davies M, et al. The ChEMBL bioactivity database: an update. Nucleic Acids Res. 2014;42:D1083–D1090. doi: 10.1093/nar/gkt1031. - DOI - PMC - PubMed

LinkOut - more resources