. 2018 Feb;28(2):221-248.
doi: 10.1038/cr.2017.135. Epub 2017 Oct 31.

Endothelial cell-derived GABA signaling modulates neuronal migration and postnatal behavior

Affiliations

Endothelial cell-derived GABA signaling modulates neuronal migration and postnatal behavior

Suyan Li et al. Cell Res. 2018 Feb.

Abstract

The cerebral cortex is essential for integration and processing of information that is required for most behaviors. The exquisitely precise laminar organization of the cerebral cortex arises during embryonic development when neurons migrate successively from ventricular zones to coalesce into specific cortical layers. While radial glia act as guide rails for projection neuron migration, pre-formed vascular networks provide support and guidance cues for GABAergic interneuron migration. This study provides novel conceptual and mechanistic insights into this paradigm of vascular-neuronal interactions, revealing new mechanisms of GABA and its receptor-mediated signaling via embryonic forebrain endothelial cells. With the use of two new endothelial cell specific conditional mouse models of the GABA pathway (Gabrb3ΔTie2-Cre and VgatΔTie2-Cre), we show that partial or complete loss of GABA release from endothelial cells during embryogenesis results in vascular defects and impairs long-distance migration and positioning of cortical interneurons. The downstream effects of perturbed endothelial cell-derived GABA signaling are critical, leading to lasting changes to cortical circuits and persistent behavioral deficits. Furthermore, we illustrate new mechanisms of activation of GABA signaling in forebrain endothelial cells that promotes their migration, angiogenesis and acquisition of blood-brain barrier properties. Our findings uncover and elucidate a novel endothelial GABA signaling pathway in the CNS that is distinct from the classical neuronal GABA signaling pathway and shed new light on the etiology and pathophysiology of neuropsychiatric diseases, such as autism spectrum disorders, epilepsy, anxiety, depression and schizophrenia.


Figures

Figure 1
Figure 1
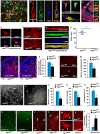
Endothelial Gabrb3 regulates telencephalic development. (A) GABA expression (red) in E11 Tie2-GFP dorsal telencephalon with specific labeling in Tie2-GFP+ endothelial cells (co-label in yellow). White arrows illustrate high magnifications (20×) of endothelial cells showing individual and merged images of GFP and GABA. (B) A high-magnification image of GABA labeling of endothelial cells in a periventricular vessel from E12 neocortex obtained by DAB immunohistochemistry (60×). (C) Individual isolectin 4, GABA, DAPI and merged image of a periventricular endothelial cell (pv ec, 60×). (D) Co-labeled image of isolectin 4, GABRB3 and DAPI labeling of pv ecs (40×). (E) In vivo expression of GABRB3 in periventricular endothelial cells of Tie2-GFP telencephalon at E13. White arrow illustrates the region of high-magnification images (20×), which show GFP-positive endothelial cells lining a vessel, co-labeled with GABRB3. (F) Individual Isolectin 4, GABRB3, DAPI and merged image of a Gabrb3fl/fl pv ec (60×). (G) No GABRB3 expression in pv ecs was detected in Gabrb3ECKO embryos (60×). (H-J) Fewer isolectin B4+ vessels in E13 Gabrb3ECKO telencephalon (yellow asterisk, I) compared to Gabrb3fl/fl telencephalon (white asterisk, H). (J) Morphometric analysis of isolectin B4 labeling revealed significant reduction in vessel densities in E13 Gabrb3ECKO telencephalon; Data represent mean ± SD (n = 8, *P < 0.05, Student's t-test). (K) While the tube-like plexus of periventricular vessels, labeled by isolectin B4, in the ganglionic eminence and dorsal telencephalon was continuous and well formed in Gabrb3fl/fl telencephalon, (white arrows), it was discontinuous and irregular (yellow arrows) in Gabrb3ECKO telencephalon. (L, M) GAD65/67 immunoreactivity showed decreased stream of GABA neurons in E15 Gabrb3ECKO telencephalon (yellow asterisk, M) when compared to Gabrb3fl/fl telencephalon (white asterisk, L). (N) High-magnification image (40×) revealing fewer GAD65/67 cells in Gabrb3ECKO dorsal telencephalon versus Gabrb3fl/fl telencephalon. (O-T) H&E stainings revealed no marked changes in cortical lamination in E18 Gabrb3ECKO dorso-lateral telencephalon (P) in comparison with Gabrb3fl/fl telencephalon (O). However, morphological abnormalities were observed in medial Gabrb3ECKO telencephalon (red asterisk, P). Striatal compartments were enlarged in Gabrb3ECKO telencephalon (yellow asterisk, P). The corpus callosum (blue arrow), hippocampus oriens layer (orange arrow), triangular septal nucleus (black arrow) and ventral hippocampal commissure (brown arrow) were normally formed in Gabrb3fl/fl telencephalon (Q) but perturbed in Gabrb3ECKO telencephalon (R). The two limbs of the anterior commissure (ac) crossed at the midline in both Gabrb3fl/fl and Gabrb3ECKO embryos (Q, R). Ventricular defects (blue asterisk, S) and reduced hippocampus (red arrow, S) were observed in E18 Gabrb3ECKO telencephalon in comparison to Gabrb3fl/fl telencephalon (blue arrow, S). (T) High-magnification images of hippocampus from S. (U, V) Fewer isolectin B4+ vessels in E18 Gabrb3ECKO pallium (yellow asterisks, V) compared with Gabrb3fl/fl pallium (white asterisks, U). (W) Significant reduction in cortical vessel densities in E18 Gabrb3ECKO embryos; Data represent mean ± SD (n = 8, *P < 0.05, Student's t-test). (X) Gabrb3ECKO mice at P0 were smaller in size than Gabrb3fl/fl mice. (Y) Weight chart of Gabrb3ECKO mice compared to Gabrb3fl/fl mice from P1 to P30; Data represent mean ± SD (n = 12, *P < 0.05, Student's t-test). Scale bars: A, 60 μm (applies to N); B, 30 μm (applies to D); C, 15 μm; (applies to F, G), E, 100 μm; (applies to H, I, K-M, O-S, U, V); T, 40 μm, high-magnification insets in A and E, 30 μm.
Figure 2
Figure 2
Vascular and GABA cell deficits in Gabrb3ECKO adult brain and concurrent behavioral deficits. (A, B) Isolectin B4-labeled vessels were significantly reduced in cingulate, motor, somatosensory and piriform cortex of Gabrb3ECKO mice at P90 when compared to Gabrb3fl/fl mice (at 1.5, 0.5 and −1.5 bregma levels). Somatosensory cortex was depicted in A. Vessel quantification was depicted in B; Data represent mean ± SD (n = 8, *P < 0.05; Student's t-test). (C, D) A reduction in GABA+ cells was observed in Gabrb3ECKO cingulate, motor and somatosensory cortex at all bregma levels analyzed. In the Gabrb3ECKO piriform cortex, significant reduction of GABA+ cells was observed only in the −1.5 bregma level; Data represent mean ± SD (n = 8, *P < 0.05, Student's t-test). (E) Similar reduction in density of CD31+ microvessels was observed in the Gabrb3ECKO cingulate cortex; Data represent mean ± SD (*P < 0.05; Student's t-test). (F) Vessel diameters were significantly increased in Gabrb3ECKO cingulate cortex; Data represent mean ± SD (*P < 0.05, Student's t-test). (G) The average lectin+ area per perfused vessel was also increased in Gabrb3ECKO cortex when compared to Gabrb3fl/fl cortex; Data represent mean ± SD (*P < 0.05, Student's t-test). (H) GABA immunohistochemistry showed a reduction in GABAergic neurons in Gabrb3ECKO hippocampus (white arrows) when compared to Gabrb3fl/fl hippocampus. (I-K) To test for home cage social behavior, Gabrb3ECKO and Gabrb3fl/fl mice were housed individually in cages containing wood chip bedding and two nestlets (upper panels, I) or shredded paper (lower panels, I). After 1 h (with nestlet) and 24 h (with shredded paper), untorn nestlet and constitution of built nest were assessed, according to a five-point scale. Gabrb3ECKO mice failed to build proper nests like Gabrb3fl/fl mice as quantified by untorn nestlet or scattered paper (red asterisks, I) and nest building score (J, K); Data represent mean ± SD (n = 15, *P < 0.05, Student's t-test). (L) Gabrb3ECKO mice showed moderate to extensive grooming when compared to Gabrb3fl/fl mice; Data represent mean ± SD (n = 14, *P < 0.05, Student's t-test). (M) In a light-dark box test, the movement trace showed that Gabrb3ECKO mice moved far less in the light side when compared to Gabrb3fl/fl mice. (N) Quantification of exploration time showed that Gabrb3ECKO mice spent less time in the light side and more time in the dark side of the box when compared to Gabrb3fl/fl mice; Data represent mean ± SD (n = 15, *P < 0.05, Student's t-test). (O) Gabrb3ECKO mice made fewer transitions into the light side when compared to Gabrb3fl/fl mice; Data represent mean ± SD (n = 15, *P < 0.05, Student's t-test). (P) Gabrb3ECKO mice showed longer periods of immobility in a tail suspension test; Data represent mean ± SD (n = 12, *P < 0.05, Student's t-test). (Q) Gabrb3ECKO mice had fewer wins in a tube dominance test when compared to Gabrb3fl/fl mice; Data represent mean ± SD (n = 16, *P < 0.05, Student's t-test). (R) In a social interaction test Gabrb3ECKO mice showed no significant difference in time spent between stranger mouse and object unlike floxed littermates; Data represent mean ± SD (n = 12, *P < 0.05, Student's t-test). (S) In the social novelty phase, while Gabrb3fl/fl mice showed a significant preference for novel stranger 2 over the now familiar stranger 1, Gabrb3ECKO mice showed no obvious preference; Data represent mean ± SD (n = 12, *P < 0.05; Student's t-test). (T) No olfaction defects in Gabrb3ECKO mice as seen in a buried food test; Data represent mean ± SD (n = 14). Scale bars: A, 100 μm; (applies to C, H).
Figure 3
Figure 3
Mechanisms underlying endothelial Gabrb3's actions. (A) Co-labeled image of isolectin B4, KCC2/NKCC1 and DAPI in periventricular endothelial cells. (B) The endothelial GABAA receptor on periventricular endothelial cells is functional. Focal application of muscimol (30 μM) evoked an inward current consistently in whole-cell voltage-clamp recording of periventricular endothelial cells held at −70 mV (92.5 ± 16.3 pA, n = 8). (C) Traces showed an inward current of 100 pA induced by muscimol (30 μM) that was blocked by BMI (10 μM). (D) Muscimol application (30 μM) produced no current response in Gabrb3ECKO periventricular endothelial cells. (E, F) Traces showed inward currents of 100 pA induced by muscimol (30 μM) and blocked by BMI (10 μM) in Gabrb3fl/fl (E) and Gabrb3ECKO (F) cortical neuronal cells. (G, H) Increase of intracellular calcium upon muscimol treatment (30 μM) was significantly retarded in Gabrb3ECKO periventricular endothelial cells (H) when compared to the control. (I) Calcium imaging data were quantified by normalizing the values after muscimol application to that before muscimol application; Data represent mean ± SD (n = 7, *P < 0.05, Student's t-test). (J-L) With or without muscimol application, Gabrb3fl/fl and Gabrb3ECKO periventricular endothelial cells were exposed to BrdU (1 mM BrdU per ml medium) for 1 h followed by Isolectin B4/BrdU double labeling. Muscimol application significantly increased cell proliferation in Gabrb3fl/fl periventricular endothelial cells, but Gabrb3ECKO periventricular endothelial cells showed no change. BrdU-labeling indices were quantified in L; Data represent mean ± SD (n = 7, *P < 0.05; Student's t-test; 'M': muscimol). (M) Co-labeling with isolectin B4 and GABA antibodies showed that GABA expression was significantly downregulated in Gabrb3ECKO periventricular endothelial cells when compared to Gabrb3fl/fl endothelial cells. (N) As a result, GABA secretion from E15 Gabrb3ECKO periventricular endothelial cells measured by ELISA was significantly decreased when compared to Gabrb3fl/fl endothelial cells; Data represent mean ± SD (n = 6, *P < 0.05, Student's t-test). (O) A diagrammatic illustration of how endothelial cell-secreted GABA influences critical events during brain development. Wild-type embryonic telencephalon with normal periventricular vascular network (red lattice pattern) and normal endothelial GABA signaling pathway (orange yellow hue) promotes tangential GABAergic neuronal migration (green circles) from the ventral telencephalon where they originate (big green circle). In Gabrb3ECKO telencephalon, there is a partial loss of endothelial GABA secretion (light yellowish hue). This affects periventricular angiogenesis (dotted red pattern) and GABAergic neuronal tangential migration with reduction in GABAergic neurons in the developing neocortex. Scale bars: A, 15 μm; G, 100 μm; (applies to H), J, 50 μm; (applies to K, M).
Figure 4
Figure 4
Abolishing endothelial GABA release and its effect on telencephalic angiogenesis (A) A low-magnification co-labeled image of Isolectin B4, VGAT and DAPI labeling of periventricular endothelial cells (pv ecs). (B) High-magnification image of Isolectin B4, VGAT and DAPI labeling of a pv ec (60×). (C) Different morphologies of Isolectin B4 (IB4) and Tie2-GFP-labeled ecs expressing VGAT (60×). (D) Low- and high-magnification images showing specifically in vivo expression of VGAT in endothelial cells of E13 Tie 2-GFP telencephalon. White arrows point to cells that were magnified. (E) No VGAT expression was detected in VgatECKO pv ecs (60×). (F, G) Low- and high-magnification images showing that expression of GABA (F) and GAD65/67 (G) was not affected in VgatECKO pv ecs. (H) Successful elimination of GABA secretion from embryonic VgatECKO pv ecs measured by ELISA; Data represent mean ± SD (n = 6, *P < 0.05, Student's t-test). (I-K) Isolectin B4 labeling revealed a significant reduction in vessels in E13 VgatECKO telencephalon (yellow asterisk, J) when compared to Vgatfl/fl telencephalon (I). (K) Quantification of vessel densities; Data represent mean ± SD (n = 6, *P < 0.05, Student's t-test). (L) The migratory behavior of Qdot-labeled VgatECKO pv ecs was decreased (yellow asterisk) compared to Vgatfl/fl pv ecs. Representative images from the transwell migration assay are shown. (M) Quantification of the number of migrated cells per field from each group (n = 8, *P < 0.05, mean ± SD. Student's t-test). (N) Vgatfl/fl pv ecs showed robust tube formation in an angiogenesis assay on matrigel (white arrows) reflecting their high angiogenic potential. (O) VgatECKO pv ecs failed to form robust tubes (yellow arrows), signifying impaired angiogenesis. (P-R) Quantification of number of junctions and tubules analyzed by Wimasis and quantification of the angiogenesis score; Data represent mean ± SD (n = 10, *P < 0.05, Student's t-test). (S, T) Claudin 5 expression was decreased in E16 VgatECKO dorsal telencephalon (T) when compared to Vgatfl/fl (S) telencephalon, illustrating loss of tight junctions (n = 10). (U, V) Images of IgG staining from E17 Vgatfl/fl and VgatECKO dorsal telencephalon. While IgG was localized to Vgatfl/fl vessels (white arrows, U), IgG leakage was observed from VgatECKO vessels in dorsal and medial telencephalon (yellow arrows, V). (W) High-magnification images of IgG leakage (yellow arrows) from VgatECKO vessels in the dorsal telencephalon. (X, Y) E18 VgatECKO and littermate controls were given a trans-cardiac perfusion of biotinylated dextran. VgatECKO tissue sections stained with streptavidin-Alexa 594 showed increased fluorescence (X) which was quantified and permeability relative to control was graphed (Y; n = 10, *P < 0.05, mean ± SD, Student's t-test). Scale bars: A, 50 μm (applies to S, T, W, X), B, 15 μm (applies to C, E, G), D, 100 μm (high-magnification inset 30 μm); F, 75 μm, I, 100 μm (applies to I, J, L, N, O, U, V).
Figure 5
Figure 5
Endothelial cell-derived GABA is essential for long-distance GABA neuronal migration. (A-D) GAD65/67 immunoreactivity showed decreased stream of GABA neurons in E13 and E15 VgatECKO telencephalon (red asterisks B, D) when compared to Vgatfl/fl telencephalon (white arrow A; asterisks C). White arrow in D shows unusual GAD65/67+ve cell clusters in VgatECKO telencephalon. (E) Experiment schematic: WT periventricular endothelial cells (pv ecs), WT control ecs or VgatECKO pv ecs (that do not secrete GABA) were seeded in a specific track spanning a 35 mm culture dish (red dotted boxes). GE neurons from GAD65-GFP telencephalon were plated at one end of the track (green box). Neuronal migration was analyzed in three panels A-C. (F) Robust long-distance migration of GE neurons on WT pv ecs (white arrows) when compared to WT control ecs or VgatECKO pv ecs (yellow asterisks). (G) Quantification of cell migration in (F); Data represent mean ± SD (n = 9, *P < 0.05, Student's t-test). (H) Similar observations were noticed when GE explants were cultured on WT pv ecs or VgatECKO pv ecs. White arrows point to robust neuronal migration, blue arrow points to stalled cells and yellow asterisk reveals no migration. (I-L) Telencephalic coronal sections of E17 Vgatfl/fl (I) and VgatECKO (K) embryos that received a single BrdU injection at E13, showing immunohistochemistry results with anti-BrdU antibody. Insets in (I) and (K) are magnified in (J) and (L). Several stalled BrdU+ cells were observed in VgatECKO ventral telencephalon (yellow asterisk, L) when compared to Vgatfl/fl ventral telencephalon (white asterisk, J). (M-P) Coronal sections through the dorsal telencephalon of E17 Vgatfl/fl (M, N) and VgatECKO (O, P) embryos that were injected with BrdU at E13, showing immunohistochemistry results for BrdU (M, O) and LHX6 (N, P). (Q, R) Quantification of the distribution of E13 LHX6 BrdU+ cells (Q) and LHX6+ BrdU+ cells (R) in Vgatfl/fl and VgatECKO E17 dorsal telencephalon; Data represent mean ± SD (n = 10, *P < 0.05, Student's t-test). Scale bars: A, 100 μm (applies to B-D, F, H, I, K), J, 50 μm (applies to L, M-P).
Figure 6
Figure 6
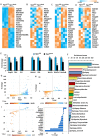
Embryonic telencephalic gene expression changes due to loss of endothelial GABA and consequent postnatal phenotype. (A) Heat map showing overall top 20 differentially expressed genes in VgatECKO versus Vgatfl/fl telencephalon (n = 3). (B-D) Heat maps were further classified to show top 20 differentially expressed genes in VgatECKO versus Vgatfl/fl telencephalon in three different categories: angiogenesis (B), neurogenesis (C) and GABA neuronal development (D). (E) Validation of altered expression of angiogenesis pathway genes in E15 Vgatfl/fl and VgatECKO periventricular endothelial cells by quantitative real-time PCR. (F) A classification of genes expressed in VgatECKO telencephalon using TPH1 CTD analysis shows enrichment in several neurological and psychiatric disease categories. Seizures and several different kinds of epilepsies were enriched in the list. (G-I) The scatter plots display values for each gene with signal present in tissue specimens. The percentage change in expression in VgatECKO samples compared to the WT and the Tstat associated with the comparison are indicated on the axes for all genes combined (G), McTague only genes (H) and CDT genes associated with seizure conditions by marker/mechanism, marker/mechanism/therapeutic and therapeutic direct evidence (I). The color of each mark indicates the t-test result for the comparison. (J) Graphical illustration of genes with percentage change in expression in VgatECKO telencephalon with respect to early infantile epileptic encephalopathy (isolated from).
Figure 7
Figure 7
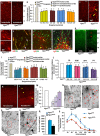
Postnatal phenotype of VgatECKO mice. (A-E) H&E staining revealed abnormal cellularity in VgatECKO cortical plate along the rostro caudal axis (red asterisks, B, D) when compared to Vgatfl/fl cortex (A). Dilated and abnormal ventricles were observed in VgatECKO ventral telencephalon (B-E). (F) VgatECKO pups were smaller in size at birth when compared to Vgatfl/fl pups. (G) Ictal activity in VgatECKO hippocampus (expanded with inset). (H) Spreading depression and preceding discontinuous interictal activity in VgatECKO hippocampus. (I) Continuous interictal activity in Vgatfl/fl hippocampus. (J) VgatECKO slices (n = 13) displayed ictal-type discharges significantly more frequently when compared to Vgatfl/fl slices (n = 10). VgatECKO slices (n = 13) exclusively showed repetitive spreading depression while control slices (n = 10) showed none (frequencies given as mean ± SEM, *P < 0.05, Fisher's exact test). (K) Pie chart depicting proportions of slices displaying interictal discharges in VgatECKO and Vgatfl/fl slices (*P < 0.05, χ2-test). (L) Somatosensory reflexes — surface righting and forelimb grasping were significantly affected in VgatECKO mice; Data represent mean ± SD (n = 9, *P < 0.05, Student's t-test). (M) VgatECKO mice showed significantly lower preference to maternal scent when compared to controls and instead spent longer time in the stranger's zone; Data represent mean ± SD (n = 9, *P < 0.05, Student's t-test). Scale bars: A, 100 μm (applies to B-E).
Figure 8
Figure 8
Postnatal consequences of loss of endothelial cell-derived GABA. (A, B) Significantly affected regions in VgatECKO brain at P30 were cingulate, motor, somatosensory and piriform cortex in which reductions in vessel density were observed. Images depict somatosensory cortex. VgatECKO data were normalized to Vgatfl/fl data; Data represent mean ± SD (n = 6, *P < 0.05, Student's t-test). (C, D) Extravascular IgG staining was observed in P30 VgatECKO cerebral cortex (yellow arrows, C) and IgGs formed halos around microvessels (D). (E-G) Co-labeling with isolectin B4 revealed that while IgGs are localized to vessels in Vgatfl/fl cortex (E), IgG leakage and uptake by neurons were observed at various time points after status epilepticus (F, G; n = 8). (H, I) Concurrent reduction in GABA cells was observed in the cortical regions examined. The GABA cell distribution was very abnormal in VgatECKO with several cells clustered in layer IV-V and few to none in upper layers (red asterisks) indicative of cortical asynchrony. VgatECKO data normalized to Vgatfl/fl data (I); Data represent mean ± SD (n = 6, *P < 0.05, Student's t-test). (J) Numbers of calretinin+, somatostatin+, neuropeptide Y+ and parvalbumin+ subclasses in somatosensory cortex from P30 old mice. VgatECKO data normalized to Vgatfl/fl data (J); Data represent mean ± SD (n = 10, *P < 0.05, Student's t-test). (K, L) Parvalbumin immunoreactive cells in the VgatECKO somatosensory cortex (L) showed a similar abnormal profile as GABA immunoreactive cells (H). Yellow asterisks in (L) point to significant reduction of parvalbumin+ cells in layers II/III and yellow arrow points to cells abnormally clustered in layer V. (M) Quantification of parvalbumin+ cells in Vgatfl/fl and VgatECKO somatosensory cortical layers; Data represent mean ± SD (n = 10, *P < 0.05, Student's t-test). (N-Q) Representative images of the basket cells in the Vgatfl/fl (N) and VgatECKO (P) somatosensory cortex. Basket cells sampled (red boxes; N, P) were mainly located at the layer II-III close to neighboring pyramidal cells (red asterisks) of the somatosensory cortex. Higher magnification of the basket cell morphology was illustrated in O and Q. Compared to Vgatfl/fl cortex (O), VgatECKO cortex showed a significant retraction of dendritic trees (red arrows in Q). (R) Comparison of dendritic length of Vgatfl/fl and VgatECKO basket cells. There was a 41% reduction of dendritic lengths of basket cells of the VgatECKO group when compared to the Vgatfl/fl group (n = 9, *P < 0.05, ANOVA). (S) Comparison of frequency of dendritic intersections × 30-μm interval from the soma of basket cells between Vgatfl/fl and VgatECKO group. There was a significant reduction in the frequency of intersections at a distance of 60-120-μm from the soma of basket cells of the VgatECKO group (n = 9, *P < 0.05, ANOVA and post hoc tests). Scale bars: A, 100 μm (applies to C, H, K, L, N, P), E, 50 μm (applies to F,G), D, 25 μm (applies to O, Q).
Figure 9
Figure 9
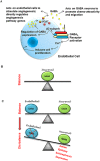
The significance of endothelial cell-derived GABA for brain development. (A) Summary schema depicting a novel positive feedback GABA signaling pathway in telencephalic endothelial cells. Endothelial GABA activates GABAA receptors, triggering Ca2+ influx and endothelial cell proliferation. Endothelial GABAA receptor β3 subunit can regulate GABA expression. VGAT is the primary mechanism for GABA release from telencephalic endothelial cells. Endothelial GABA release is essential for both angiogenesis and GABAergic neuronal migration in the embryonic telencephalon. (B) Current concepts depict the source of GABA in the embryonic telencephalon as neuronal. (C) Our studies show that the GABA balance in the embryonic telencephalon is maintained by both endothelial cells and neurons. Neuronal GABA cannot compensate for the loss of endothelial GABA. Tipping the balance to cause partial or complete loss of endothelial GABA can result in a spectrum of neuropsychiatric diseases such as autism, epilepsy, schizophrenia, anxiety and depression.

References

    1. Treiman DM. GABAergic mechanisms in epilepsy. Epilepsia 2001; 42 Suppl 3:8–12. - PubMed
    1. Marin O. Interneuron dysfunction in psychiatric disorders. Nat Rev Neurosci 2012; 13:107–120. - PubMed
    1. Levitt P, Eagleson KL, Powell EM. Regulation of neocortical interneuron development and the implications for neurodevelopmental disorders. Trends Neurosci 2004; 27:400–406. - PubMed
    1. Lewis DA, Hashimoto T, Volk DW. Cortical inhibitory neurons and schizophrenia. Nat Rev Neurosci 2005; 6:312–324. - PubMed
    1. Holmes GL, Ben-Ari Y. The neurobiology and consequences of epilepsy in the developing brain. Pediatr Res 2001; 49:320–325. - PubMed

MeSH terms