Meta-Analysis
. 2017 Dec;22(12):1680-1690.
doi: 10.1038/mp.2017.210. Epub 2017 Oct 31.

An epigenome-wide association study meta-analysis of educational attainment

R Karlsson Linnér  1   2 R E Marioni  3   4 C A Rietveld  2   5   6 A J Simpkin  7 N M Davies  8 K Watanabe  1 N J Armstrong  9 K Auro  10   11 C Baumbach  12 M J Bonder  13 J Buchwald  10 G Fiorito  14   15 K Ismail  10 S Iurato  16 A Joensuu  10   11 P Karell  10 S Kasela  17   18 J Lahti  19   20 A F McRae  21 P R Mandaviya  22   23 I Seppälä  24   25 Y Wang  26 L Baglietto  27 E B Binder  16   28 S E Harris  3   4 A M Hodge  29   30 S Horvath  31 M Hurme  32   33   34 M Johannesson  35 A Latvala  36 K A Mather  37 S E Medland  38 A Metspalu  17   18 L Milani  17 R L Milne  29   30 A Pattie  39 N L Pedersen  26 A Peters  12 S Polidoro  14 K Räikkönen  19 G Severi  14   29   40 J M Starr  4   41 L Stolk  22   42 M Waldenberger  12 J G Eriksson  43   44   45 T Esko  17   46 L Franke  13 C Gieger  12 G G Giles  29   30 S Hägg  26 P Jousilahti  11 J Kaprio  10   36 M Kähönen  47   48 T Lehtimäki  24   25 N G Martin  49 J B C van Meurs  23   42 M Ollikainen  10   36 M Perola  10   11 D Posthuma  1 O T Raitakari  50   51 P S Sachdev  37   52 E Taskesen  1   53 A G Uitterlinden  6   23   42 P Vineis  14   54 C Wijmenga  13 M J Wright  55 C Relton  8 G Davey Smith  8 I J Deary  4   39 P D Koellinger  1   2 D J Benjamin  56
Affiliations
Meta-Analysis

An epigenome-wide association study meta-analysis of educational attainment

R Karlsson Linnér et al. Mol Psychiatry. 2017 Dec.

Abstract

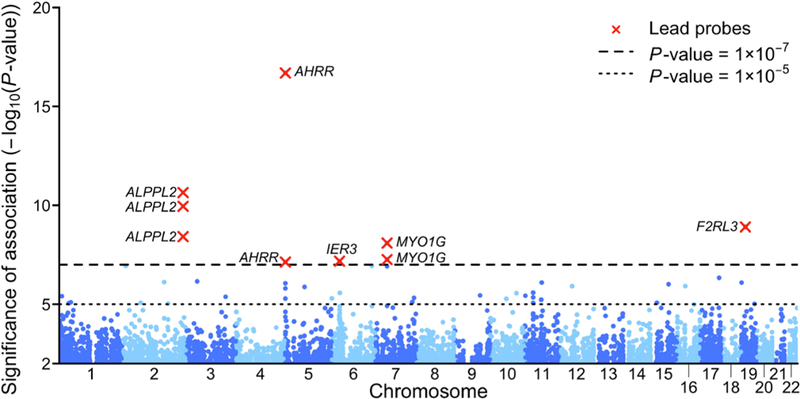
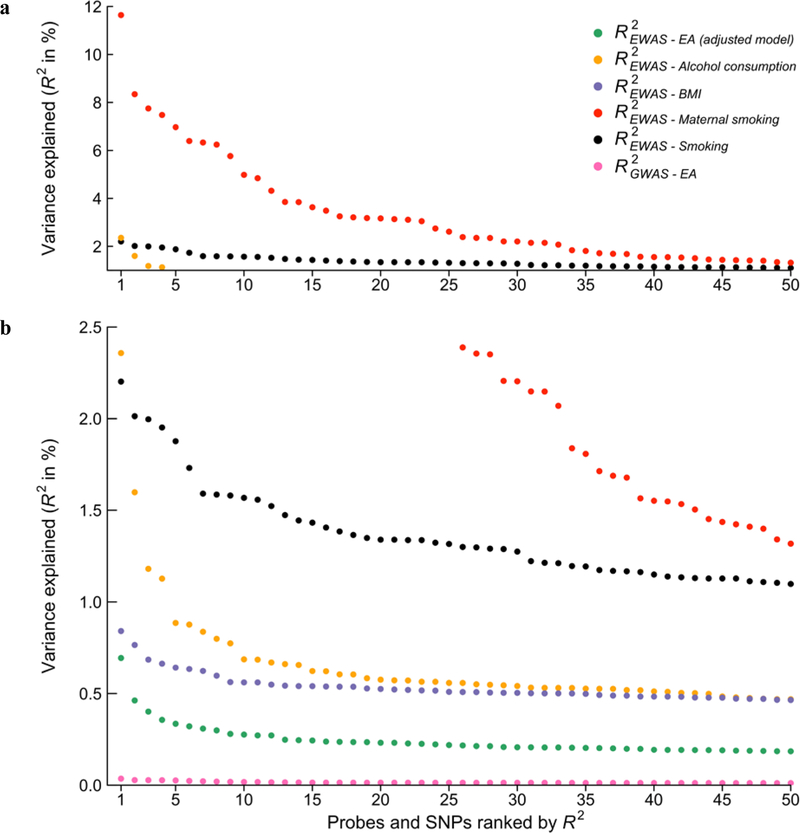
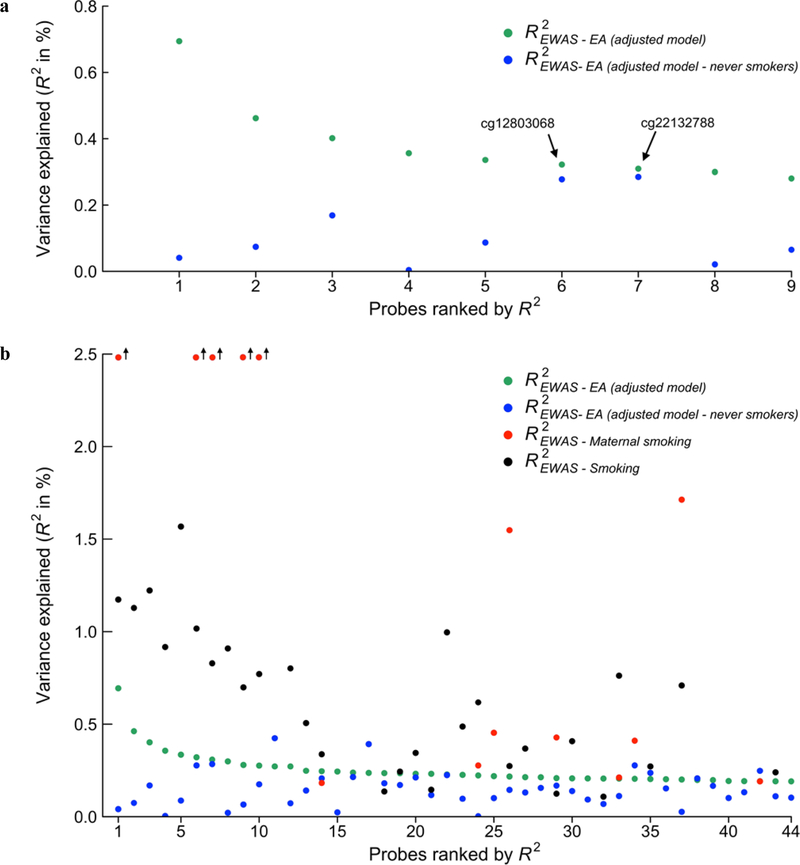
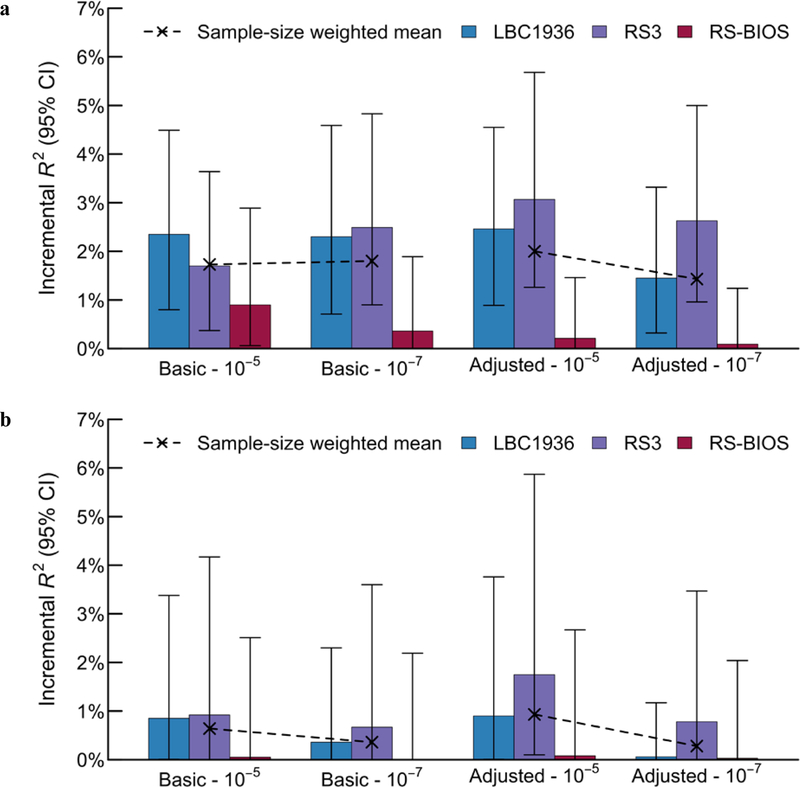
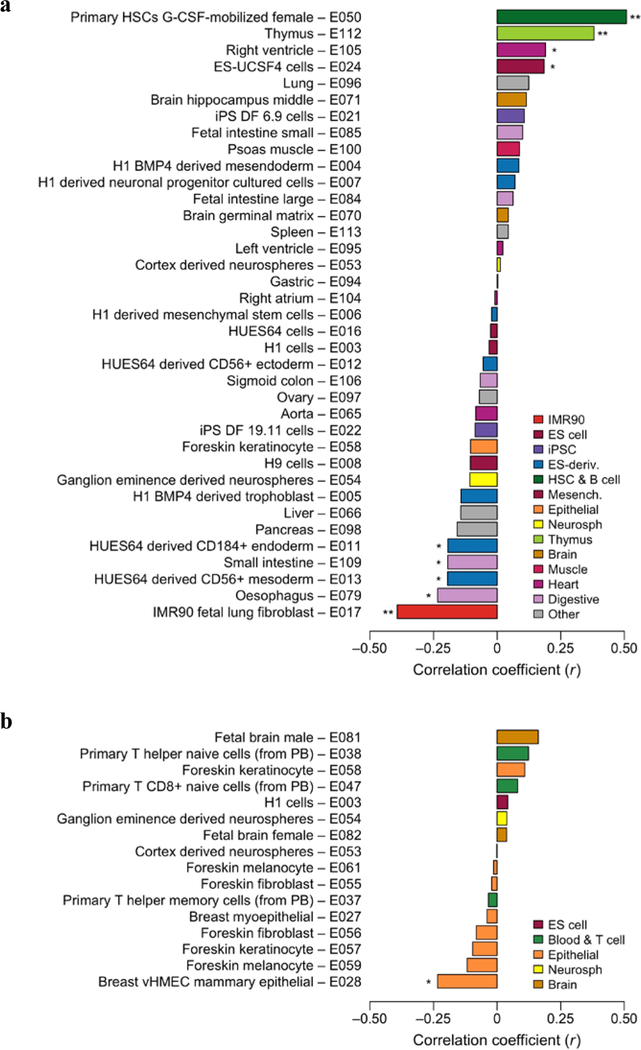
The epigenome is associated with biological factors, such as disease status, and environmental factors, such as smoking, alcohol consumption and body mass index. Although there is a widespread perception that environmental influences on the epigenome are pervasive and profound, there has been little evidence to date in humans with respect to environmental factors that are biologically distal. Here we provide evidence on the associations between epigenetic modifications-in our case, CpG methylation-and educational attainment (EA), a biologically distal environmental factor that is arguably among the most important life-shaping experiences for individuals. Specifically, we report the results of an epigenome-wide association study meta-analysis of EA based on data from 27 cohort studies with a total of 10 767 individuals. We find nine CpG probes significantly associated with EA. However, robustness analyses show that all nine probes have previously been found to be associated with smoking. Only two associations remain when we perform a sensitivity analysis in the subset of never-smokers, and these two probes are known to be strongly associated with maternal smoking during pregnancy, and thus their association with EA could be due to correlation between EA and maternal smoking. Moreover, the effect sizes of the associations with EA are far smaller than the known associations with the biologically proximal environmental factors alcohol consumption, body mass index, smoking and maternal smoking during pregnancy. Follow-up analyses that combine the effects of many probes also point to small methylation associations with EA that are highly correlated with the combined effects of smoking. If our findings regarding EA can be generalized to other biologically distal environmental factors, then they cast doubt on the hypothesis that such factors have large effects on the epigenome.


Figures

Figure 1 –
Figure 1 –. Manhattan plot of the adjusted EWAS model.
The figure displays the Manhattan plot of the meta-analysis of the adjusted EWAS model (the Manhattan plot of the basic model is reported in Supplementary Note). The x-axis is chromosomal position, and the y-axis is the significance on a −log 10 scale. The dashed lines mark the threshold for epigenome-wide significance (P = 1×10⁻⁷) and for suggestive significance (P = 1×10⁻⁵). Each epigenome-wide associated probe is marked with a red ×, and the symbol of the closest gene based on physical position.
Figure 2 –
Figure 2 –. EWAS effect sizes (in terms of variance explained) across traits and with GWAS.
The figure displays the effect size estimates in terms of R2, in descending order, for the 50 top probes of the adjusted EWAS model. For comparison we present the 50 top probes from recent EWAS on alcohol consumption (n = 9,643, Liu et al., 2016), BMI (n = 7,798, Mendelson et al., 2017), smoking (n = 9,389, Joehanes et al., 2016), and maternal smoking (n= 6,685, Joubert et al., 2016). For comparison with GWAS effect sizes we contrast the EWAS probes with the effect sizes of the 50 top approximately independent SNPs from a recent GWAS on educational attainment (n = 405,073, Okbay et al., 2016). Panel (a) and (b) display the same results but with a different scaling of the y-axis in order for the smaller effect sizes to be visible.
Figure 3 –
Figure 3 –. Comparison of EA EWAS effect sizes with the effect sizes in the never-smoker subsample and in smoking EWAS results.
Panel (a) displays the effect-size estimates in terms of R2 for the 9 lead probes, in descending order, and the lead probe’s corresponding effect size when re-estimated in the subsample of never smokers. Panel (b) displays the same information for the probes of the adjusted model with P < 1×10⁻⁵ (including the 9 lead probes), as well as the same probes’ effect-size estimates from two recent EWAS of smoking (n = 9,389, Joehanes et al., 2016), and maternal smoking (n = 6,685, Joubert et al., 2016). The smoking and maternal smoking estimates are only publicly available for probes associated at FDR < 0.05 in the respective EWAS.
Figure 4 –
Figure 4 –. Effect size estimates (in days) of the epigenetic clock analyses with 95% confidence intervals.
Panel (a) displays the effect size estimates from the basic age acceleration model, and panel (b) displays the effect size estimates from the adjusted age acceleration model. The effect size is denoted in days of age acceleration per year of EA, and error bars represent 95% confidence intervals.
Figure 5 –
Figure 5 –. Methylation score prediction of educational attainment in independent holdout samples.
Panel (a) displays the prediction in all individuals, and panel (b) displays the prediction in the subsample of never smokers. Four methylation scores were constructed: using coefficient estimates from the basic model versus adjusted model, crossed with a P-value threshold of 10–5 and 10–7. The sample sizes of the LBC1936, the RS3, and the RS-BIOS cohorts are 918, 728, and 671 individuals, respectively. We performed sample-size-weighted meta-analysis across the cohorts for each of the four methylation-score prediction analyses. From left to right, the respective P-values testing the null hypothesis of zero predictive power are 4.42×10⁻¹¹, 7.76×10⁻¹¹, 2.02×10⁻¹¹, and 3.28×10⁻⁸ for the full sample and 0.0183, 0.0898, 0.0051, and 0.1818 for the never-smokers, respectively. The full prediction results are presented in Supplementary Table S1.9a and S1.9b.
Figure 6 –
Figure 6 –. Correlations between tissue-specific methylation and the EWAS association results (adjusted model).
Panel (a) displays the correlation estimates based on the whole-genome bisulfite sequencing (WGBS) methylation measurement, and (b) displays results based on the mCRF methylation measurement. (The mCRF measurement combines sequencing data from the MeDIP-seq and MRE-seq methods.) The method is described in Supplementary Note 7. Correlations that are significant after Bonferroni correction are marked with two asterisks (**), and marginal significance (P < 0.05) is marked with one asterisk (*). The tissue-specific methylation data is from the Roadmap Epigenomics Consortium, and we used their categorization and colour code for simplicity of comparison.

References

    1. Rakyan VK, Down TA, Balding DJ, Beck S. Epigenome-wide association studies for common human diseases. Nat. Rev. Genet 2012; 12, 529–541. - PMC - PubMed
    1. Veldhoven KV, Polidoro S, Baglietto L, Severi G, Sacerdote C, Panico S et al. Epigenome-wide association study reveals decreased average methylation levels years before breast cancer diagnosis. Clin. Epigenetics 2015; 7: 67–79. - PMC - PubMed
    1. Champagne FA, Curley JP. Epigenetic Influence of the Social Environment. In Petronis A, Mill J (ed). Brain, Behavior, and Epigenetics Springer-Verlag Berlin Heidelberg: Heidelberg, DE, 2011, pp 23–40.
    1. Beach SRH, Lei M-K, Brody GH, Kim S, Barton AW, Dogan MV et al. Parenting, Socioeconomic Status Risk, and Later Young Adult Health: Exploration of Indirect Effects via DNA Methylation. Child Dev 2016; 87: 111–121. - PMC - PubMed
    1. Borghol N, Suderman S, McArdle W, Racine A, Hallet M, Pembrey M et al. Associations with early-life socio-economic position in adult DNA methylation. Int. J. Epidemiol 2012; 41: 62–74. - PMC - PubMed

Publication types