

Rapid recovery and altered neurochemical dependence of locomotor central pattern generation following lumbar neonatal spinal cord injury
- PMID: 29086918
- PMCID: PMC5767688
- DOI: 10.1113/JP274484
Rapid recovery and altered neurochemical dependence of locomotor central pattern generation following lumbar neonatal spinal cord injury
Abstract
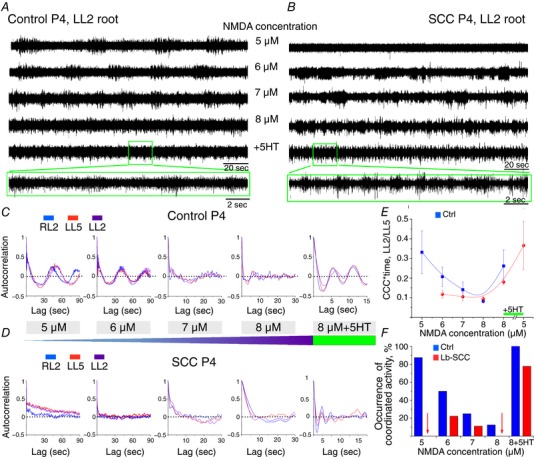
Key points: Spinal compression injury targeted to the neonatal upper lumbar spinal cord, the region of highest hindlimb locomotor rhythmogenicity, leads to an initial paralysis of the hindlimbs. Behavioural recovery is evident within a few days and approaches normal function within about 3 weeks. Fictive locomotion in the isolated injured spinal cord cannot be elicited by a neurochemical cocktail containing NMDA, dopamine and serotonin 1 day post-injury, but can 3 days post-injury as readily as in the uninjured spinal cord. Low frequency coordinated rhythmic activity can be elicited in the isolated uninjured spinal cord by NMDA + dopamine (without serotonin), but not in the isolated injured spinal cord. In both the injured and uninjured spinal cord, eliciting bona fide fictive locomotion requires the additional presence of serotonin.
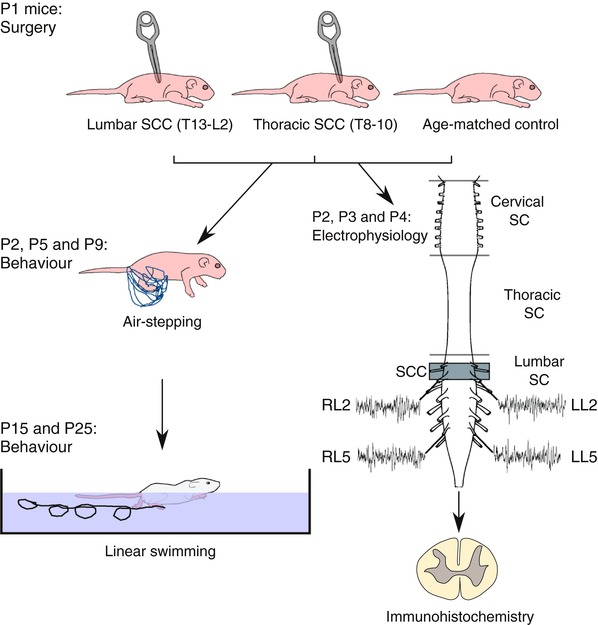
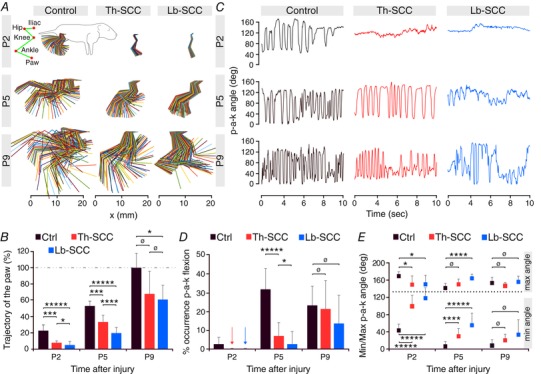
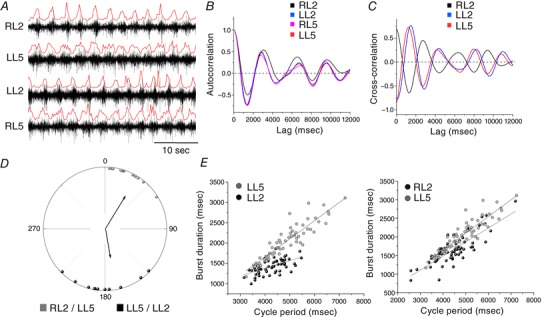
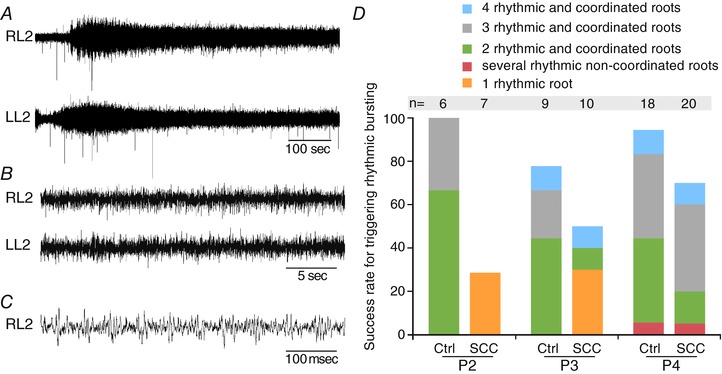
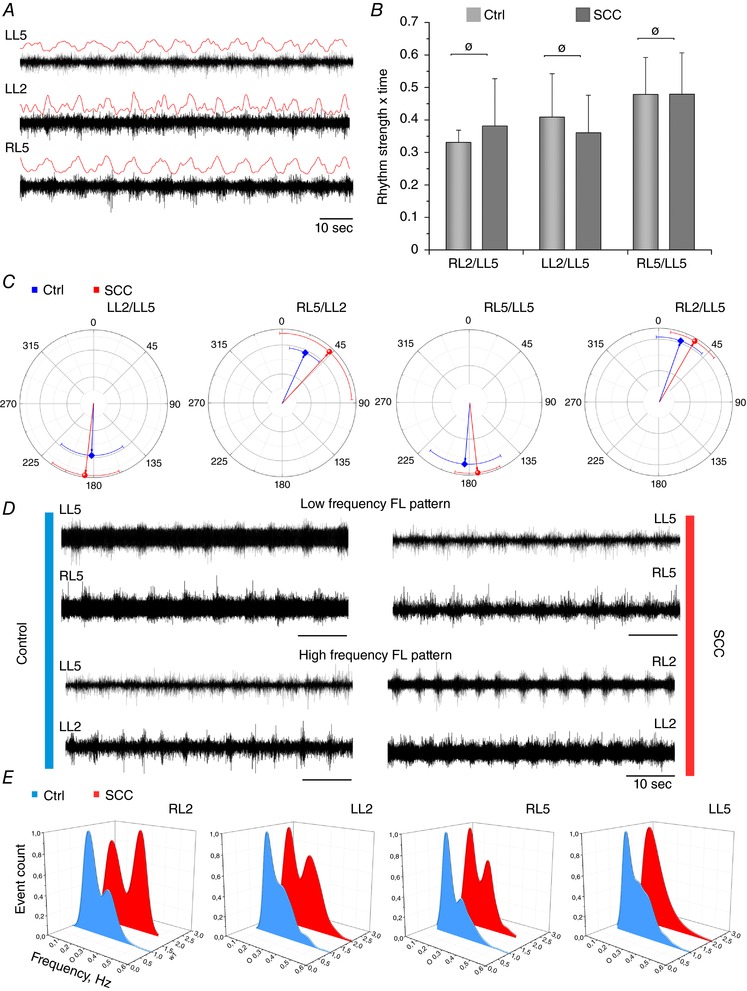
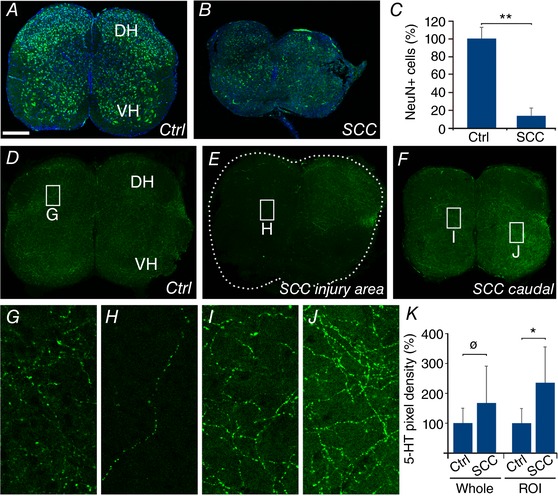
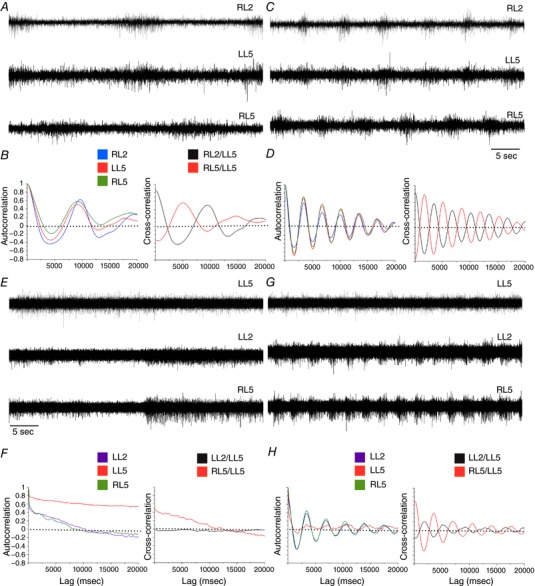
Abstract: Following incomplete compression injury in the thoracic spinal cord of neonatal mice 1 day after birth (P1), we previously reported that virtually normal hindlimb locomotor function is recovered within about 3 weeks despite substantial permanent thoracic tissue loss. Here, we asked whether similar recovery occurs following lumbar injury that impacts more directly on the locomotor central pattern generator (CPG). As in thoracic injuries, lumbar injuries caused about 90% neuronal loss at the injury site and increased serotonergic innervation below the injury. Motor recovery was slower after lumbar than thoracic injury, but virtually normal function was attained by P25 in both cases. Locomotor CPG status was tested by eliciting fictive locomotion in isolated spinal cords using a widely used neurochemical cocktail (NMDA, dopamine, serotonin). No fictive locomotion could be elicited 1 day post-injury, but could within 3 days post-injury as readily as in age-matched uninjured control spinal cords. Burst patterning and coordination were largely similar in injured and control spinal cords but there were differences. Notably, in both groups there were two main locomotor frequencies, but injured spinal cords exhibited a shift towards the higher frequency. Injury also altered the neurochemical dependence of locomotor CPG output, such that injured spinal cords, unlike control spinal cords, were incapable of generating low frequency rhythmic coordinated activity in the presence of NMDA and dopamine alone. Thus, the neonatal spinal cord also exhibits remarkable functional recovery after lumbar injuries, but the neurochemical sensitivity of locomotor circuitry is modified in the process.
Keywords: adaptive plasticity; network re-organization; recovery; spinal cord injury; sprouting.
© 2017 The Authors. The Journal of Physiology © 2017 The Physiological Society.
Figures
Comment in
-
Locomotor recovery after lumbar spinal cord injury: fact or fancy?J Physiol. 2018 Jan 15;596(2):137-138. doi: 10.1113/JP275488. Epub 2017 Dec 18. J Physiol. 2018. PMID: 29164627 Free PMC article. No abstract available.
Similar articles
-
Locomotor central pattern generator excitability states and serotonin sensitivity after spontaneous recovery from a neonatal lumbar spinal cord injury.Brain Res. 2019 Apr 1;1708:10-19. doi: 10.1016/j.brainres.2018.12.001. Epub 2018 Dec 4. Brain Res. 2019. PMID: 30521786
-
Neuronal activity in the isolated mouse spinal cord during spontaneous deletions in fictive locomotion: insights into locomotor central pattern generator organization.J Physiol. 2012 Oct 1;590(19):4735-59. doi: 10.1113/jphysiol.2012.240895. Epub 2012 Aug 6. J Physiol. 2012. PMID: 22869012 Free PMC article.
-
Locomotor rhythmogenesis in the isolated rat spinal cord: a phase-coupled set of symmetrical flexion extension oscillators.J Physiol. 2007 Aug 15;583(Pt 1):115-28. doi: 10.1113/jphysiol.2007.133413. Epub 2007 Jun 14. J Physiol. 2007. PMID: 17569737 Free PMC article.
-
The role of serotonin in the control of locomotor movements and strategies for restoring locomotion after spinal cord injury.Acta Neurobiol Exp (Wars). 2014;74(2):172-87. doi: 10.55782/ane-2014-1983. Acta Neurobiol Exp (Wars). 2014. PMID: 24993627 Review.
-
The role of the serotonergic system in locomotor recovery after spinal cord injury.Front Neural Circuits. 2015 Feb 9;8:151. doi: 10.3389/fncir.2014.00151. eCollection 2014. Front Neural Circuits. 2015. PMID: 25709569 Free PMC article. Review.
Cited by
-
Quantification of surviving neurons after contusion, dislocation, and distraction spinal cord injuries using automated methods.J Exp Neurosci. 2019 Aug 19;13:1179069519869617. doi: 10.1177/1179069519869617. eCollection 2019. J Exp Neurosci. 2019. PMID: 31456647 Free PMC article.
-
How to generate graded spinal cord injuries in swine - tools and procedures.Dis Model Mech. 2021 Aug 1;14(8):dmm049053. doi: 10.1242/dmm.049053. Epub 2021 Aug 31. Dis Model Mech. 2021. PMID: 34464444 Free PMC article.
-
Central Pattern Generators in Spinal Cord Injury: Mechanisms, Modulation, and Therapeutic Strategies for Motor Recovery.JOR Spine. 2025 Aug 11;8(3):e70100. doi: 10.1002/jsp2.70100. eCollection 2025 Sep. JOR Spine. 2025. PMID: 40791879 Free PMC article. Review.
-
Know How to Regrow-Axon Regeneration in the Zebrafish Spinal Cord.Cells. 2021 Jun 6;10(6):1404. doi: 10.3390/cells10061404. Cells. 2021. PMID: 34204045 Free PMC article. Review.
-
Enhancing rehabilitation and functional recovery after brain and spinal cord trauma with electrical neuromodulation.Curr Opin Neurol. 2019 Dec;32(6):828-835. doi: 10.1097/WCO.0000000000000750. Curr Opin Neurol. 2019. PMID: 31567546 Free PMC article. Review.
References
-
- Antri M, Orsal D & Barthe J‐Y (2002). Locomotor recovery in the chronic spinal rat: effects of long‐term treatment with a 5‐HT2 agonist. Eur J Neurosci 16, 467–476. - PubMed
Publication types
MeSH terms
Substances
LinkOut - more resources
Full Text Sources
Other Literature Sources
Medical
Research Materials