. 2018 Feb 14;18(2):660-668.
doi: 10.1021/acs.nanolett.7b03987. Epub 2017 Dec 6.

DNA Translocations through Nanopores under Nanoscale Preconfinement

Affiliations

DNA Translocations through Nanopores under Nanoscale Preconfinement

Kyle Briggs et al. Nano Lett. .

Abstract

To reduce unwanted variation in the passage speed of DNA through solid-state nanopores, we demonstrate nanoscale preconfinement of translocating molecules using an ultrathin nanoporous silicon nitride membrane separated from a single sensing nanopore by a nanoscale cavity. We present comprehensive experimental and simulation results demonstrating that the presence of an integrated nanofilter within nanoscale distances of the sensing pore eliminates the dependence of molecular passage time distributions on pore size, revealing a global minimum in the coefficient of variation of the passage time. These results provide experimental verification that the inter- and intramolecular passage time variation depends on the conformational entropy of each molecule prior to translocation. Furthermore, we show that the observed consistently narrower passage time distributions enables a more reliable DNA length separation independent of pore size and stability. We also demonstrate that the composite nanofilter/nanopore devices can be configured to suppress the frequency of folded translocations, ensuring single-file passage of captured DNA molecules. By greatly increasing the rate at which usable data can be collected, these unique attributes will offer significant practical advantages to many solid-state nanopore-based sensing schemes, including sequencing, genomic mapping, and barcoded target detection.

Keywords: DNA; Nanopore; entropy; nanoconfinement; nanofabrication; nanotechnology.


Conflict of interest statement

Competing Financial Interest

JLM declares a competing financial interest as a co-founder and equity holder of SiMPore Inc., a commercial manufacturer of NPN and silicon-based membrane materials. VTC and KB declare a competing financial interest in the form of a patent on the nanofiltered nanopore device. All other authors declare no competing financial interest.

Figures

Figure 1
Figure 1
a) 50 nm NPN membrane is aligned to a 20 nm SiN membrane, patterned with a 200 nm SiO2 spacer. b) Condensation of water vapor penetrates the NPN membrane, inundates the nanocavity, and draws the NPN membrane to the SiO2 spacer. c) The NPN membrane is torn away from the carrier chip by surface tension, and remains attached to the SiO2 spacer and SiN surface. d) Nanopore fabrication by controlled breakdown with the nanofilter already in place. e) SEM image of a device after step c. A section of NPN membrane is torn away, revealing the SiO2 spacer underneath. The pore may be formed in any oxide microwell in the darker central region, which corresponds to the free-standing SiN membrane. The device shown in this SEM image has a 2 µm microwell, whereas the devices used in the rest of the paper use 1 µm microwells.
Figure 2
Figure 2
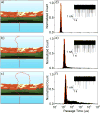
a, b, c) Schematic representations of 1000, 2000, and 3000 bp dsDNA traversing the nanofiltered pore device, respectively. Vertical distance and DNA length is to scale. d, e, f) Passage time histograms of unfolded type 1 events for the corresponding lengths of dsDNA. All three histograms are obtained using the same pore, while the pore grew during the course of the experiment (4.3h), from top to bottom, from 6.7 nm, to 7.3 nm, and finally to 8.0 nm, respectively. Insets: time series of dsDNA translocations (including folded events) for the corresponding histogram. Data recorded at 4.166 MHz sampling rate, digitally filtered with a low-pass Bessel filter at 900 kHz, and down-sampled to 2.5 MHz for plotting.
Figure 3
Figure 3
Mean passage times for a) nanofiltered, b) control, and c) simulated nanofiltered pores as a function of DNA length. The solid blue lines are a fit of eq 2 to the data in a), while the dashed line in c) is a fit to the simulated data. Standard deviation of passage times for d) nanofiltered, e) control, and f) simulated nanofiltered pores. The solid red lines are a fit of eq 3 to the data in d). The dotted lines in d) show the two power laws separately, while the dotted line in f) shows the two-power fit to the simulated results. Coefficient of variation for g) nanofiltered, h) control, and i) simulated nanofiltered pores. The solid green lines are the quotient of the fits in a) and d), while the dotted line in i) is the quotient of the fits to simulated data.
Figure 4
Figure 4
a) Experimental mean passage times normalized by the fit of eq 1 as a function of sensing pore size for both nanofiltered (black squares) and control pores (blue circles). Inset schematics show stretching of the polymer as it enters the capture radius of control pores for two different pore sizes. b) Experimental standard deviation normalized by the fit of eq 3 as a function of sensing pore size c) Simulated projection of the radius of gyration on the vector connecting the sensing pore and the center of mass of the DNA at the moment of capture, for molecules initialized with one end in the nanofilter (black squares) versus one end in the sensing pore (blue circles). d) Schematics illustrating the expected conformations of polymers at the onset of translocation for small and large pores with and without the nanofilter. Red gradients depict the electric profile outside the pore, while blue dots represent the potential interaction sites between the polymer and the membrane outside the pore.
Figure 5
Figure 5
a) Heat map of sublevels within events, showing blockage depth as a function of sub-level duration for events which fall within the tail of long events for 3000 bp dsDNA in an 8.0 nm nanofiltered pore. b) For comparison, the sublevel breakdown for a control pore (no nanofilter), showing that the long tail of events is absent c, d) Distribution of passage times and inter-event times respectively for superimposed events within long single-level events (red) compared to the passage time distribution for unhindered events from the same pore (black). e–g) Examples of a single-level, unfolded type 1 event, a briefly initially folded type 21 event, and a more complex event, respectively, from among the 3000 bp double-threaded events. h–j) schematic representations of the molecular conformations giving rise to each of the corresponding event signatures above. Red DNA represents a polymer which is adsorbed to the filter while other colors translocate freely.
Figure 6
Figure 6
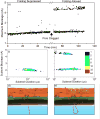
a) Maximum blockage as a function of experiment time, showing near-complete suppression of folding during the first half of the experiment, followed by allowing folding after a period of prolonged clogging. The single-occupancy blockage level is around 2 nA for this 5.4 nm sensing pore. b) Heat map of the sub-levels for events from the folding-suppressed half of the experiment. c) Heat map of the sub-levels for events from the folding-allowed half of the experiment, following clogging of the sensing pore. d) Schematic of the hypothesized mechanism of folding suppression consisting of two closely-spaced nanofilter pores. e) Schematic depicting how the folding suppression can be lost when one or more of the active nanofilter pores is clogged.

References

    1. Carson S, Wanunu M. Nanotechnology. 2015;26:1–14. - PMC - PubMed
    1. Heerema SJ, Dekker C. Nat. Nanotechnol. 2016;11:127–136. - PubMed
    1. Dekker C. Nat. Nanotechnol. 2007;2:209–215. - PubMed
    1. van Dorp S, Keyser UF, Dekker NH, Dekker C, Lemay SG. Nat. Phys. 2009;5:347–351.
    1. Gershow M, Golovchenko JA. Nat. Nanotechnol. 2007;2:775–779. - PMC - PubMed

Publication types