. 2017 Nov 9;551(7679):227-231.
doi: 10.1038/nature24470. Epub 2017 Nov 1.

Kctd13 deletion reduces synaptic transmission via increased RhoA

Affiliations

Kctd13 deletion reduces synaptic transmission via increased RhoA

Christine Ochoa Escamilla et al. Nature. .

Abstract

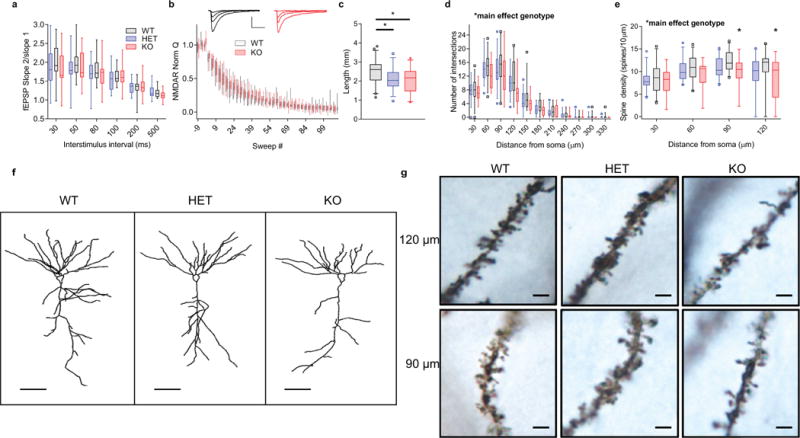
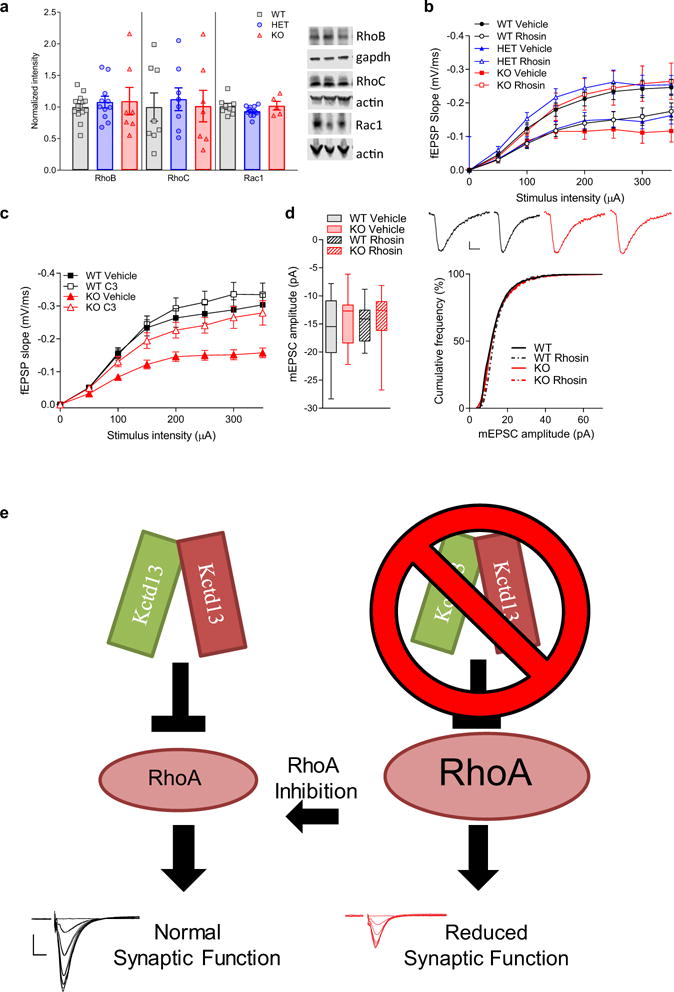
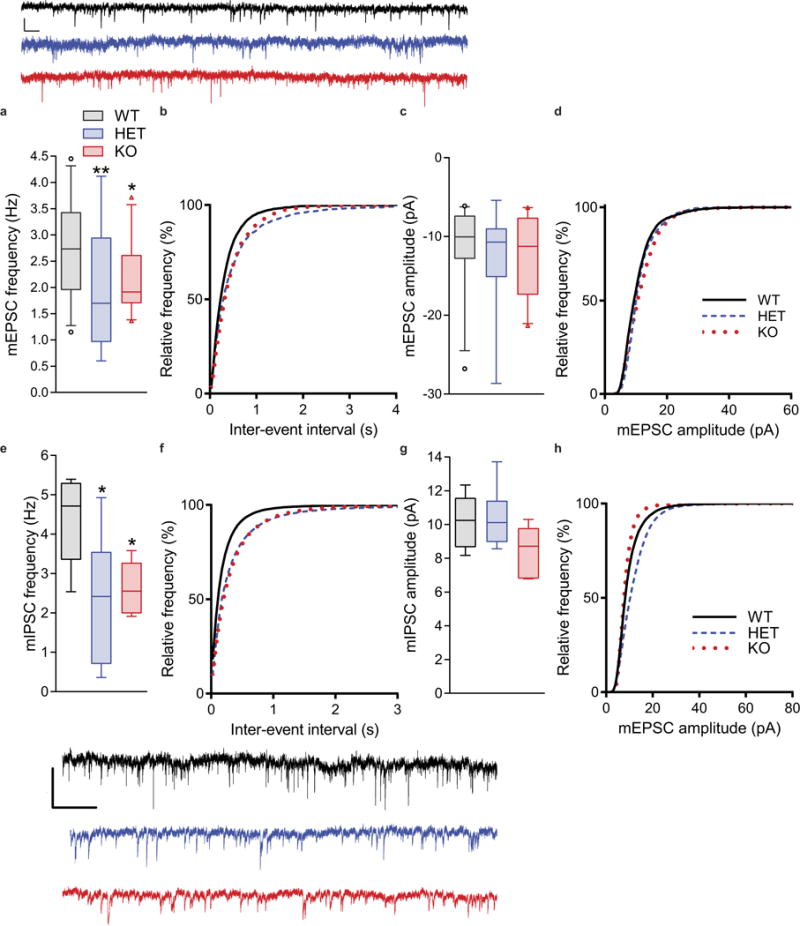
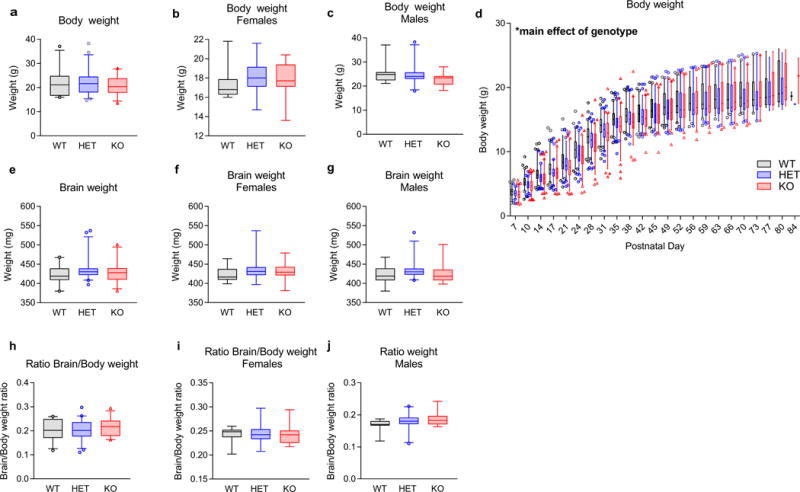
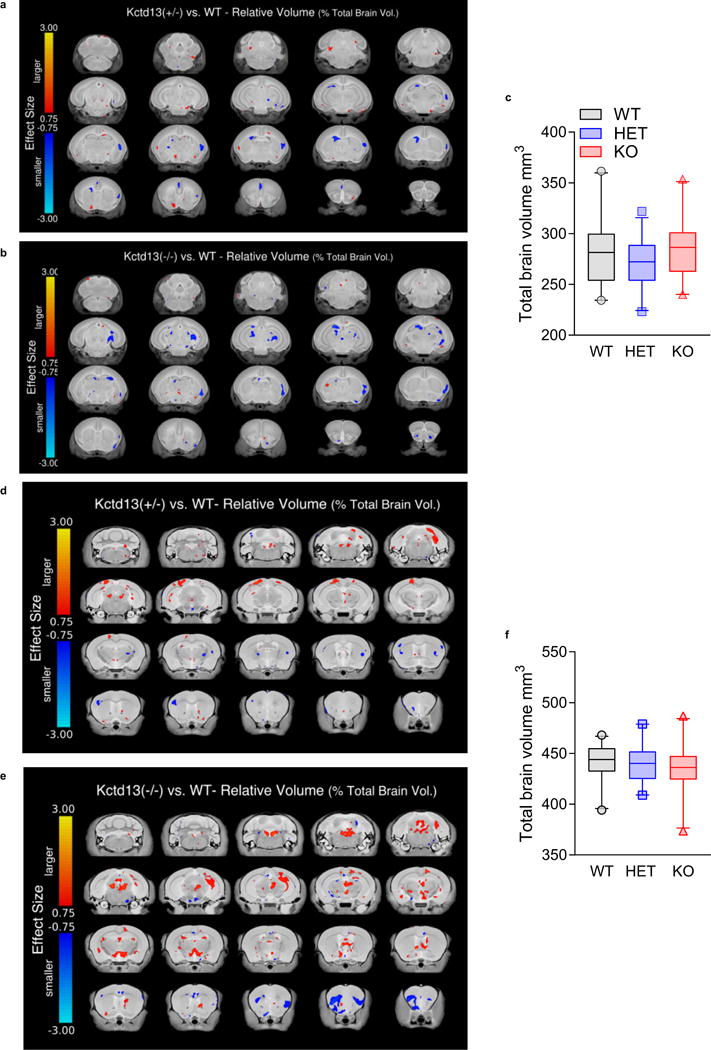
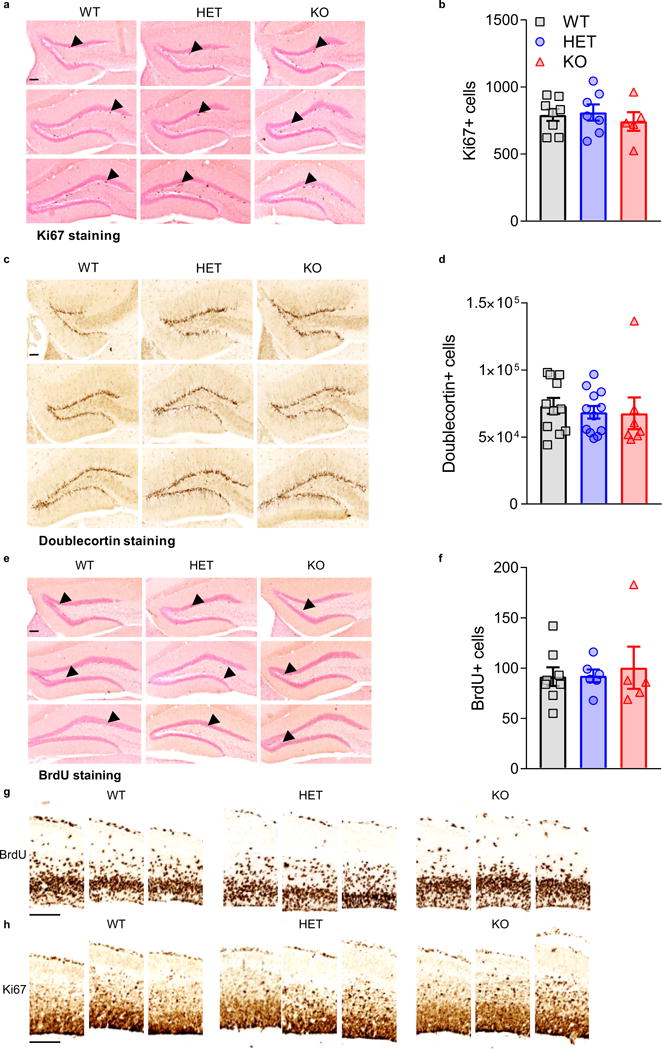
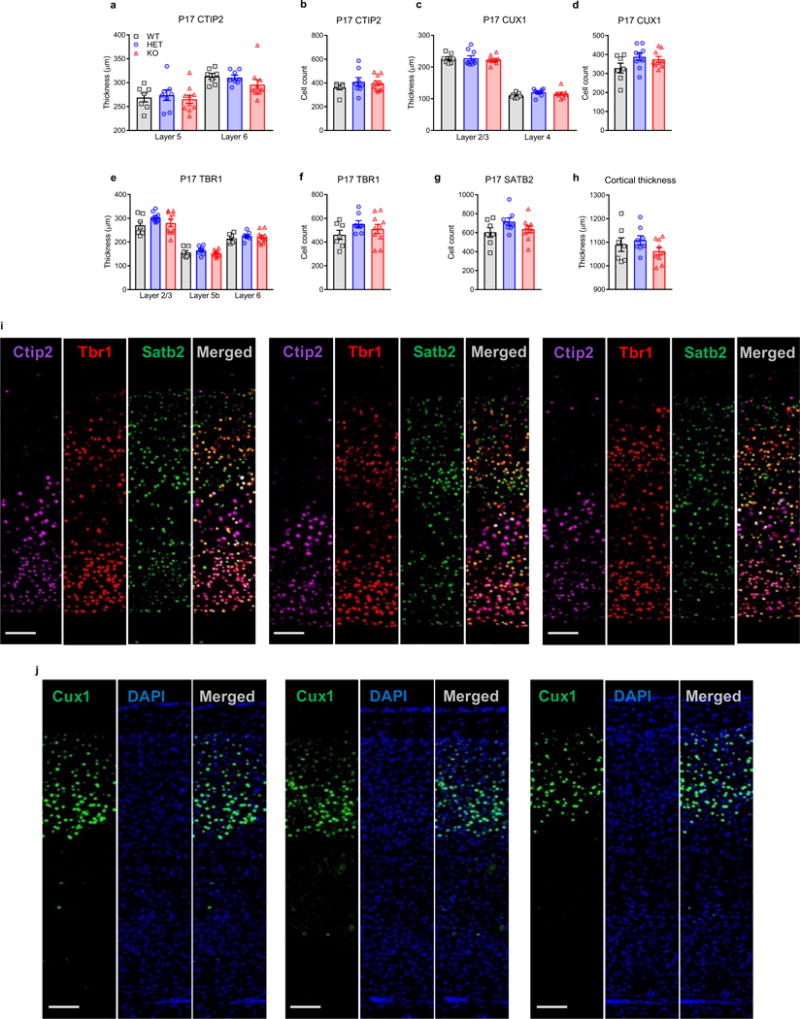
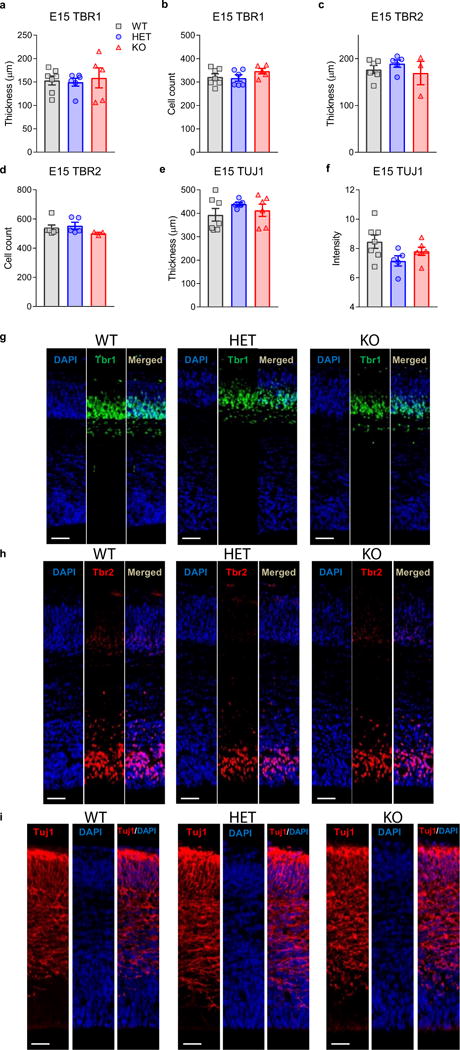
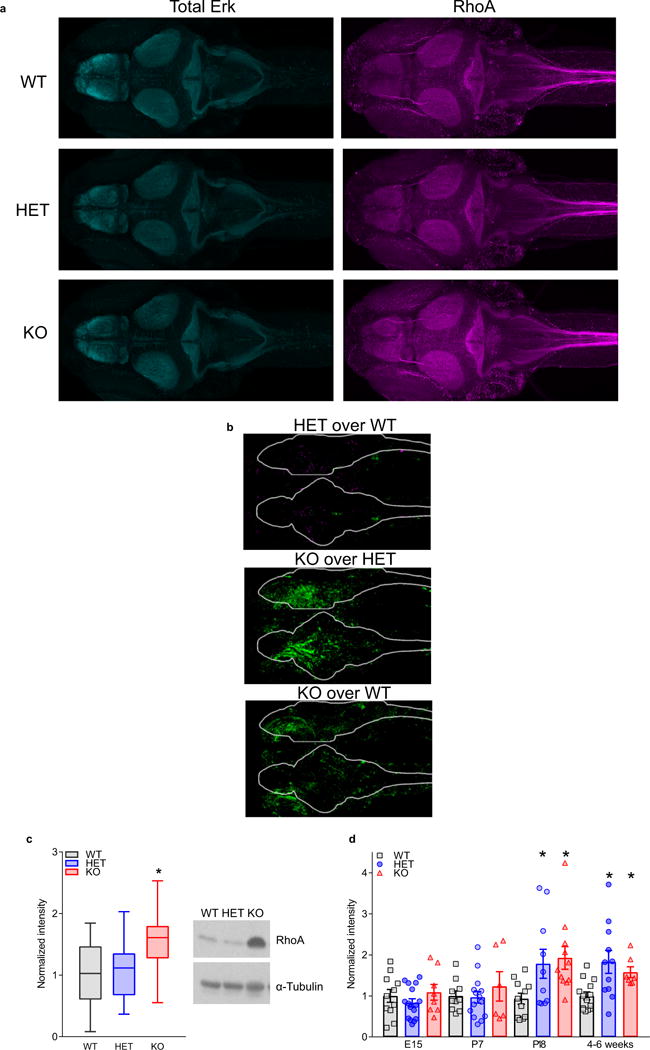
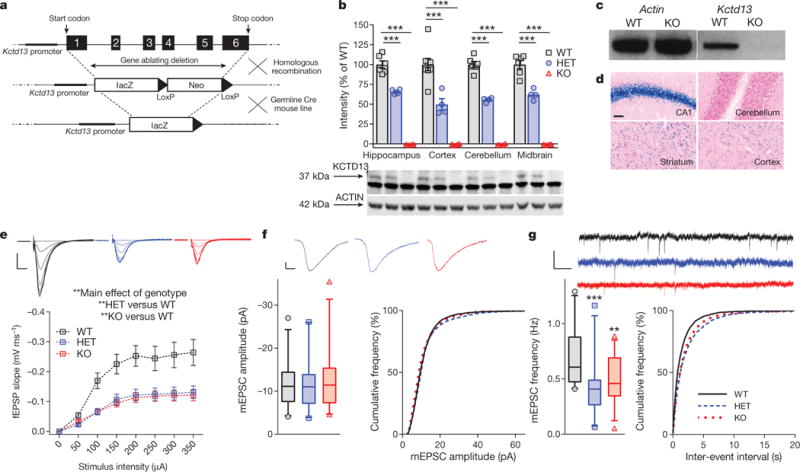
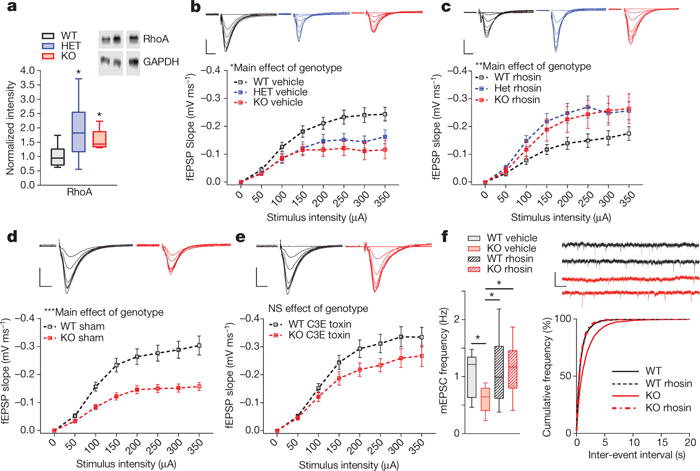
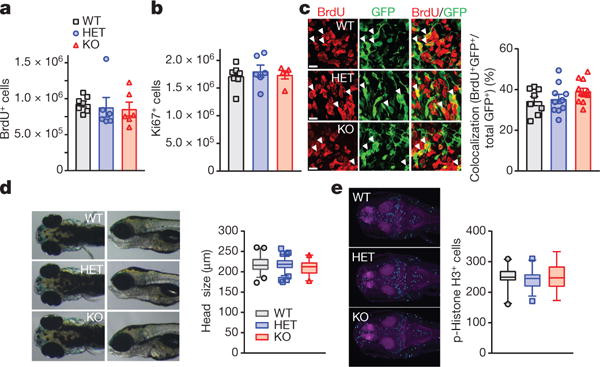
Copy-number variants of chromosome 16 region 16p11.2 are linked to neuropsychiatric disorders and are among the most prevalent in autism spectrum disorders. Of many 16p11.2 genes, Kctd13 has been implicated as a major driver of neurodevelopmental phenotypes. The function of KCTD13 in the mammalian brain, however, remains unknown. Here we delete the Kctd13 gene in mice and demonstrate reduced synaptic transmission. Reduced synaptic transmission correlates with increased levels of Ras homolog gene family, member A (RhoA), a KCTD13/CUL3 ubiquitin ligase substrate, and is reversed by RhoA inhibition, suggesting increased RhoA as an important mechanism. In contrast to a previous knockdown study, deletion of Kctd13 or kctd13 does not increase brain size or neurogenesis in mice or zebrafish, respectively. These findings implicate Kctd13 in the regulation of neuronal function relevant to neuropsychiatric disorders and clarify the role of Kctd13 in neurogenesis and brain size. Our data also reveal a potential role for RhoA as a therapeutic target in disorders associated with KCTD13 deletion.


Conflict of interest statement

The authors declare competing financial interests: details are available in the online version of the paper. Readers are welcome to comment on the online version of the paper.

Figures

Extended Data Figure 1
Extended Data Figure 1. Loss of Kctd13 causes no change in indirect measures of presynaptic release probability and reduces CA1 pyramidal neuron dendritic length, branching, and spine density
a, Paired-pulse ratio is unchanged at inter-stimulus intervals of 30–500 ms; P = 0.537 (WT n = 18/6 slices/mice; HET n = 17/7; KO n = 17/6). Scale bar, 0.1 mV, 25 ms. b, Rate of decay of NMDAR-mediated EPSC in presence of MK-801; P = 0.360 (WT n = 15/6 cells/mice; KO n = 12/6). Scale bar, 60 pA, 100 ms. c, Total dendritic length is decreased in CA1 pyramidal neurons of Kctd13 mutant mice (WT n = 43/11 neurons/mice; HET n = 33/11; KO n = 29/6). P = 0.011; post hoc: WT versus HET P = 0.14351; WT versus KO P = 0.0046, HET versus KO P = 0.069. d, Kctd13 homozygous mutants have decreased dendritic complexity at 60–120 μm. P = 0.022; post hoc: WT versus HET P = 0.27048; WT versus KO P = 0.0096; HET versus KO P = 0.06014. WT n = 30/11 cells/mice; HET n = 31/11; KO n = 17/6. e, Decreased spine density in CA1 pyramidal neurons (WT n = 30/11 cells/mice; HET n = 31/11; KO n = 14/6). P = 0.042; post hoc: WT versus KO P = 0.0386; WT versus HET P = 0.17584; HET versus KO P = 0.261. f, Representative dendritic tracings from WT, HET, and KO CA1 pyramidal neurons; scale bar, 50 μm. g, Representative Golgi images; scale bar, 2 μm. *P < 0.05. Box (interquartile range), whiskers (5th–95th percentile confidence intervals), line (median) in this and all similar box and whisker plots.
Extended Data Figure 2
Extended Data Figure 2. Rho GTPase westerns, RhoA inhibitor synaptic transmission data, and model schematic summary
a, Western blots of hippocampal lysates from Kctd13 mutants reveal no change in RhoB, RhoC, or Rac1. b, Combined data from Fig. 2c, d. c, Combined data from Fig. 2e, f. d, Slice incubation (3.5 h) with rhosin had no effect on mEPSC amplitude; P = 0.396 (WT vehicle n = 12/4 cells/mice; KO vehicle n = 17/4; WT rhosin n = 17/4; KO rhosin n = 18/4). Inset: representative mEPSC averaged traces. Scale bar, 2 pA, 5 ms. e, Under normal neuronal conditions, KCTD13 (probably acting with the ubiquitin E3 ligase CUL3, not shown) inhibits RhoA levels and allows for normal synaptic function (left). Heterozygous or homozygous deletion of Kctd13 leads to increased RhoA levels, causing decreased synaptic transmission (right). RhoA inhibition (centre) normalizes RhoA activity to restore synaptic function to normal. Mean ± s.e.m. in ac. Box (interquartile range), whiskers (5th–95th percentile confidence intervals), line (median) in box and whisker plot in d.
Extended Data Figure 3
Extended Data Figure 3. Loss of Kctd13 reduces mEPSC frequency in somatosensory cortical layer 2/3 and mIPSC frequency in the hippocampus
a, b, Mean mEPSC frequency is decreased in somatosensory cortical layer 2/3 neurons from Kctd13 mutants and is represented by the right-shift in cumulative distribution of inter-event frequency; P = 0.0042 (WT n = 20/5 cells/mice; HET n = 20/6; KO n = 24/5). Scale bar, 10 pA, 100 ms. c, d, Mean cortical layer 2/3 neuron mEPSC amplitude and the cumulative distribution of mEPSC amplitudes were not affected by loss of Kctd13; P = 0.397 (WT n = 20/5 cells/mice; HET n = 20/6; KO n = 24/5). Scale bar, 2 pA, 5 ms. e, f, Mean mIPSC frequency is decreased in cortical layer 2/3 neurons from Kctd13 mutants and is represented by the right-shift in cumulative distribution of inter-event frequency; P = 0.041 (WT n = 20/5 cells/mice; HET n = 20/6; KO n = 24/5). Representative traces below. Scale bar, 20 pA, 1.5 s. g, h, Mean CA1 pyramidal neuron mIPSC amplitude and the cumulative distribution of mIPSC amplitudes were not affected by loss of Kctd13; P = 0.145 (WT n = 20/5 cells/mice; HET n = 20/6; KO n = 24/5). Box (interquartile range), whiskers (5th–95th percentile confidence intervals), line (median) in box and whisker plots. *P < 0.05, **P < 0.001.
Extended Data Figure 4
Extended Data Figure 4. Loss of Kctd13 has no effect on body weight, brain weight, or brain to body weight ratio
a, Body weight unchanged in 11- to 13-week-olds; P = 0.394 (WT n = 23 (11 male/12 female); HET n = 42 (25 male/17 female); KO n = 25 (14 male/11 female)). b, c, No difference in body weight grouped or divided by sex was observed among 11- to 13-week-old mice; (a) grouped body weight; P = 0.394; (b) female body weight; P = 0.6732; (c) male body weight; P = 0.240. d, Body weight is slightly decreased in Kctd13 mutants; P = 0.008 (WT n = 88 (40 male/48 female); HET n = 86 (28 male/58 female); KO n = 82 (36 male/46 female)). eg, Brain weight not affected in 11- to 14-week-olds; (e) grouped brain weight, P = 0.112 (WT n = 23 (11 male/12 female); HET n = 42 (25 male/17 female); KO n = 25 (14 male/11 female)); (f) female brain weight, P = 0.328; (g) male brain weight; P = 0.322. hj, No difference in the ratio of brain to body weight was observed among 11- to 14-week-old mice; (h) grouped ratio of brain to body weight; P = 0.2952; (i) female ratio of brain to body weight; P = 0.998620; (j) male ratio of brain to body weight; P = 0.128485. Same cohort and n values as in eg above. Box (interquartile range), whiskers (5th–95th percentile confidence intervals), line (median) in box and whisker plots.
Extended Data Figure 5
Extended Data Figure 5. Summary of regional brain volumes in Kctd13 mutant mice
a, P7 Kctd13 HET versus WT mice; 20 different coronal slices of the mouse brain. Highlighted on each slice is the effect size difference in areas that are larger (in orange/yellow) or smaller (in blue/cyan) when comparing relative volume differences between the Kctd13 (+/−, heterozygous) mice and WT. Note this is only highlighting trends as no significant differences were identified (WT n = 23 (11 male/12 female); HET n = 21 (11 male/10 female)). b, P7 Kctd13 KO versus WT mice; 20 different coronal slices of the mouse brain. Highlighted on each slice is the effect size difference in areas that are larger (in orange/yellow) or smaller (in blue/cyan) when comparing relative volume differences between the Kctd13 (−/−, homozygous) mouse and its corresponding WT. Note this is only highlighting trends as no significant differences were found. (WT n = 23 (11 male/12 female); KO n = 21 (11 male/10 female)). c, Total brain volume on MRI is unchanged in 7-week-old Kctd13 mutants; P = 0.225 (WT n = 23 (11 male/12 female); HET n = 21 (11 male/10 female); KO n = 21 (11 male/10 female)). d, Twelve-week-old Kctd13 HET versus WT mice; 20 different coronal slices of the mouse brain. Highlighted on each slice is the effect size difference in areas that are larger (in orange/yellow) or smaller (in blue/cyan) when comparing relative volume differences between the Kctd13 (+/−, heterozygous) mouse and its corresponding WT. Note this is only highlighting trends as no significant differences were found (WT n = 23 (13 male/10 female); HET n = 21 (11 male/10 female)). e, Twelve-week-old Kctd13 KO versus WT mice; 20 different coronal slices of the mouse brain. Highlighted on each slice is the effect size difference in areas that are larger (in orange/yellow) or smaller (in blue/cyan) when comparing relative volume differences between the Kctd13 (−/−, homozygous) mouse and its corresponding WT. Note this is only highlighting trends as no significant differences were found. (WT n = 23 (13 male/10 female); KO n = 23 (13 male/10 female)). f, Total brain volume on MRI is unchanged in 12-week-old Kctd13 mutants; P = 0.462 (WT n = 23 (13 male/10 female); HET n = 21 (11 male/10 female); KO n = 23 (13 male/10 female)). Values represent mean ± s.e.m.
Extended Data Figure 6
Extended Data Figure 6. Adult and embryonic cell proliferation representative images
a, Ki67 as a marker of proliferating cells. Representative serial sections from Ki67-stained Kctd13 WT/HET/KO 12-week-old adult tissue with arrowheads indicating examples of positive staining. b, Quantification of no changes in adult dentate gyrus cell proliferation (Ki67) in 12-week-olds; P = 0.737 (WT n = 8; HET n = 7; KO n = 5). c, Doublecortin as a marker of immature neurons. Representative serial sections from doublecortin-stained Kctd13 WT/HET/KO 12-week-old adult tissue. d, Quantification of no changes in adult dentate gyrus immature neurons (doublecortin) in 12-week-olds; P = 0.976 (WT n = 9; HET n = 11; KO n = 7). e, BrdU as a marker of newly born cell survival. Representative serial sections from BrdU-stained Kctd13 WT/HET/KO 12-week-old adult tissue with arrows indicating examples of positive staining. f, Quantification of no change in newborn neuron survival in adults; P = 0.458 (WT n = 8; HET n = 7; KO n = 5). Scale bar, 100 μm. All sections are 300 μm apart and all pictures were taken using a 10× objective lens. g, BrdU as a marker of embryonic stem cell proliferation. Representative serial sections from BrdU-stained Kctd13 WT/HET/KO E15.5 tissue. h, Ki67 as a marker of embryonic stem cell proliferation. Representative serial sections from Ki67 stained Kctd13 WT/HET/KO E15.5 tissue. All sections are 300 μm apart and all pictures were taken using a 10× objective lens. Scale bar, 100 μm. Values represent mean ± s.e.m.
Extended Data Figure 7
Extended Data Figure 7. Loss of Kctd13 does not affect cortical layer thickness or cell counts in P17 mice
a, b, No differences in Ctip2-stained cortical layer thickness (a) or cell counts (b) were observed in P17 mice; layer 5: P = 0.803 (WT n = 7; HET n = 8; KO n = 10); layer 6: P = 0.272 (WT n = 7; HET n = 8; KO n = 10). Cell count: P = 0.436 (WT n = 7; HET n = 8; KO n = 10). c, d, No differences in Cux1-stained cortical layer thickness (c) or cell counts (d) were observed in P17 mice; layer 2/3: P = 0.844 (WT n = 7; HET n = 9; KO n = 9); layer 4: P = 0.276 (WT n = 7; HET n = 9; KO n = 9). Cell count: P = 0.130 (WT n = 7; HET n = 9; KO n = 9). e, f, No differences in Tbr1-stained cortical layer thickness (e) or cell counts (f) were observed in P17 mice; layer 2/3: P = 0.230 (WT n = 7; HET n = 8; KO n = 10); layer 5: P = 0.353 (WT n = 7; HET n = 8; KO n = 10); layer 6: P = 0.616 (WT n = 7; HET n = 8; KO n = 10). Cell count: P = 0.260 (WT n = 7; HET n = 8; KO n = 10). g, No differences in Satb2-stained cortical layer cell counts were observed in P17 mice; P = 0.192 (WT n = 7; HET n = 8; KO n = 9). h, Total cortical thickness was unchanged among Kctd13 WT and mutant P17 mice; P = 0.284 (WT n = 7; HET n = 8; KO n = 9). i, Representative images of Kctd13 WT, HET, KO cortical Ctip2, Tbr1, and Satb2 triple stains; scale bar, 100 μm. j, Representative images of Kctd13 WT, HET, KO cortical Cux1 and DAPI co-stain; scale bar, 100 μm. Values represent mean ± s.e.m.
Extended Data Figure 8
Extended Data Figure 8. Loss of Kctd13 does not affect cortical layer thickness or cell counts in E15 embryos
a, b, No differences in Tbr1-stained cortical layer thickness (a) or cell counts (b) were observed in E15 pups; Tbr1 thickness: P = 0.893 (WT n = 7; HET n = 6 ; KO n = 5); cell count: P = 0.304 (WT n = 7; HET n = 6; KO n = 5). c, d, No differences in Tbr2-stained cortical layer thickness (c) or cell counts (d) were observed among Kctd13 WT and mutant E15 pups; TBR2 thickness: P = 0.543 (WT n = 6; HET n = 5; KO n = 3); cell count: P = 0.353 (WT n = 6; HET n = 5; KO n = 3). e, f, No differences in Tuj1-stained cortical layer thickness (e) or the intensity of staining (f) were observed among Kctd13 WT and mutant E15 pups; Tuj1 thickness: P = 0.428 (WT n = 7; HET n = 5; KO n = 6); Tuj1 intensity: P = 0.091 (WT n = 7; HET n = 5; KO n = 6). g, i, Representative images of Kctd13 WT, HET, KO cortical Tbr1, Tbr2, and Tuj1 with DAPI co-stain; scale bar, 50 μm. Values represent mean ± s.e.m.
Extended Data Figure 9
Extended Data Figure 9. Mammalian RhoA developmental profile reveals delay in RhoA increase; homozygous deletion of Kctd13 in zebrafish results in increased RhoA
a, Example maximum intensity projections of zebrafish larval (6 days after fertilization) brain immunofluorescence showing total Erk control protein (cyan, left) and RhoA protein (magenta, right). Images were registered to the Z-Brain total Erk-stained reference brain, using CMTK registration,. b, Maximum intensity z and x projections of RhoA immunofluorescence differences among KO, HET, and WT genotypes (WT n = 9; HET n = 7; KO n = 11), quantified using the approach described previously. RhoA levels were normalized to total Erk levels and the significance threshold for the false discovery rate was set to 0.0005%. Green represents increased RhoA in the first genotype compared with the second, whereas magenta represents decreased RhoA. The approach of registration and morphing antibody-stained images to find statistically significant differences in intensity will only yield approximations of the changes across brain regions, particularly when low numbers of fish (<20) are compared. c, Western blots of whole-brain lysates from Kctd13 adult (2–12 months) zebrafish mutants reveal increased total RhoA protein; P = 0.0389 (WT n = 12; HET n = 12; KO n = 12). d, Western blots of prefrontal cortex or hippocampal whole-cell lysates from Kctd13 mutant mice reveal increased RhoA protein at P18 and 4–6 weeks with no change in RhoA levels at E15 or P7; E15 P = 0.410 (WT n = 11; HET n = 16; KO n = 8); P7 P = 0.622 (WT n = 10; HET n = 14; KO n = 6); P18 P = 0.0243 (WT n = 11; HET n = 10; KO n = 11); 4–6 weeks P = 0.0069 (WT n = 14; HET n = 11; KO n = 7). Box (interquartile range), whiskers (5th–95th percentile confidence intervals), line (median) in box and whisker plots in c. Values represent mean ± s.e.m. in d.
Extended Data Figure 10
Extended Data Figure 10. Behavioural analysis of Kctd13 mutant mice
a, Locomotor activity as measured by the number of photobeam breaks during successive 5-min intervals over a 2 h period. Kctd13 KO mice show significantly increased locomotor activity over the full 2 h period; P = 0.012. b, Locomotor activity is expressed as the sum of total photobeam breaks during a 2 h session. Both Kctd13 HETs and KOs show significantly increased numbers of photobeam breaks; P = 0.012. c, d, Ratio of time (c) and entries (d) in the open arms versus time and entries in other arms in the elevated plus maze. No difference in time; P = 0.340 or entries to the open arms; P = 0.605 among the groups was observed. e, Time spent in dark side during the dark/light test. All the groups spent equal time in the dark chamber; P = 0.122. f, Time spent in the centre of the open field arena. No difference among the groups was observed; P = 0.606. g, Latency to fall in the rotarod task. No difference was found among the genotypes; P = 0.232. A main effect of sex was observed; P = 0.0001. The inserts show latency to fall separated by sex. h, Latency to lick the paw during the hotplate test. No difference in the latency was observed among the genotypes; P = 0.430. i, Latency to find food buried under the bedding. No difference in the time spent finding the food was detected among the genotypes; P = 0.145. j, k, Time spent grooming (j) and number of grooming episodes (k) during the 15 min grooming test. No difference was found among the genotypes; time P = 0.191; bouts P = 0.521. A main effect of sex was observed; time (j) P = 0.036; bouts (k) P = 0.027. The inserts show grooming test results in a sex-specific manner. l, Number of marbles buried during the 30 min marble-burying task. No difference was observed among genotypes; P = 0.105. m, Three-chamber sociability test results depicted as interaction time with inanimate object (an empty wire cup) versus social target (a mouse placed under the wire cup). No difference in interaction either with an inanimate object or with a target mouse was found among genotypes; P = 0.853. n, Sequential caged conspecific social interaction test results depicted as interaction time with an inanimate object (an empty plastic cage) alone and with a social (a plastic cage with a novel mouse) target alone; P = 0.494. No difference in interaction either with an inanimate object or with a target mouse was found among the genotypes, although a main effect of sex was observed; P = 0.005. The inserts show test results in a sex-specific manner. o, p, Height (o) and width (p) of nest built as a function of time in a nest-building task. No difference was observed among the genotypes; height P = 0.207; width P = 0.411. q, Time spent interacting with an object placed in a new location (Obj A) during the first, spatial trial of the novel object test. All groups interacted comparably with the familiar location objects (Obj C and Obj B) and showed similar preference for the object moved to a new location; P = 0.241. In addition, a main effect of sex was observed. The inserts show time spent interacting with objects in a sex-specific manner; P = 0.025. r, Time spent interacting with a novel object (Obj B was replaced by Obj novel) during the second trial of the novel object test. All groups interacted comparably with the familiar object (Obj C) and showed similar preference for the novel object; P = 0.414. s, Percentage of time spent freezing during the contextual fear-conditioning test. All genotypes showed equal freezing behaviour when exposed to the training context; P = 0.227. t, Percentage of time freezing during the cued fear-conditioning test. All genotypes showed the same freezing behaviour when exposed to the tone used during training; P = 0.490. u, Latency to reach a hidden platform on successive training days in the Morris water maze test. All genotypes reached the platform within the same time; P = 0.715. v, Swim speed on successive water maze training days. No change in speed among the groups was observed; P = 0.758. w, Time spent in the target and other quadrants during the probe trial in which the target platform was removed. All genotypes showed similar preference for the target quadrant versus other quadrants; P = 1.000. x, Latency to reach a visible platform in the visible platform portion of the water maze. All genotypes reached the visible platform within similar times; P = 0.391. y, Startle response after a pre-pulse at 72, 76, 80, and 84 dB, followed by a pulse at 120 dB. All genotypes show similar startle reflex during the test; P = 0.451. z, Initial startle amplitude in response to 120 db. No difference in response among the genotypes was observed; P = 0.617. *P < 0.05, **P < 0.01, ***P < 0.001. Animal numbers ranged as follows: WT n = 24–26; HET n = 19–22; KO n = 20–22. Box (interquartile range), whiskers (5th–95th percentile confidence intervals), line (median) all similar box and whisker plots. Inset values represent mean ± s.e.m. (See Supplementary Table 1 for animal numbers and detailed statistics.)
Figure 1
Figure 1. Kctd13 deletion reduces synaptic transmission in area CA1 of the hippocampus
a, Kctd13 deletion targeting strategy. b, Western blots against KCTD13 confirm loss from multiple brain regions; mean ± s.e.m., P < 0.000001 (hippocampus: WT n = 6 mice; HET n = 4; KO n = 4; cortex: WT n = 8; HET n = 4; KO n = 4; cerebellum: WT n = 6; HET n = 4; KO n = 4; midbrain: WT n = 6; HET n = 4; KO n = 4). c, Reverse transcriptase PCR confirms lack of Kctd13 mRNA. d, Kctd13 promoter activity via β-galactosidase staining. Scale bar, 50 μm. e, Input/output curves of stimulus intensity versus fEPSP slope in Kctd13 mutants; P = 0.002 (WT n = 19/6 slices/mice; HET n = 14/7; KO n = 20/6) plotted as mean ± s.e.m. for clarity. Scale bar, 0.25 mV, 5 ms. f, CA1 pyramidal neuron mEPSC amplitude (left) and cumulative distribution of mEPSC amplitudes (right); P = 0.867 (WT n = 26/9 cells/mice; HET n = 24/7; KO n = 30/8). Scale bar, 2 pA, 5 ms. g, mEPSC frequency in CA1 neurons from Kctd13 mutants (left), and right-shift in cumulative distribution of inter-event frequency (right); P = 0.0007 (WT n = 26/9 cells/mice; HET n = 24/7; KO n = 30/8). Scale bar, 20 pA, 200 ms. *P < 0.05, **P < 0.01, ***P ≤ 0.001. Box (interquartile range), whiskers (5th–95th percentile confidence intervals), line (median) in box and whisker plots.
Figure 2
Figure 2. Synaptic dysfunction in Kctd13 mutants associated with increased RhoA and rescued by RhoA inhibition
a, Western blots of hippocampi from Kctd13 mutants reveal increased RhoA; P = 0.007 (WT n = 14 mice; HET n = 11; KO n = 7). b, Decreased synaptic transmission replicated in vehicle-treated hippocampus; P = 0.024 (WT vehicle n = 18/6 slices/mice; HET vehicle n = 21/6; KO vehicle n = 19/6). Inset c, d: representative traces. Scale bar, 0.25 mV, 5 ms (be plotted as mean ± s.e.m. for clarity) c, Slice incubation for 3.5 h with rhosin (50 μM) reversed synaptic deficits in Kctd13 mutants; P = 0.005 (WT rhosin n = 18/5 slices/mice; HET rhosin n = 15/5; KO rhosin n = 20/6). d, Decreased synaptic transmission in Kctd13 mutants replicated in vehicle-treated slices; P = 0.001 (WT vehicle n = 27/10 slices/mice; KO vehicle n = 16/8). Inset: representative fEPSP traces. Scale bar, 0.25 mV, 5 ms. e, Slice incubation (3.5 h) with C3 (1 mg ml−1) reverses synaptic transmission deficits; NS, non-significant; P = 0.156 (WT C3 n = 24/10 slices/mice; KO C3 n = 16/8). Inset, representative fEPSP traces. Scale bar, 0.25 mV, 5 ms. f, Rhosin incubation reversed mEPSC frequency deficit (left), cumulative distribution of inter-event frequency (right); P = 0.016 (WT vehicle n = 12/4 cells/mice; KO vehicle n = 17/4; WT rhosin n = 17/4; KO rhosin n = 18/4). Inset: representative mEPSC traces. Scale bar, 25 pA, 200 ms. *P < 0.05, ***P < 0.001. Box (interquartile range), whiskers (5th–95th percentile confidence intervals), line (median) in box and whisker plots.
Figure 3
Figure 3. Deletion of Kctd13 or kctd13 does not affect brain size or neurogenesis in mice or zebrafish
a, b, Embryonic cell proliferation at E15.5 in mice (WT n = 6 mice; HET n = 5; KO n = 5) BrdU (a), P = 0.860; Ki67 (b), P = 0.757. c, No difference in cells double-labelled for BrdU and GFP in mice; P = 0.167 (WT n = 8 mice; HET n = 10; KO n = 12). Scale bar, 20 μm. d, Zebrafish head size not affected; P = 0.079 (WT n = 44 zebrafish; HET n = 93; KO n = 22). e, Phospho-histone H3 staining unchanged in zebrafish; P = 0.800 (WT n = 21 zebrafish; HET n = 36; KO n = 14). Values represent mean ± s.e.m. in ac. Box (interquartile range), whiskers (5th–95th percentile confidence intervals), line (median) in box and whisker plots in d, e.

References

    1. Kumar RA, et al. Recurrent 16p11.2 microdeletions in autism. Hum Mol Genet. 2008;17:628–638. - PubMed
    1. Weiss LA, et al. Association between microdeletion and microduplication at 16p11.2 and autism. N Engl J Med. 2008;358:667–675. - PubMed
    1. McCarthy SE, et al. Microduplications of 16p11.2 are associated with schizophrenia. Nat Genet. 2009;41:1223–1227. - PMC - PubMed
    1. Shinawi M, et al. Recurrent reciprocal 16p11.2 rearrangements associated with global developmental delay, behavioural problems, dysmorphism, epilepsy, and abnormal head size. J Med Genet. 2010;47:332–341. - PMC - PubMed
    1. Zufferey F, et al. A 600 kb deletion syndrome at 16p11.2 leads to energy imbalance and neuropsychiatric disorders. J Med Genet. 2012;49:660–668. - PMC - PubMed

Publication types

MeSH terms

Supplementary concepts