. 2017 Nov 9;551(7679):204-209.
doi: 10.1038/nature24282. Epub 2017 Nov 1.

Structures of transcription pre-initiation complex with TFIIH and Mediator

Affiliations

Structures of transcription pre-initiation complex with TFIIH and Mediator

S Schilbach et al. Nature. .

Abstract

For the initiation of transcription, RNA polymerase II (Pol II) assembles with general transcription factors on promoter DNA to form the pre-initiation complex (PIC). Here we report cryo-electron microscopy structures of the Saccharomyces cerevisiae PIC and PIC-core Mediator complex at nominal resolutions of 4.7 Å and 5.8 Å, respectively. The structures reveal transcription factor IIH (TFIIH), and suggest how the core and kinase TFIIH modules function in the opening of promoter DNA and the phosphorylation of Pol II, respectively. The TFIIH core subunit Ssl2 (a homologue of human XPB) is positioned on downstream DNA by the 'E-bridge' helix in TFIIE, consistent with TFIIE-stimulated DNA opening. The TFIIH kinase module subunit Tfb3 (MAT1 in human) anchors the kinase Kin28 (CDK7), which is mobile in the PIC but preferentially located between the Mediator hook and shoulder in the PIC-core Mediator complex. Open spaces between the Mediator head and middle modules may allow access of the kinase to its substrate, the C-terminal domain of Pol II.


Conflict of interest statement

The author declare that they have no competing financial interest.

Figures

Extended Data Figure 1
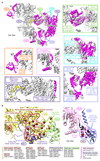
Extended Data Figure 1. Preparation of TFIIH and PIC-cMed complex.
a. Preparation of recombinant TFIIH. Analysis of purified TFIIH core and kinase modules by size exclusion chromatography and SDS-PAGE revealed high purity and homogeneity of the complexes with apparently stoichiometric subunits. SDS-PAGE analysis of fractions 1-13 of a sucrose gradient centrifugation after reconstitution of TFIIH from purified core and kinase modules. A shift of the bands originating from the subunits of the kinase module (Ccl1, Kin28 and Tfb3) by four fractions was detected, indicating formation of complete TFIIH. This experiment was repeated multiple times with equivalent results. b. Assembly of complexes. SDS-PAGE analysis of fractions 1-19 of 15-40% sucrose gradient centrifugations (Methods). Labeling of protein subunits according to the color scheme in Figs. 1 and 2. The analysis demonstrates successful formation of the cPIC, cPIC-cMed and PIC-cMed complexes (top to bottom). Bands originating from Pol II, cMed and TFIIH are shifted by several fractions, indicating formation of higher-order complexes. Subunits are present in apparently stoichiometric amounts. This experiment was repeated multiple times with equivalent results. c. Representative cryo-EM micrograph of PIC-cMed complex. A scale bar is provided. This experiment was repeated multiple times with equivalent results. d. 2D-class averages reveal 2D reconstructions from particles with clear signal for TFIIH and/or cMed adjacent to the centrally located Pol II density. A scale bar is provided.
Extended Data Figure 2
Extended Data Figure 2. Cryo-EM data processing and quality of the obtained reconstructions.
a. Particle sorting and classification tree used for 3D reconstruction of the PIC and PIC-cMed complex at nominal resolutions of 4.7 Å and 5.8 Å, respectively. The distinct branches of the classification tree (Methods) are highlighted in pink (PIC) and blue (PIC-cMed). In a conventional focused refinement approach in RELION,, the best-resolved PIC class was reconstructed with a local TFIIH mask, resulting in a focused map with a nominal resolution of 7.4 Å (green branch) that was not deposited. b. Two views of the final reconstructions of PIC and PIC-cMed colored according to local resolution. The color scheme is indicated. c. Fourier shell correlation (FSC) between half maps of the final reconstructions of PIC and PIC-cMed. Resolutions for the gold-standard FSC 0.143 criterion are listed. For comparison of distinct regions within PIC and PIC-cMed reconstructions, FSC 0.143 was additionally calculated utilizing local masks. d. Angular distribution plot for all particles in the final reconstructions of PIC and PIC-cMed. Color shading from blue to yellow correlates with the number of particles at a specific orientation as indicated.
Extended Data Figure 3
Extended Data Figure 3. EDC-crosslinking analysis of PIC-cMed.
a. EDC-derived inter-subunit crosslinks between selected subunits in the PIC-cMed complex. Observed crosslinks are consistent with the structure of the cPIC and with positions of previously reported BS3- and SBAT-crosslinks. Color code is indicated. b. EDC-crosslinks observed in TFIIH and between TFIIH and cPIC. Intra- and inter-subunit crosslinks are depicted as blue and black lines, respectively. Crosslinks between the TFIIE Tfa1 C-terminal region and Tfb1, Tfb2 and Ssl1 confirm interactions between TFIIE elements and TFIIH. c. Crosslinking hub of the Tfb1 N-terminal region. Ribbon representation of Tfb1 (residues 1-353, 369-394, 544-639) and the surrounding domains of Rad3, Ssl1 and Tfb4. BS3-/SBAT- and EDC-derived crosslinks are depicted in red and black, respectively. The displayed crosslinks aided modeling of the Tfb1 PHD, BSD1, BSD2 and Rad3 anchor domains into the cryo-EM density. d. Statistical analysis of EDC-derived crosslinks. Most observed crosslinks are within a cutoff Cα-distance of 16 Å. Cα-distances of up to 21 Å may be attributed to flexibility of the involved residues and the coordinate error of the model. Some outliers with Cα-distances of 22-30 Å were observed for the well-defined cPIC and Rad3 structures and may have originated from over-crosslinking of particles.
Extended Data Figure 4
Extended Data Figure 4. TFIIH structure and quality of the cryo-EM density.
a. Schematic of TFIIH subunit and domain architecture with bound dsDNA using the top view. Flexible linkers are depicted as black lines. Prominent helices within the folds of the tethering subunit Tfb1 and in Tfb2 are highlighted. b. Top view of the TFIIH structure in cylindrical representation. Prominent domains are labeled. The DNA register with respect to the putative transcription start site +1 is indicated. c. Overall fit of PIC structure into final WarpCraft PIC reconstruction. Observed density for a few remaining regions that could be clearly assigned but were not modeled are highlighted as indicated in Supplementary Data Table 1. d. Fit of cPIC structure into final WarpCraft PIC reconstruction at a higher contour level than in (c) shows the high resolution of the map in this region. e. Fit of TFIIH model into final WarpCraft PIC reconstruction. EM map reveals secondary structure throughout. Observed density for regions that could be clearly assigned but were not modeled are highlighted (compare Supplementary Data Table 1). f-k. EM density (black mesh) for domains and subunits of TFIIH reveals secondary structure throughout. Loops and linkers were traced when continuous density between unambiguously placed models was observed. Depicted density is part of either the WarpCraft PIC reconstruction or a focused reconstruction with a local mask on TFIIH core unless indicated otherwise. l. Cryo-EM reconstruction of the PIC reveals side chain density in well-ordered regions. Depicted are helical regions in the large Pol II subunit Rpb1. m. Fit of the PIC-cMed model into the final WarpCraft PIC-cMed reconstruction. Structures of cMed head and middle modules account for density within this region.
Extended Data Figure 5
Extended Data Figure 5. Location of mapped essential regions in TFIIH and sites mutated in disease.
a. TFIIH regions essential for cell viability in yeast. Mapping of TFIIH regions identified to be essential in S. cerevisiae by in vivo deletion analysis on the PIC structure revealed that they are generally forming well-ordered regions of the TFIIH core. Structures are viewed from the top (Fig. 1) with regions colored in magenta or yellow if their removal caused cell lethality or growth defects, respectively. Affected TFIIH subunits and ranges of deleted residues are highlighted in colors according to Fig. 3. For deletions exceeding the modeled residue range, the last modeled residue is indicated in parentheses. b. Mapping of human disease mutations onto the structures of Rad3 (human XPD) and Tfb5 (human p8). Reported mutations in Xeroderma pigmentosum, Trichothiodystrophy or Cockayne syndrome,, were included. The sites of point mutations are depicted as red spheres and Tfb5 truncations are colored in black. Color coding of TFIIH subunits as in Fig. 3. A list of yeast residues highlighted in the PIC structure is provided together with the corresponding human mutations in parentheses. Mutation sites are conserved. Rad3 mutations apparently interfere either with the stability and/or the function of the ATPase core or with the Rad3-Ssl1 interaction. Only few mutations target the FeS cluster or ARCH domain. Newly available data on the Rad3 anchor in Tfb1 suggest close proximity to at least four mutation sites that may affect the Rad3-Tfb1 interaction in this region. Tfb5 mutations either abolish Ssl2 binding or the formation of the dimerization domain with the Tfb2 C-terminus, resulting in destabilization of the Ssl2/Tfb2 region. If the clutch domains remain intact, however, a complete disruption of the Ssl2/Tfb2 interaction seems unlikely. We omitted Ssl2 from analysis as our structure does not cover the region in which reported mutations occur.
Extended Data Figure 6
Extended Data Figure 6. TFIIE-TFIIH interactions.
a. Tfb3-Pol II interaction. The TFIIH kinase module subunit Tfb3 (human MAT1) tethers Pol II and the TFIIH core together. Ribbon representation of the Tfb3 N-terminal RING-finger binding in a groove between the Pol II stalk subunit Rpb7 and the TFIIE E-linker helices. The RING-finger is linked to the ARCH anchor which binds the ARCH domain of Rad3. b. Secondary structure and conservation of TFIIE subunit Tfa1 as determined with CONSURF. Regions observed in the PIC and PIC-cMed structures are exceptionally well conserved throughout evolution. C-terminal residues with utilized crosslinks are indicated. c. E-dock. The predicted Tfa1 helix α7 is wedged between the TFIIE eWH domain situated on the Pol II clamp and the PHD of Tfb1 in the TFIIH core. α7 was not modeled due to weak density at the interface of the two major mobile parts of the PIC structure (cPIC and TFIIH) and due to the absence of crosslinks (Methods). The Tfb1 PHD is additionally contacted by the Tfa1 C-terminal acidic region. The identity and directionality of this acidic peptide were unambiguously established by crosslinking (Methods). d-e. E-bridge. This helix (α8) extends from the Tfb1 BSD2 domain at the center of the TFIIH crescent to the central β-sheet of the Ssl2 ATPase lobe 2. The C-terminal anchor peptide (dashed line) was not modeled into the density due to limited resolution. The identity and directionality of the E-bridge was unambiguously established by independent crosslinking experiments (Methods). f-g. E-floater. The Tfa1 helix α9 is positioned by the BSD1 domain of Tfb1 and located adjacent to the 3-helix bundle at the center of the TFIIH crescent. The identity and directionality of the E-floater was unambiguously established by independent crosslinking experiments (Methods).
Extended Data Figure 7
Extended Data Figure 7. Detailed analysis of Ssl2 ATPase conformation and implications for translocase activity.
a. Overview of PIC complex with highlighted Ssl2 (human XPB) ATPase lobes 1 and 2 (in pink and bordeaux, respectively) and interacting domains of Tfb2, Tfb5 and Tfa1. b. Detailed view on Ssl2 positioned on dsDNA in the presumed pre-translocation state. The ATP analogue AMP-PNP was present in the buffer but was not observed in the active site of the Ssl2 ATPase, supporting the model that we trapped the structure in the pre-translocation state. Register of covered nucleotides with respect to the TSS +1 is indicated. Highlighted helicase motifs were identified and assigned as described. Yellow colored motifs are involved in DNA interaction, purple motifs participate in NTP binding and hydrolysis and green motifs are involved in coupling of ATP hydrolysis to DNA binding. Both lobes of the ATPase contact both nucleic acid strands. The highlighted RED motif is essential and strictly conserved throughout the Ssl2/XPB family. c. Chd1 and Ssl2 ATPases are closely related on a structural level and share the same fold. The presumed post-translocation state of Ssl2 was modeled by separate alignment of ATPase lobe 1 and 2 to the respective lobes in the structure of Chd1 bound to an ATP analogue (PDB 5O9G); the presumed pre-translocated state was modeled vice versa using the Ssl2 structure as reference model. In both states, the structures overlap to a high degree. d. The Ssl2-DNA arrangement observed in the PIC structure resembles that of 3’-5’-directed rather than 5’-3’-directed members of the SF2 family. Superposition of the Ssl2-dsDNA structure with models of the NS3 (PDB 3KQK) and T. acidophilum (Tac) Rad3 (PDB 5H8W) ATPase domains reveals a closer resemblance of Ssl2 to the 3’-5’-helicase NS3. Additionally, the bound DNA fragment in the NS3 model aligned well to the dsDNA the in the Ssl2 structure whereas the bound fragment in the TacRad3 structure was positioned differently and did not exhibit a minor groove twist as observed for NS3 and Ssl2 in the respective position. e. Superposition of structures of TacRad3 and ScRad3 ATPase domains indicates very high level of structural homology. ATPase lobes 1 and 2 were superimposed separately to account for the absence of bound DNA in the ScRad3 structure. f. Putative movement of E-bridge and the Tfb2-Tfb5 dimerization domain upon Ssl2 transition from the presumed pre- to the presumed post-translocated state (grey and color, respectively). Upon movement of lobe 2, the E-bridge may undergo a rotation-translation movement towards Pol II and against its own trajectory onto the central β-ribbon of Ssl2 ATPase lobe 2. The flexible Tfb2-Tfb5 dimerization domain would swing towards Pol II.
Extended Data Figure 8
Extended Data Figure 8. Structure and conformational changes of core Mediator (cMed).
a. Schematic representation of cMed subunits. Regions contributing to submodules are colored as in the Sp cMed crystal structure. Solid and dashed black lines refer to protein regions that were modeled as atomic or backbone models, respectively. b. Ribbon model of cMed colored by type of structural model used for interpreting the cryo-EM density. Regions with backbone models based on the Sp cMed structure, regions with atomic models inclusive of the PDB code, and de-novo modeled regions are indicated in grey, orange and blue, respectively. c. Repositioning of the cMed middle module upon PIC binding. The structures of unbound cMed (khaki, PDB 5N9J) and PIC-cMed complex (blue, this study) were superimposed on the cMed head module. The positions of the cMed middle module domains hook, knob, connector, plank and beam apparently undergo conformational changes upon PIC binding, as indicated by arrows. This may cause or enlarge two observed openings at the head-middle interface. d. PIC-cMed interactions. Structure of the PIC-cMed complex in two views. The three previously identified interfaces between cPIC and cMed are indicated. In interface A the Mediator movable jaw (light blue) contacts the Pol II Rpb3-Rpb11 heterodimer (red/yellow), dock domain (beige) and the TFIIB B-ribbon (green). In interface B the Mediator spine domain (green) contacts helix H* of the Pol II stalk subunit Rpb4 (blue) with its Med22 helix H1, and the Mediator arm domain (violet) contacts Rpb4 with its Med8 helices H1 and H2. In interface C the Mediator plank domain (pink) contacts the Pol II foot region (cyan) with its Med9 helix H2. Two newly observed EDC-crosslinks between Med9 helix H2 and the Pol II foot domain are indicated by black spheres. e. Mediator head-middle module interfaces. In the unbound Sp cMed X-ray structure, four interfaces (I-IV) were observed between the head and middle modules. Due to stretching of the beam, interfaces I and II are altered in the PIC-bound cMed structure. In the new conformation the Med4 C-terminal region in the Mediator knob is flexible and does not contact the spine region. Interface IV between the shoulder and hook domains is lost. Mediator domains are colored as in panel (a).
Figure 1
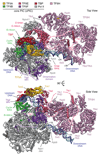
Figure 1. Structure of Pol II pre-initiation complex (PIC).
Two views of the yeast PIC cryo-EM structure. The DNA template and non-template strands are in dark and light blue, respectively. Positions of TFIIH subunits are indicated. Dashes lines represent flexible linkers in TFIIE and TFIIF. The color code is used throughout.
Figure 2
Figure 2. Structure of PIC-core Mediator (PIC-cMed) complex.
Two views of the PIC-cMed cryo-EM structure. The first view is rotated by 180º compared to the top view in Fig. 1. The second view is obtained by a 120º rotation around a horizontal axis. Mediator submodules in the head (blue) and middle modules (cyan) are indicated.
Figure 3
Figure 3. Structure of TFIIH.
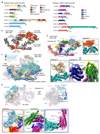
a. Domain organization of yeast TFIIH subunits except Kin28 (CDK7) and Ccl1 (CyclinH). Names of corresponding human subunits are in parenthesis. Residue numbers are given for domain borders. Color saturation scales with the percentage of residues modeled as atomic or backbone structures (solid and dashed black bars, respectively). b. TFIIH structure in cylindrical representation viewed from the side (Fig. 1). The DNA register with respect to the putative transcription start site +1 is indicated.
Figure 4
Figure 4. Interactions of TFIIH with core PIC (cPIC).
a.Domain organization of TFIIE subunit Tfa1 (human TFIIEα) including the previously unassigned helices α7 (E-dock), α8 (E-bridge) and α9 (E-floater). Solid and dashed black bars refer to protein residues modeled as atomic or backbone structures, respectively. b. TFIIH-cPIC interactions. PIC is viewed from the top (Fig. 1). Regions involved in the formation of the four interfaces are encircled. The color code of cPIC and TFIIH subunits highlights components participating in the interaction.
Figure 5
Figure 5. TFIIH and DNA opening.
a. Schematic cross-section of the PIC with open and closed DNA viewed from the side. PIC elements involved in DNA opening are depicted. Color coding as in Fig. 1 except for Ssl2 (human XPB) lobe 1 (pink) and lobe 2 (bordeaux). The Ssl2 ATPase translocates to the right and DNA moves to the left during DNA opening. b. Putative ratcheting of lobe 2 in the Ssl2 ATPase with respect to lobe 1. The PIC structure reveals the pre-translocation conformation (no ATP bound). The post-translocation conformation of lobe 2 was modeled by superposition of Chd1 (PDB 5O9G). Helicase motifs are indicated (Extended Data Fig. 7).
Figure 6
Figure 6. TFIIH and Pol II phosphorylation.
a. PIC-cMed structure as in Fig. 2 but with additional cryo-EM density for the mobile TFIIH Kin28-Ccl1 (human CDK7-CycH) kinase-cyclin pair (orange, filtered to 15 Å). An orange sphere depicts the last modeled residue in the Tfb3 linker to the kinase-cyclin pair. A black sphere depicts the last ordered residue in the Rpb1 linker to the CTD. Red spheres depict Med19 residues that crosslink to the CTD C-terminal end. Two openings at the Mediator head-middle interface are indicated with filled red circles. b. The same structure viewed from the front into the cradle between Pol II and Mediator (red outline). A model for the kinase-cyclin pair is shown for size comparison in an arbitrary position.

References

    1. Roeder RG. The role of general initiation factors in transcription by RNA polymerase II. Trends Biochem Sci. 1996;21:327–335. - PubMed
    1. Kornberg RD. Mediator and the mechanism of transcriptional activation. Trends Biochem Sci. 2005;30:235–239. doi: 10.1016/j.tibs.2005.03.011. - DOI - PubMed
    1. Takagi Y, Kornberg RD. Mediator as a general transcription factor. J Biol Chem. 2006;281:80–89. doi: 10.1074/jbc.M508253200. - DOI - PubMed
    1. Plaschka C, et al. Architecture of the RNA polymerase II-Mediator core initiation complex. Nature. 2015;518:376–380. doi: 10.1038/nature14229. - DOI - PubMed
    1. Nozawa K, Schneider TR, Cramer P. Core Mediator structure at 3.4 A extends model of transcription initiation complex. Nature. 2017;545:248–251. doi: 10.1038/nature22328. - DOI - PubMed

Publication types

MeSH terms