. 2017 May 10;8(43):73826-73836.
doi: 10.18632/oncotarget.17764. eCollection 2017 Sep 26.

Identification and validation of a prognostic 9-genes expression signature for gastric cancer

Affiliations

Identification and validation of a prognostic 9-genes expression signature for gastric cancer

Zhiqiang Wang et al. Oncotarget. .

Abstract

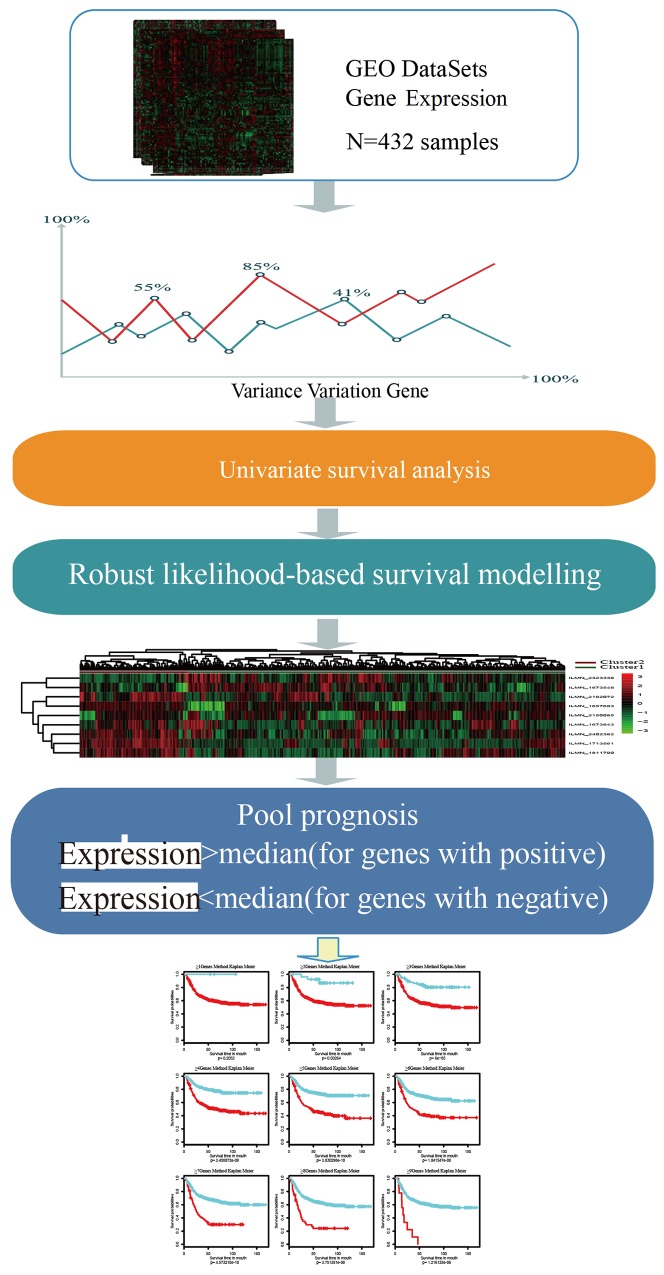
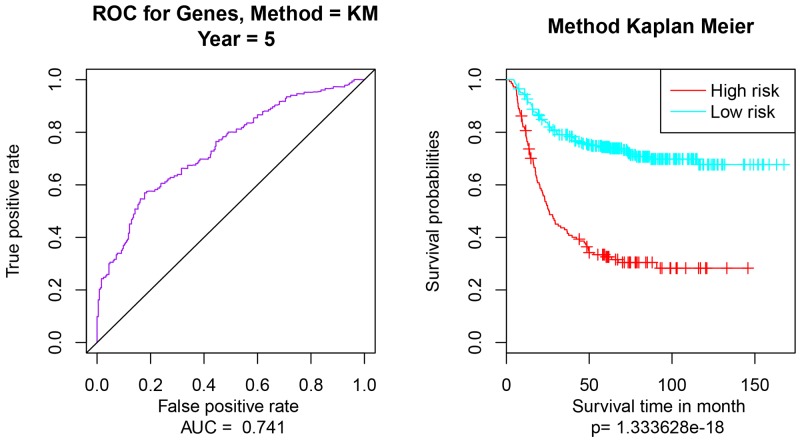
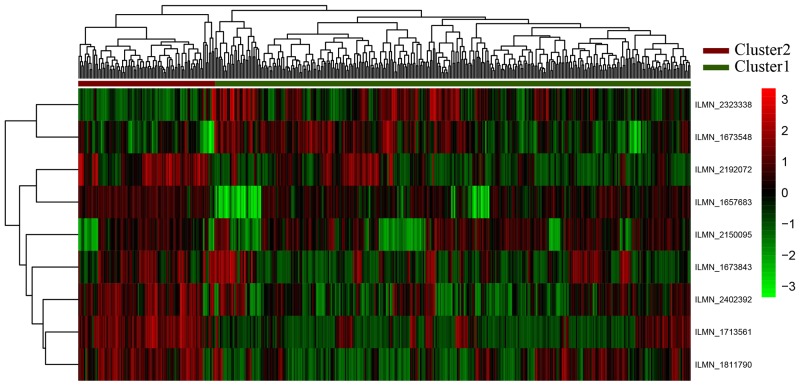
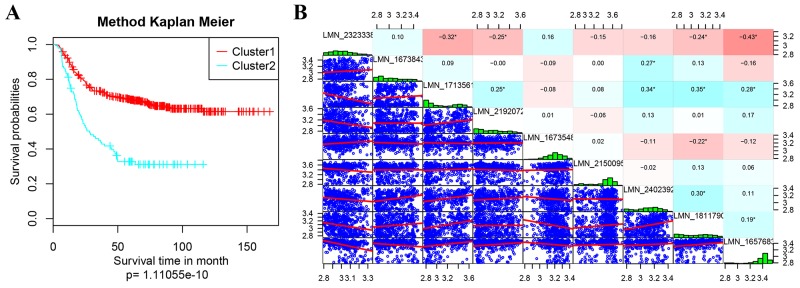
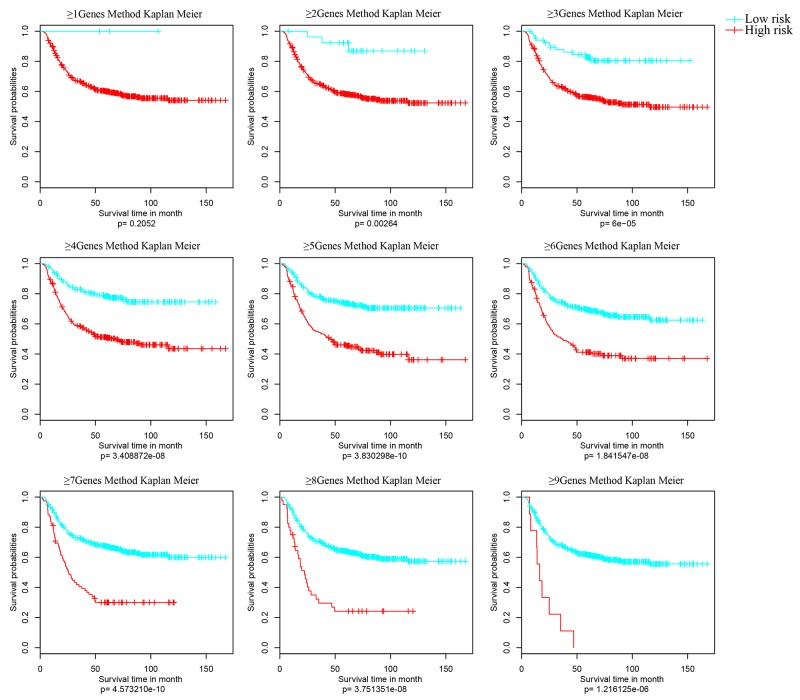
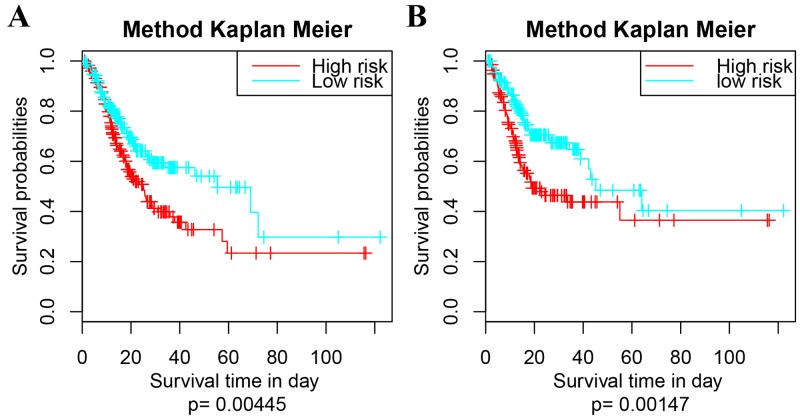
Gastric cancer (GC) is a common malignant tumor with high incidence and mortality. Reasonable assessment of prognosis is essential to improve the outcomes of patients. In this study, we constructed and validated a prognostic gene model to evaluate the risks of GC patients. To identify the differentially expressed genes between GC patients and controls, we extracted Gene expression profiles of GC patients (N=432) from Gene Expression Omnibus database and then stable signature genes by using Robust likelihood-based modeling with 1000 iterations. Unsupervised hierarchical clustering of all samples was performed basing on the characteristics of gene expressions. Meanwhile, the differences between the clusters were analyzed by Kaplan Meier survival analysis. A 9-genes model was obtained (frequency = 999; p=1.333628e-18), including two negative impact factors (NR1I2 and LGALSL) and 7 positive ones (C1ORF198, CST2, LAMP5, FOXS1, CES1P1, MMP7 and COL8A1). This model was verified in single factor survival analysis (p=0.004447558) and significant analysis with recurrence time (p=0.001474831) by using independent datasets from TCGA. The constructed 9-genes model was stable and effective, which might serve as prognostic signature to predict the survival of GC patients and monitor the long-term treatment of GC.

Keywords: clustering analysis; gastric cancer; prognostic model; survival analysis.


Conflict of interest statement

CONFLICTS OF INTEREST The author(s) declare no competing financial interests.

Figures

Figure 1
Figure 1. Schematic diagram for a multi-step strategy to identify gene signature for prognosis in gastric cancer
Robust likelihood-based survival model with 1000 iterations were constructed for selection of stable feature. After that, genes were defined as positive-impacting factors with expression higher than median (genes with positive) and negative-impacting factors with expression lower than median (genes with negative). This process is basing on the expressing patterns in the clustering analysis to go on with survival analysis.
Figure 2
Figure 2. Multivariate survival analysis of 9-gene feature
(A) the AUC curve for 9 genes, AUC = 0.741; (B) Kaplan Meier survival analysis of the high risk and low risk samples. The applied method is Kaplan Meier (Method = KM).
Figure 3
Figure 3. Clustering analyses for nine genes
The horizontal axis above represents the samples, using Euclidean distance; The vertical right axis is the feature gene with Pearson correlation coefficient. According to the first sample categorical attribute in the spreadsheet, the samples could be grouped into two clusters. The “high risk of GC” are shown as red (Cluster 1) and the “Normal” samples are shown as green (Cluster 2).
Figure 4
Figure 4. Kaplan Meier survival analyses on the prognostic differences
(A) Kaplan Meier survival analyses of Cluster1 and Cluster2; (B) expression correlation analyses of 9 feature genes. In B, the diagonal were expression distribution histogram of each genes with the name marked in its rectangular box; the lower left corner is the gene expression level of the scatter diagram between two corresponding genes; the upper right corner part is the correlation coefficient of every two genes, the red represents the correlation coefficient -1, the blue represents the correlation coefficient +1;.
Figure 5
Figure 5. Kaplan Meier survival analyses of different clusters
Samples were grouped basing on the activated impact factors of every sample (≥1, ≥2, ≥3, ≥4,…>9) into high risk (curve in red) and low risk (curve in blue). And significant p value of the corresponding cluster was obtained in Kaplan Meier univariate survival analysis. The survival time is calculated by month. The threshold is p value < 0.05.
Figure 6
Figure 6. Survival analysis of the extra dataset following the 9-5Gene model
(A) Kaplan Meier univariate survival analysis on survival time, p = 0.00445; (B) Kaplan Meier univariate survival analysis on re-occurrence risk, p = 0.00147. The survival time is calculated by day. The threshold is p value < 0.05.

References

    1. Ferro A, Peleteiro B, Malvezzi M, Bosetti C, Bertuccio P, Levi F, Negri E, Vecchia CL, Lunet N. Worldwide trends in gastric cancer mortality (1980–2011), with predictions to 2015, and incidence by subtype. Eur J Cancer. 2014;50:1330–1344. - PubMed
    1. WHO (2008). Cancer Control: Knowledge Into Action: World Health Organization.
    1. Wei J, Wu ND, Liu BR. Regional but fatal: intraperitoneal metastasis in gastric cancer. World J Gastroenterol. 2016;22:7478–7485. - PMC - PubMed
    1. Sant M, Allemani C, Santaquilani M, Knijn A, Marchesi F, Capocaccia R. EUROCARE-4. Survival of cancer patients diagnosed in 1995–1999. Results and commentary. Eur J Cancer. 2009;45:931–991. - PubMed
    1. Zeng WJ, Hu WQ, Wang LW, Yan SG, Li JD, Zhao HL, Peng CW, Yang GF, Li Y. Long term follow up and retrospective study on 533 gastric cancer cases. BMC Surg. 2014;14:1–8. - PMC - PubMed

LinkOut - more resources