. 2017 May 22;8(43):73947-73963.
doi: 10.18632/oncotarget.18166. eCollection 2017 Sep 26.

Combined inhibition of AKT and HSF1 suppresses breast cancer stem cells and tumor growth

Affiliations

Combined inhibition of AKT and HSF1 suppresses breast cancer stem cells and tumor growth

Richard L Carpenter et al. Oncotarget. .

Abstract

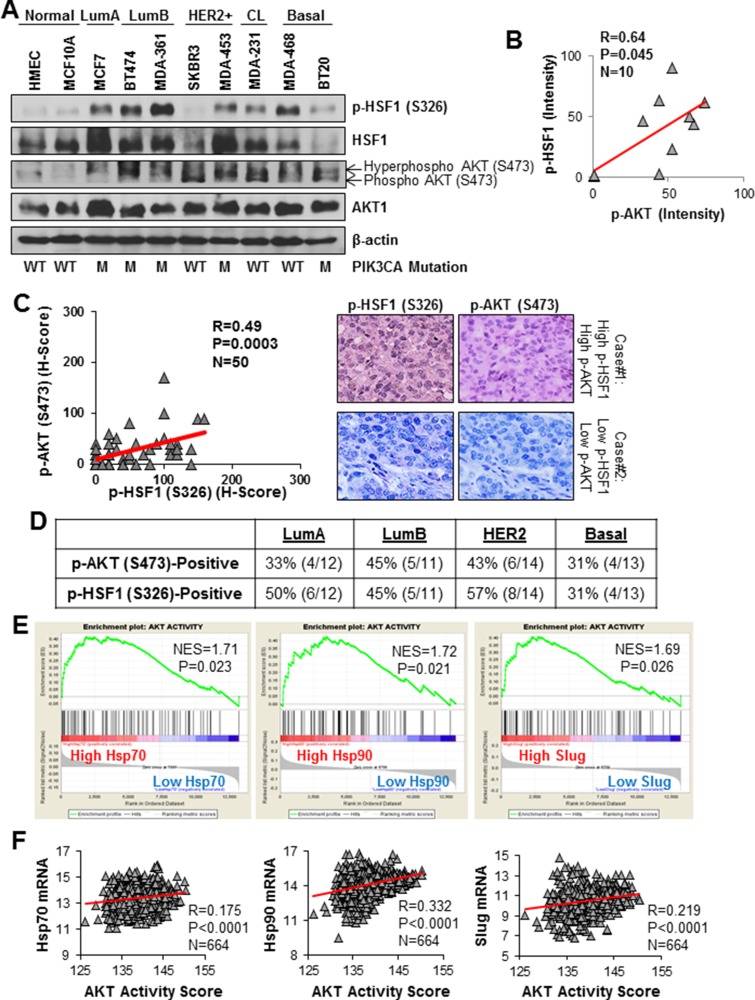
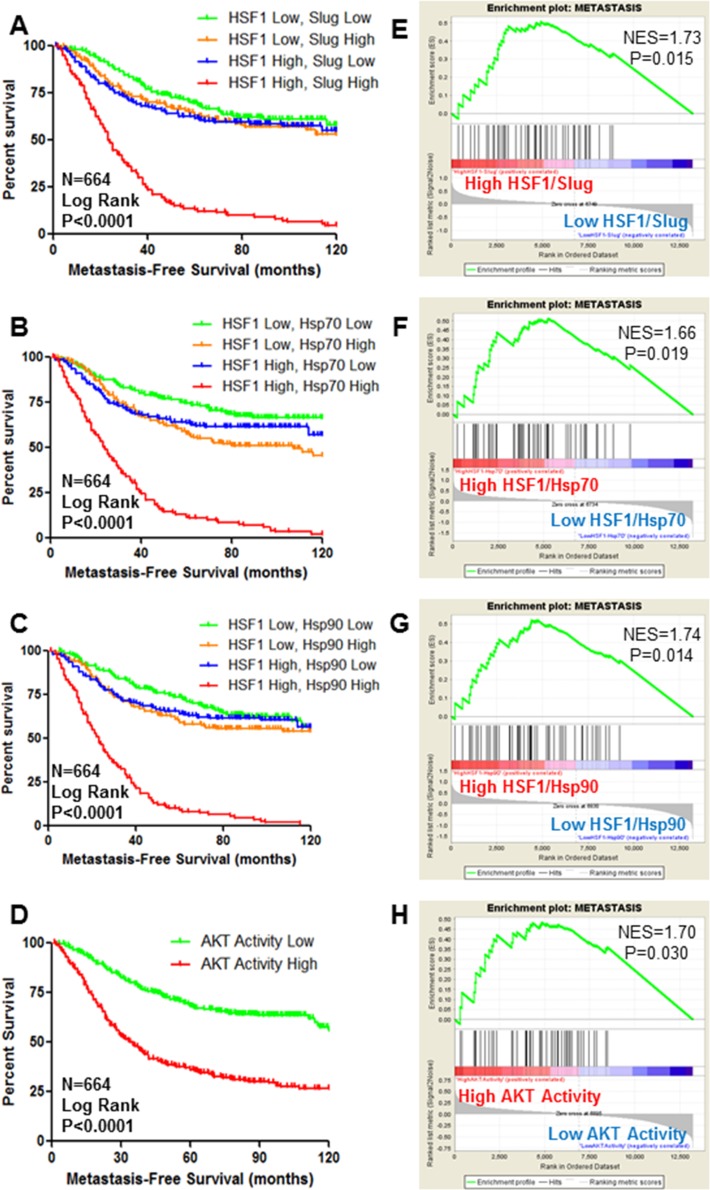
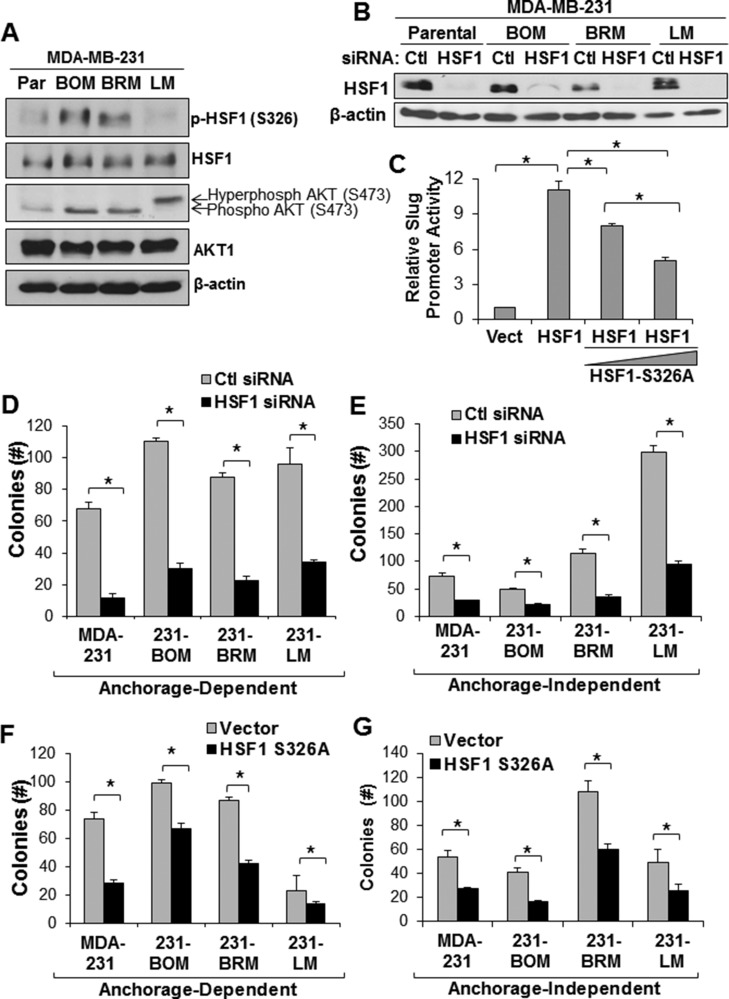
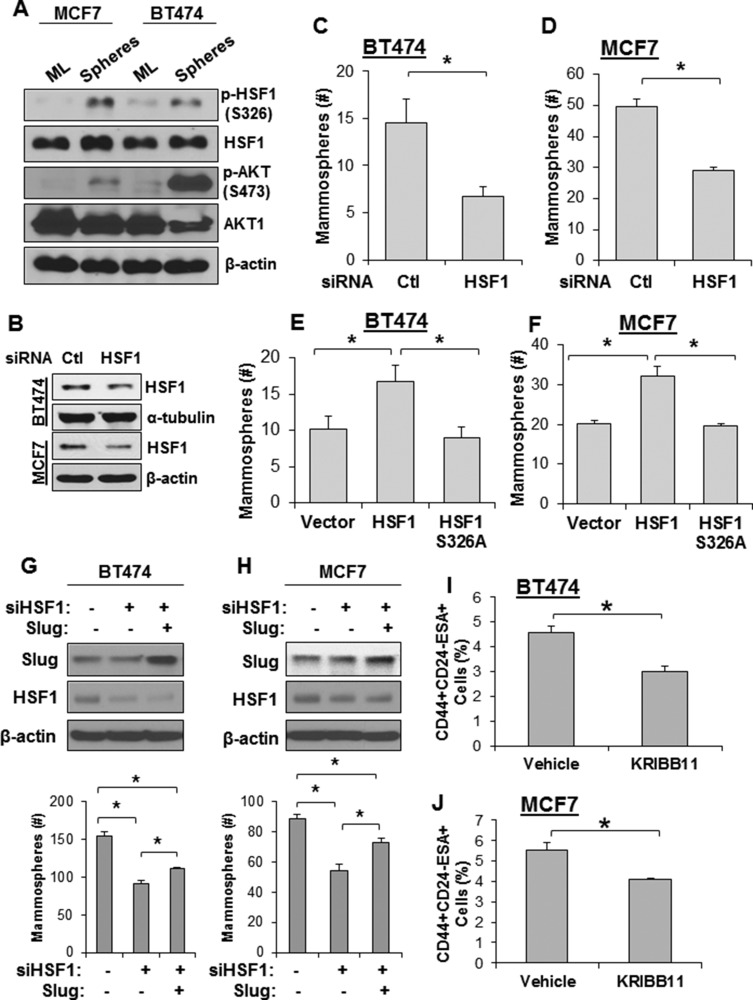
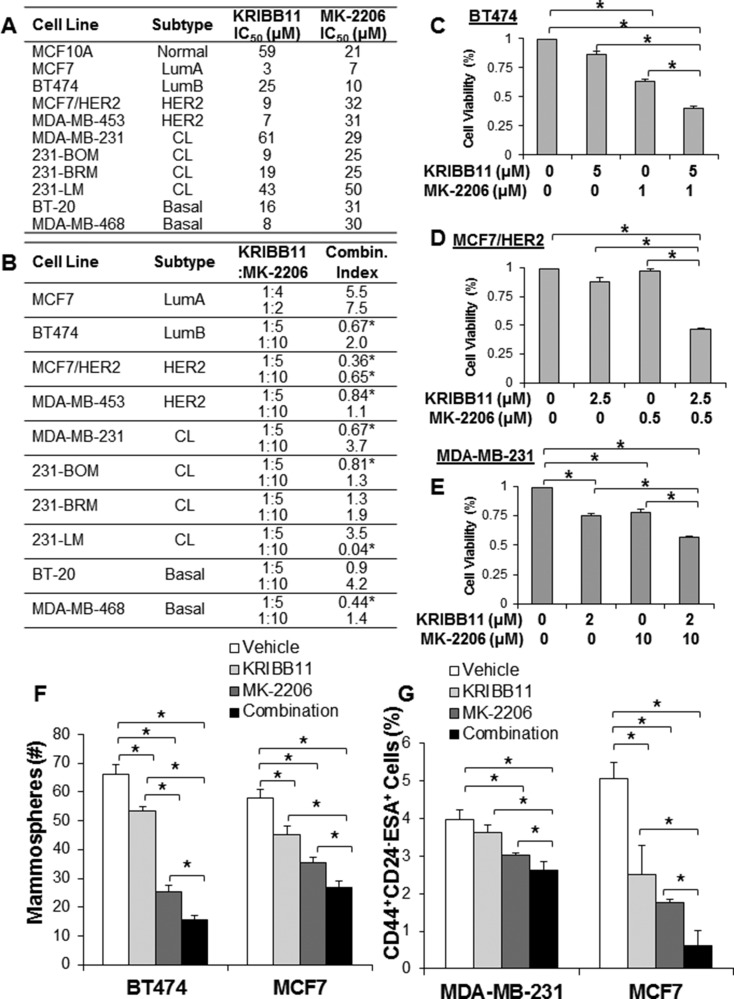
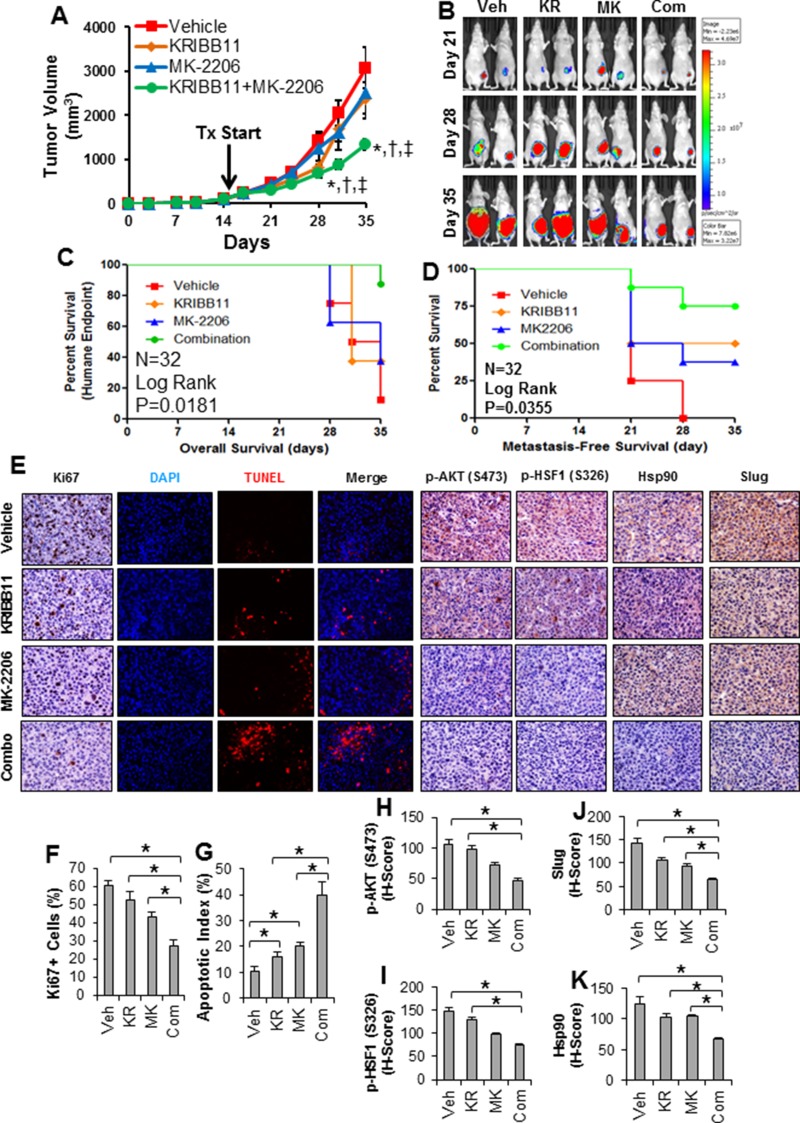
Breast cancer is the most common cancer in women and the second leading cause of cancer deaths in women. Over 90% of breast cancer deaths are attributable to metastasis. Our lab has recently reported that AKT activates heat shock factor 1 (HSF1), leading to epithelial-to-mesenchymal transition in HER2-positive breast cancer. However, it is unknown whether the AKT-HSF1 pathway plays an important role in other breast cancer subtypes, breast cancer stem cells, or breast cancer growth and metastasis. Herein, we showed AKT and HSF1 to be frequently co-activated in breast cancer cell lines and specimens across different subtypes. Activated AKT (S473) and HSF1 (S326) are strongly associated with shortened time to metastasis. Inhibition of the AKT-HSF1 signaling axis using small molecule inhibitors, HSF1 knockdown or the dominant-negative HSF1 mutant (S326A) reduced the growth of metastatic breast cancer cells and breast cancer stem cells. The combination of small molecule inhibitors targeting AKT (MK-2206) and HSF1 (KRIBB11) resulted in synergistic killing of breast cancer cells and breast cancer stem cells across different molecular subtypes. Using an orthotopic xenograft mouse model, we found that combined targeting of AKT and HSF1 to significantly reduce tumor growth, induce tumor apoptosis, delay time to metastasis, and prolong host survival. Taken together, our results indicate AKT-HSF1 signaling mediates breast cancer stem cells self-renewal, tumor growth and metastasis, and that dual targeting of AKT and HSF1 resulted in synergistic suppression of breast cancer progression thereby supporting future testing of AKT-HSF1 combination therapy for breast cancer patients.

Keywords: AKT; HSF1; KRIBB11; MK-2206; stem cells.


Conflict of interest statement

CONFLICTS OF INTEREST The authors have no conflicts of interest to declare.

Figures

Figure 1
Figure 1. HSF1 and AKT are co-activated in multiple breast cancer subtypes
(A) Lysates from the indicated cell lines were subjected to immunoblotting with the indicated antibodies. (B) p-HSF1 and p-AKT bands from (A) were quantified by ImageJ and correlated using Pearson correlation. (C) A cohort of 50 breast tumors was subjected to immunohistochemistry for the indicated antibodies. H-scores were calculated as described in the Materials and Methods and the scores for p-HSF1 (S326) and p-AKT (S473) were analyzed with Pearson correlation. (D) Table below is count of tumors within the cohort (n = 50) that were positive for p-AKT (S473) and p-HSF1 (S326) across breast cancer subtypes. (E) Gene set enrichment analysis (GSEA) was performed as described in Materials and Methods using a gene signature for AKT activity. The expression database contained 664 breast cancer patients publicly available from GEO. (F) Using the same database from (D), AKT activity score was calculated using the same signature from (E) and was correlated with Hsp70, Hsp90, and Slug.
Figure 2
Figure 2. HSF1 and AKT activity are predictors of metastasis-free survival of breast cancer
(AD) Using publicly-available datasets, Kaplan–Meier curves were drawn by stratifying breast cancer patients (n = 664) based on high or low expression of HSF1 along with high or low expression of HSF1 target genes Slug (A), Hsp70 (B), or Hsp90 (C) to indicate patients with high HSF1 activity and patients were also stratified by high or low AKT activity (D). Log rank test was used to determine significant differences in metastasis-free survival. (EH) Gene set enrichment analysis was performed using a previously published signature for solid tumor metastasis. Patients were stratified as they were in (A–D), respectively.
Figure 3
Figure 3. Loss of HSF1 activity reduces growth of metastatic breast cancer cells
(A) Lysates from MDA-MB-231 parental and metastatic cell lines were subjected to immunoblotting with indicated antibodies. (B) Cells were transfected with control or HSF1 siRNA followed by immunoblotting. (C) MCF7 cells were transfected with empty vector, HSF1, or HSF1 + HSF1-S326A followed by luciferase assay using a Slug promoter reporter. (DE) Cells with and without HSF1 knockdown from (B) were subjected to anchorage-dependent (D) or anchorage-independent (E) colony assays. (FG) Cells were transfected with empty vector or HSF1-S326A followed by anchorage-dependent (F) or anchorage-independent (G) colony assays. *Indicates significant difference (p < 0.05).
Figure 4
Figure 4. Loss of HSF1 activity reduces growth of mammospheres and breast cancer stem cells
(A) MCF7 and BT474 cells were seeded for the mammosphere assay as described in Materials and Methods. Spheres were collected and total protein was isolated. Sphere lysates and lysates from monolayer (ML) cells were subjected to immunoblotting using the indicated antibodies. (B) Cells were transfected with control or HSF1 siRNA followed by immunoblotting. (CD) BT474 and MCF7 cells with and without HSF1 knockdown from (B) were seeded for the mammosphere assay. (EF) BT474 and MCF7 cells were transfected with an empty vector, HSF1, or HSF1-S326A followed by seeding for the mammosphere assay. (GH) BT474 and MCF7 cells were transfected with non-targeting siRNA + an empty vector, HSF1 siRNA + empty vector, or HSF1 siRNA + Slug followed by seeding for the mammosphere assay. (IJ) BT474 (G) and MCF7 (H) were treated with KRIBB11 (5 µM) for 24 hrs and then subjected to flow cytometry for the CD44highCD24lowESAhigh cell population and the percentage of cells in the population is reported. *Indicates significant difference (p < 0.05).
Figure 5
Figure 5. Combined inhibition of HSF1 and AKT synergistically kills breast cancer cells of different subtypes
(A) Indicated cell lines were treated with KRIBB11 or MK-2206 for 48 hrs followed by assessment of cell viability to determine the IC50 for both inhibitors. (B) Indicated cell lines were treated with vehicle, KRIBB11 alone, MK-2206 alone, or both KRIBB11 and MK-2206 in combination at the indicated drug molar ratios for 48 hrs followed by assessment of cell viability. Combination index was calculated using Calcusyn software. (CE) Representative individual viability assay results from (B) for indicated cell lines. F-G) BT474 and MCF7 cells were treated with vehicle, KRIBB11 alone (BT474: 2 µM; MCF7: 10 µM), MK-2206 alone (BT474: 2 µM; MCF7: 8 µM), or both KRIBB11 and MK-2206. After 48 hrs of treatment on adherent plates, cells were trypsinized, counted and subjected to the mammosphere assay (F) or flow cytometry (G) to detect the tumor initiating cell population. *Indicates significant difference (p < 0.05).
Figure 6
Figure 6. Combination of HSF1 and AKT inhibition reduces growth and metastasis of triple-negative breast cancer in vivo
(A) Nude mice were subjected to mammary fat pad implantation of 1 × 10⁵ MDA-MB-231 cells and once tumors reached 102.9 ± 8.4 mm3 (day 15) mice were randomized to vehicle, KRIBB11 alone, MK-2206 alone, or KRIBB11+MK-2206 (n = 8 mice/grp). Tumor volume was measured twice per week. Significant differences were determined by ANOVA. *Indicates significant difference compared to vehicle (p < 0.05). †Indicates significant difference compared to KRIBB11 alone (p < 0.05). ‡Indicates significant difference compared to MK-2206 alone (p < 0.05). (B) In vivo luciferase imaging of representative tumors throughout the treatment period. (C) Kaplan–Meier curve was generated from overall survival (or reaching of the humane endpoint of 1500 mm3 tumor volume) of mice throughout the experiment. Trend significance was determined using the Log Rank test. (D) Kaplan–Meier curve was generated based on time to metastasis as determined by isolated luciferase imaging of the mice upper body. Significance was determined using the Log Rank test. (E) Formalin-fixed and paraffin-embedded tumors from each treatment group were subjected to IHC for Ki67, p-AKT (S473), p-HSF1 (S326), Hsp90, Slug, and TUNEL assay. Displayed are representative images from each treatment group for each antibody, DAPI, TUNEL, and DAPI-TUNEL merged. (F) Quantification of the percentage of Ki67+ cells in each treatment group (n = 8/grp). (G) Quantification of apoptotic index for each treatment group. (HK) H-scores of IHC were determined for each treatment group for p-AKT (H), p-HSF1 (I), Slug (J), and Hsp90 (K). Veh=vehicle; KR=KRIBB11; MK=MK-2206; Com=Combination.

References

    1. ACS. Cancer Facts & Figures 2015. 2015. Atlanta.
    1. Hanahan D, Weinberg RA. Hallmarks of cancer: the next generation. Cell. 2011;144:646–674. - PubMed
    1. Vydra N, Toma A, Widlak W. Pleiotropic role of HSF1 in neoplastic transformation. Curr Cancer Drug Targets. 2014;14:144–155. - PMC - PubMed
    1. Carpenter RL, Paw I, Dewhirst MW, Lo HW. Akt phosphorylates and activates HSF-1 independent of heat shock, leading to Slug overexpression and epithelial-mesenchymal transition (EMT) of HER2-overexpressing breast cancer cells. Oncogene. 2015;34:546–557. - PMC - PubMed
    1. Cen H, Zheng S, Fang YM, Tang XP, Dong Q. Induction of HSF1 expression is associated with sporadic colorectal cancer. World J Gastroenterol. 2004;10:3122–3126. - PMC - PubMed