. 2017 Jun 27;8(43):74019-74035.
doi: 10.18632/oncotarget.18630. eCollection 2017 Sep 26.

Neuropilin-1 is a glial cell line-derived neurotrophic factor receptor in glioblastoma

Affiliations

Neuropilin-1 is a glial cell line-derived neurotrophic factor receptor in glioblastoma

Shen Sun et al. Oncotarget. .

Abstract

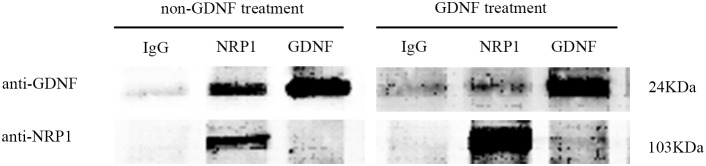
The aim of this study was to identify the receptor for glial cell line-derived neurotrophic factor (GDNF) in glioblastoma multiforme (GBM). After GST pull-down assays, membrane proteins purified from C6 rat glioma cells were subjected to liquid chromatography-tandem mass spectrometry (LC-MS/MS). The differentially expressed proteins were annotated using Gene Ontology, and neuropilin-1 (NRP1) was identified as the putative GDNF receptor in glioma. NRP1 was more highly expressed in human GBM brains and C6 rat glioma cells than in normal human brains or primary rat astrocytes. Immunofluorescence staining showed that NRP1 was recruited to the membrane by GDNF, and NRP1 co-immunoprecipitated with GDNF. Using the NRP1 and GDNF protein structures to assess molecular docking in the ZDOCK server and visualization with the PyMOL Molecular Graphics System revealed 8 H-bonds and stable positive and negative electrostatic interactions between NRP1 and GDNF. RNAi knockdown of NRP1 reduced proliferation of C6 glioma cells when stimulated with GDNF. NRP1 was an independent risk factor for both survival and recurrence in GBM patients. High NRP1 mRNA expression correlated with shorter OS and DFS (OS: χ2=4.6720, P=0.0307; DFS: χ2=11.013, P=0.0009). NRP1 is thus a GDNF receptor in glioma cells and a potential therapeutic target.

Keywords: cell proliferation; glial cell line-derived neurotrophic factor; glioblastoma; membrane receptor; neuropilin-1.


Figures

Figure 1
Figure 1. Western blot analysis of membrane proteins purification
(A) Coomassie Brilliant Blue stained SDS-PAGE gel showing molecular weight marker (lane1), total C6 cellular protein (lane2), nuclear protein fraction (lane3) and purified membrane protein fraction (lane4). 30 μg protein was loaded in lanes 2-4. As shown, membrane fraction has fewer number of proteins compared to the nuclear fraction and total cellular protein. Molecular weight marker shows 250, 130, 100, 70, 55, 35, and 25kDa bands. (B) Western-blot analysis shows Na+/K+ ATPase (100 kDa membrane protein) and histone H3 (17 kDa nuclear protein) in total C6 cellular protein (lane1), nuclear protein fraction (lane2) and purified membrane protein fraction (lane3). As shown, Na+/K+ ATPase is enriched in the membrane fraction, whereas histone H3 is enriched in the nuclear fraction.
Figure 2
Figure 2. GST pull-down assay to identify membrane proteins binding to GDNF
Silver stained SDS-PAGE gel shows membrane proteins from C6 rat glioma cells (C6) and primary rat astrocytes (AST) pulled down by either GST or GDNF-GST fusion protein. Lane1, C6-GST; Lane2, C6-GDNF-GST; Lane3, AST-GST; Lane 4, AST-GDNF-GST; Lane 5, protein molecular weight marker. Note: GST: GST alone; GDNF-GST: GDNF-GST fusion protein.
Figure 3
Figure 3. Analysis of candidate membrane receptors for GDNF in human glioblastoma patient samples
Comparison of mRNA levels (log2 median-centered intensity) of human GFRA1, RET, NCAM1, ITGB1, CDH2, SDC3, NRP1, NRP2 and ATRN in (1) normal brain samples (total 10 samples) and (2) glioblastoma brain samples (542 samples) from TCGA Brain dataset analyzed by Oncomine® Platform. Results showed that mRNA levels of GFRA1, RET, NCAM1, CDH2, SDC3 and ATRN in glioblastoma brain samples were similar to the normal brain group (P>0.05). On the other hand, mRNA levels of NRP1, NRP2 and ITGB1 were significantly higher in the glioblastoma brain samples compared to the normal brains (P<0.001 for NRP1; P<0.01 for NRP2 and ITGB1).
Figure 4
Figure 4. Immunofluorescence staining of NRP1 in C6 rat glioma cells and primary rat astrocytes
Representative immunofluorescence staining images of C6 rat glioma cells (C6) and rat primary astrocytes (AST). (Left to right) Phase contrast, NRP1 staining (probed with anti-NRP1 antibody; red), nuclear staining (DAPI; blue) and Merged (NRP1 and DAPI) images are shown for AST (top) and C6 (bottom) cells. NRP1 expression was significantly higher in C6 cells than AST (P<0.05). Note: scale bar = 40 μm.
Figure 5
Figure 5. Immunofluorescence analysis showing membrane recruitment of NRP1 by exogenous GDNF in C6 glioma cells
Representative laser confocal immunofluorescence images of C6 rat glioma cells stained with (left to right) DAPI (blue, nuclear staining), anti-Na+/K+ ATPase antibody (green, membrane staining), anti-NRP1 antibody (red) and merge (DAPI, anti-Na+/K+ ATPase and anti-NRP1) in GDNF treated (bottom) and non-GDNF treated (top) cells. NRP1 was recruited to the cell membrane after short-term GDNF treatment, whereas NRP1 was localized in the cytoplasm in the non-GDNF group. Note: scale bar = 20 μm.
Figure 6
Figure 6. Illustration of binding interactions between GDNF and NRP1
Interaction between GDNF and NRP1 based on protein structure docking performed by the ZDOCK server and visualized by PyMOL Molecular Graphics System. (A) A surface presentation of the GDNF-NRP1 binding interface. Blue: GDNF; yellow: NRP1. (B) Surface images of GDNF (Blue) and NRP1 (yellow) showing H-bond between amino acid residues of GDNF and NRP1 (red). (C) A ribbon and stick presentation of GDNF-NRP1 binding. Blue: GDNF; yellow: NRP1. (D) A stick presentation of the GDNF-NRP1 binding interface showing the 8 H-bonds between the corresponding amino acids. (E) Surface presentation showing electrostatic interaction between NRP1 and GDNF on one side. Red denotes negative charge whereas blue denotes positive charge. (F) Surface presentation showing electrostatic interaction between NRP1 and GDNF on the opposite side to that shown in E.
Figure 7
Figure 7. Co-immunoprecipitation analysis demonstrating NRP1 and GDNF binding
Western blot analysis showing results of Co-IP of membrane proteins from non-GDNF and GDNF treated (40 ng/ml) groups with either IgG (negative control), anti-NRP1 or anti-GDNF antibodies. NRP1 (103kDa) binds to GDNF (24kDa) in both non-GDNF and GDNF treatment groups. As shown, NRP1 is enriched in the GDNF treated group.
Figure 8
Figure 8. NRP1 RNAi reduces proliferation of GDNF-treated C6 rat glioma cells
C6 rat glioma cells were infected with lentiviruses containing NRP1 shRNA or CON077 (control shRNA) for 48 h and then treated with or without exogenous GDNF. Plot shows CCK-8 assay measurements of cell proliferation at -48, 0, 24, 48 and 72h. As shown, NRP1 knockdown demonstrated lower OD values than the CON077 group at all time points after adding exogenous GDNF. Data were analyzed as mean ± SD from 3 replicate experiments.
Figure 9
Figure 9. The effects of exogenous GDNF on NRP1 mRNA and protein expression in C6 cells
(A) Histogram shows relative NRP1 mRNA levels in C6 cells at 0, 3, 6, 12 and 24h after treatment with 40 ng/ml GDNF. Relative levels plotted represent ratio of experiment group/control group. (B) Histogram shows quantification of relative NRP1 protein levels (ratio of NRP1/β-actin) in C6 cells at 0, 3, 6, 12 and 24h after treatment with 40 ng/ml GDNF. Representative western blot is also shown. The data represent the mean ± SEM of three independent experiments. *P < 0.05.
Figure 10
Figure 10. Kaplan-Meier survival analysis of GBM patients with high and low NRP1 mRNA levels
(A) Kaplan-Meier curves for overall survival showing high NRP1 mRNA expressing GBM patient group (group 1) and normal NRP1 expressing GBM patient group (group 0). (B) Kaplan-Meier curves for disease-free survival showing high NRP1 mRNA expressing GBM patient group (group 1) and normal NRP1 expressing GBM patient group (group 0). Note: abscissa: survival months of patients; ordinate: survival rate; P< 0.05.

References

    1. Furnari FB, Fenton T, Bachoo RM, Mukasa A, Stommel JM, Stegh A, Hahn WC, Ligon KL, Louis DN, Brennan C, Chin L, DePinho RA, Cavenee WK. Malignant astrocytic glioma: genetics, biology, and paths to treatment. Genes Dev. 2007;21:2683–710. - PubMed
    1. Van Meir EG, Hadjipanayis CG, Norden AD, Shu HK, Wen PY, Olson JJ. Exciting new advances in neuro-oncology: the avenue to a cure for malignant glioma. CA Cancer J Clin. 2010;60:166–93. - PMC - PubMed
    1. Wiesenhofer B, Stockhammer G, Kostron H, Maier H, Hinterhuber H, Humpel C. Glial cell line-derived neurotrophic factor (GDNF) and its receptor (GFR-alpha 1) are strongly expressed in human gliomas. Acta Neuropathol. 2000;99:131–37. - PubMed
    1. Wiesenhofer B, Weis C, Humpel C. Glial cell line-derived neurotrophic factor (GDNF) is a proliferation factor for rat C6 glioma cells: evidence from antisense experiments. Antisense Nucleic Acid Drug Dev. 2000;10:311–21. - PubMed
    1. Lodish HB, Zipursky SL, Matsudaira P, Baltimore D, Darnell J. Molecular Cell Biology. New York, USA: W.H. Freeman; 2000.