. 2017 Oct 31;18(1):211.
doi: 10.1186/s13059-017-1330-z.

The influence of microRNAs and poly(A) tail length on endogenous mRNA-protein complexes

Affiliations

The influence of microRNAs and poly(A) tail length on endogenous mRNA-protein complexes

Olivia S Rissland et al. Genome Biol. .

Abstract

Background: All mRNAs are bound in vivo by proteins to form mRNA-protein complexes (mRNPs), but changes in the composition of mRNPs during posttranscriptional regulation remain largely unexplored. Here, we have analyzed, on a transcriptome-wide scale, how microRNA-mediated repression modulates the associations of the core mRNP components eIF4E, eIF4G, and PABP and of the decay factor DDX6 in human cells.

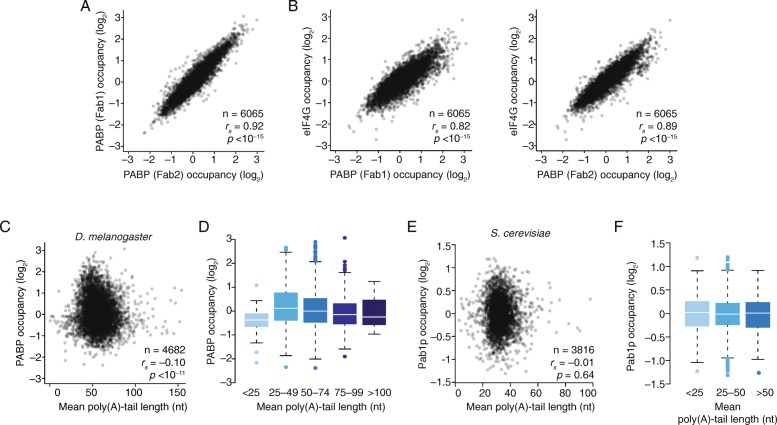
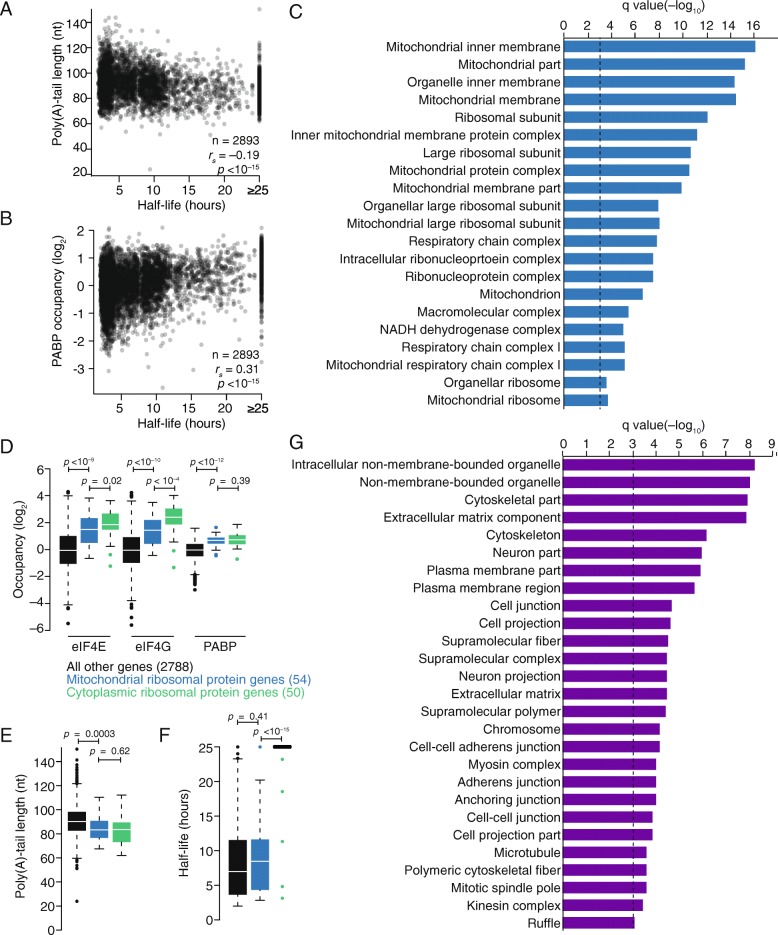
Results: Despite the transient nature of repressed intermediates, we detect significant changes in mRNP composition, marked by dissociation of eIF4G and PABP, and by recruitment of DDX6. Furthermore, although poly(A)-tail length has been considered critical in post-transcriptional regulation, differences in steady-state tail length explain little of the variation in either PABP association or mRNP organization more generally. Instead, relative occupancy of core components correlates best with gene expression.

Conclusions: These results indicate that posttranscriptional regulatory factors, such as microRNAs, influence the associations of PABP and other core factors, and do so without substantially affecting steady-state tail length.

Keywords: MicroRNAs; Poly(A) tail; mRNA–protein complexes.


Conflict of interest statement

Ethics approval and consent to participate

Not applicable.

Consent for publication

Not applicable.

Competing interests

The authors declare that they have no competing interests.

Publisher’s Note

Springer Nature remains neutral with regard to jurisdictional claims in published maps and institutional affiliations.

Figures

Fig. 1
Fig. 1
The influence of miRNAs on AGO2, eIF4E, eIF4G, and PABP occupancies on endogenous mRNAs. a The influence of miRNAs on mRNA abundance and AGO2 occupancy, as determined by RIP with NanoString quantification. Line graphs plot the cumulative distributions of changes in total mRNA (left), AGO2-immunoprecipitated mRNA (middle), and AGO2 occupancy (right) due to transfection of miR-124 (top) or miR-155 (bottom), distinguishing the results for targets of the transfected miRNA from those of the other miRNA (red and black, respectively). Bar plots show the median fold changes in total mRNA (black), AGO2-immunoprecipitated mRNA (blue), and inferred AGO2 occupancy (purple) attributable to the indicated miRNA. To arrive at these changes, median changes for non-target mRNAs were subtracted from those of target mRNAs. Significant differences in the cumulative distributions attributable to the miRNA are indicated: *p < 0.05; **p < 0.01; ***p < 0.0001; two-tailed K–S test. b The influence of miRNAs on mRNA abundance and eIF4E, eIF4G, and PABP occupancies. Otherwise, this panel is as in a. c The influence of miRNAs on eIF4G occupancy, as determined by RIP-seq. The effects on site-containing mRNAs were calculated relative to control mRNAs without sites. Otherwise, bar graphs are as in a. d The influence of miRNAs on PABP occupancy, as determined by RIP-seq and plotted as in c. e The influence of miRNAs on eIF4E occupancy, as determined by RIP-seq and plotted as in c
Fig. 2
Fig. 2
The influence of miRNAs on DDX6 occupancy on endogenous mRNAs. a The influence of miRNAs on mRNA abundance and DDX6 occupancy, as determined by RIP with NanoString quantification. Bar plots show the median fold changes in total mRNA (black), DDX6-immunoprecipiated mRNA (blue), and inferred DDX6 occupancy (purple) attributable to the indicated miRNA. Significant differences in the cumulative distributions attributable to the miRNA are indicated: *p < 0.05; **p < 0.01; ***p < 0.0001; two-tailed K–S test. b The influence of miRNAs on DDX6 occupancy, as determined by RIP-seq and plotted as in a
Fig. 3
Fig. 3
DDX6-bound mRNAs have shorter poly(A) tails. a Comparison of mean poly(A)-tail lengths of DDX6-bound mRNA with those of total mRNA. Results are plotted for each gene with sufficient PAL-seq tags in both samples. b The differences in mean poly(A)-tail lengths observed between DDX6-bound and total mRNA for each gene plotted in a (white line, median; box, quartiles; whiskers, 1.5 interquartile range). c Relationship between the difference in mean tail lengths observed between the DDX6-bound and total mRNA with respect to the mean tail lengths of total mRNA. d Mean poly(A)-tail lengths in the total mRNA and in DDX6-bound RNA following the indicated transfections (line, median; box, quartiles; whiskers, 1.5 interquartile range). Significance of the differences was evaluated using the paired Mann–Whitney U test. e The modest effects of miRNAs on mean poly(A)-tail lengths of DDX6-bound mRNAs. Plotted are the changes in mean poly(A)tail lengths of DDX6-bound mRNAs when comparing samples with the indicated transfected and mock-transfected miRNAs, distinguishing the results for mRNAs that contain at least one site to the cognate miRNA (site, red) from those for mRNAs that do not (no site, black). Significance was evaluated using the two-tailed K–S test
Fig. 4
Fig. 4
Poly(A)-tail lengths of PABP-bound transcripts. a Comparison of poly(A)-tail lengths of PABP-bound mRNA with those of total mRNA. Otherwise, this panel is as in Fig. 3a. b Tail-length distributions of metagenes constructed from total mRNA (black) and PABP-associated mRNA (blue). c Tail-length distributions of total mRNA and PABP-associated mRNA from the indicated genes. d The differences in mean poly(A)-tail lengths observed between PABP-bound and total mRNA for each gene plotted in a (line, median; box, quartiles; whiskers, 1.5 interquartile range). e Mean poly(A)-tail lengths in the total mRNA and in PABP-bound RNA following the indicated transfections. Otherwise, this panel is as in Fig. 3d. f The negligible effects of miRNAs on mean poly(A)-tail lengths of PABP-bound RNA. Otherwise, this panel is as in Fig. 3e
Fig. 5
Fig. 5
The weak relationship between mean poly(A) tail length and PABP occupancy in human cells. a Comparison of eIF4E and eIF4G occupancies for mRNAs of each gene that exceeded the expression cutoffs for quantification. b Comparison of eIF4E and PABP occupancies; otherwise as in a. c Comparison of eIF4G and PABP occupancies; otherwise as in a. d Relationship between PABP occupancy and mean poly(A)-tail length for mRNAs of each gene that exceeded the expression cutoffs for quantification. e Mean poly(A)-tail lengths of mRNAs of ribosomal protein genes (red) and of mRNAs of other genes (black). Significance was evaluated using the two-tailed K–S test. f eIF4E, eIF4G, and PABP occupancies for mRNAs of ribosomal protein genes (red) and those of other genes exceeding the expression cutoff (black). Significance was evaluated using the two-tailed K–S test. g Phasing analysis of poly(A)-tail lengths of total mRNA. For each of 100 randomly selected genes, each pairwise difference of individual tail lengths was calculated, and the normalized frequency for each possible difference was plotted (grey points) together with the average frequency (red points). h A zoomed-in version of g, focusing on differences between 0 and 60 nucleotides. i Phasing analysis of poly(A)-tail lengths of PABP-bound mRNA; otherwise, as in g. j A zoomed-in version of i, focusing on differences between 0 and 60 nucleotides
Fig. 6
Fig. 6
The weak relationship between PABP occupancy and mean poly(A)-tail length in Drosophila and yeast cells. a Comparison of PABP occupancies in D. melanogaster S2 cells determined using two different Fabs. Results are plotted for mRNAs from genes that exceeded the expression cutoffs for quantification. b Comparison of eIF4G occupancy with PABP occupancy, determined using either Fab1 or Fab2 (left and right, respectively). Otherwise this panel is as in a. c Relationship between PABP occupancy and mean poly(A)-tail length of mRNAs of Drosophila genes expressed in S2 cells. Otherwise, this panel is as in Fig. 5d. d PABP occupancies of mRNAs from S2 cells, grouping mRNAs by their mean poly(A)-tail length (line, median; box, quartiles; whiskers, 1.5 interquartile range). e Relationship between PABP occupancy and mean poly(A)-tail length of mRNAs of S. cerevisiae genes. Otherwise, this panel is as in c. f PABP occupancies of yeast mRNAs grouped by mean poly(A)-tail length. Otherwise, this panel is as in d
Fig. 7
Fig. 7
The relationship between PABP occupancy and transcript stability. a The relationship between mean poly(A)-tail length and mRNA half-life. Results are plotted for each gene that exceeded the expression cutoffs for quantification. b The relationship between PABP occupancy and mRNA half-life; otherwise as in a. c The top 21 gene ontology (GO) terms enriched in genes more unstable than predicted by their PABP occupancies, plotting for each term the log-transformed q value of its enrichment. Dashed line indicates a q-value of 0.001. d eIF4E, eIF4G, and PABP occupancies for mRNAs of mitochondrial ribosomal protein genes (blue), cytoplasmic ribosomal protein genes (green), and all other genes that exceeded the expression cutoffs for quantification (black) (line, median; box, quartiles; whiskers, 1.5 interquartile range). Significance was evaluated using the two-tailed K–S test. e Mean poly(A)-tail lengths of mRNAs of mitochondrial ribosomal protein genes, cytoplasmic ribosomal protein genes, and other genes; otherwise as in d. f mRNA stabilities of mRNAs of mitochondrial ribosomal protein genes, cytoplasmic ribosomal protein genes, and other genes; otherwise as in d. g The top 27 GO terms enriched in genes more stable than predicted by their PABP occupancies. Otherwise, this panel is as in c

References

    1. Hogan DJ, Riordan DP, Gerber AP, Herschlag D, Brown PO. Diverse RNA-binding proteins interact with functionally related sets of RNAs, suggesting an extensive regulatory system. PLoS Biol. 2008;6:e255. doi: 10.1371/journal.pbio.0060255. - DOI - PMC - PubMed
    1. Mansfield KD, Keene JD. The ribonome: a dominant force in co-ordinating gene expression. Biol Cell. 2009;101:169–81. doi: 10.1042/BC20080055. - DOI - PMC - PubMed
    1. Singh G, Pratt G, Yeo GW, Moore MJ. The clothes make the mRNA: past and present trends in mRNP fashion. Annu Rev Biochem. 2015;84:325–54. doi: 10.1146/annurev-biochem-080111-092106. - DOI - PMC - PubMed
    1. Rissland OS. The organization and regulation of mRNA-protein complexes. Wiley Interdiscip Rev RNA. 2017;8:e1369. - PMC - PubMed
    1. Baltz AG, Munschauer M, Schwanhäusser B, Vasile A, Murakawa Y, Schueler M, et al. The mRNA-bound proteome and its global occupancy profile on protein-coding transcripts. Mol Cell. 2012;46:674–90. doi: 10.1016/j.molcel.2012.05.021. - DOI - PubMed