. 2017 Oct 31;125(10):107010.
doi: 10.1289/EHP1539.

An Investigation of the Single and Combined Phthalate Metabolite Effects on Human Chorionic Gonadotropin Expression in Placental Cells

Affiliations

An Investigation of the Single and Combined Phthalate Metabolite Effects on Human Chorionic Gonadotropin Expression in Placental Cells

Jennifer J Adibi et al. Environ Health Perspect. .

Abstract

Background: Observational studies have reported associations between maternal phthalate levels and adverse outcomes at birth and in the health of the child. Effects on placental function have been suggested as a biologic basis for these findings.

Objective: We evaluated the effects of phthalates on placental function in vitro by measuring relevant candidate genes and proteins.

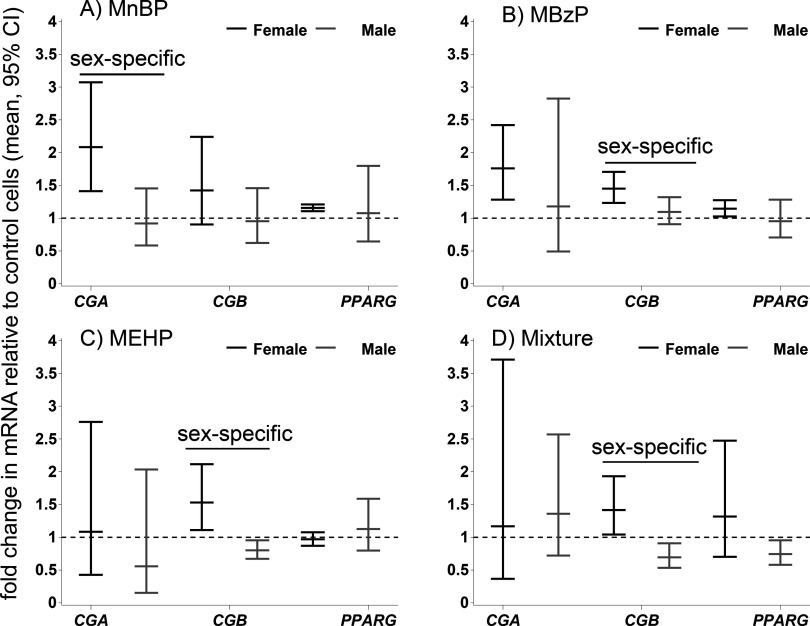
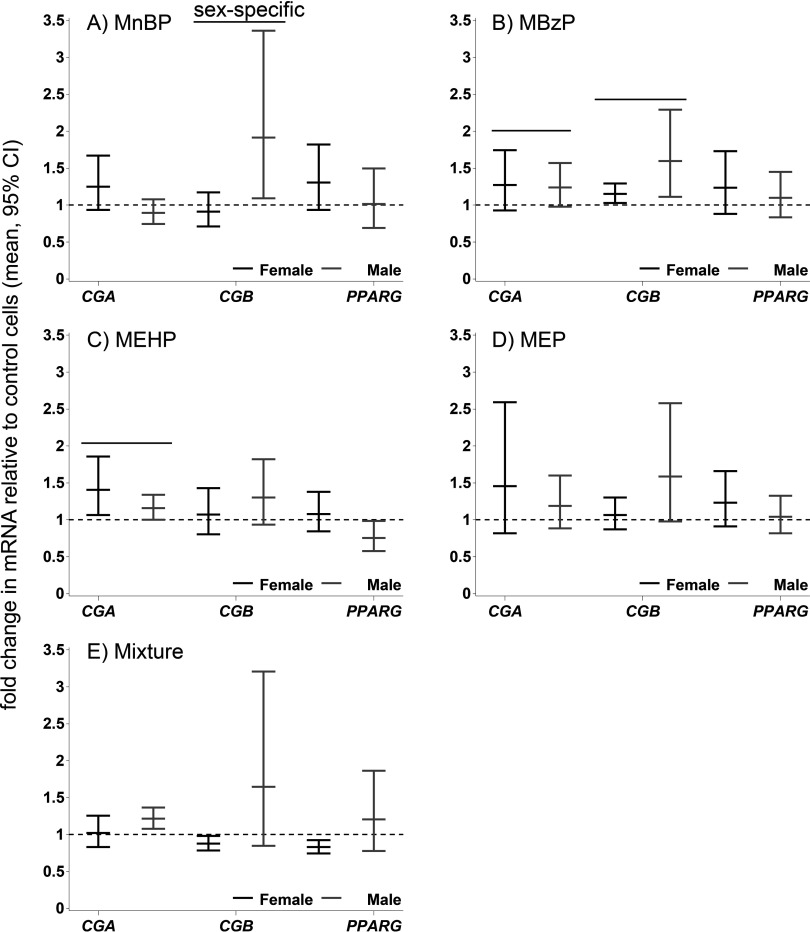
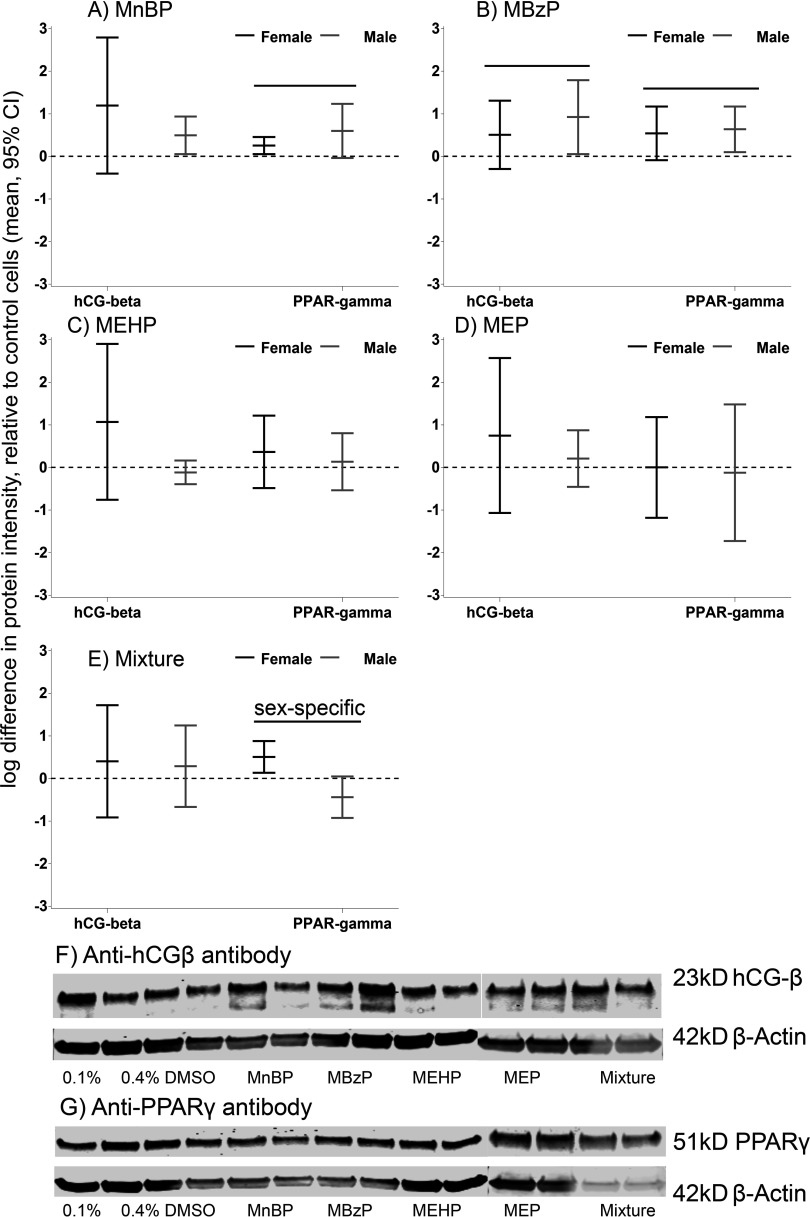
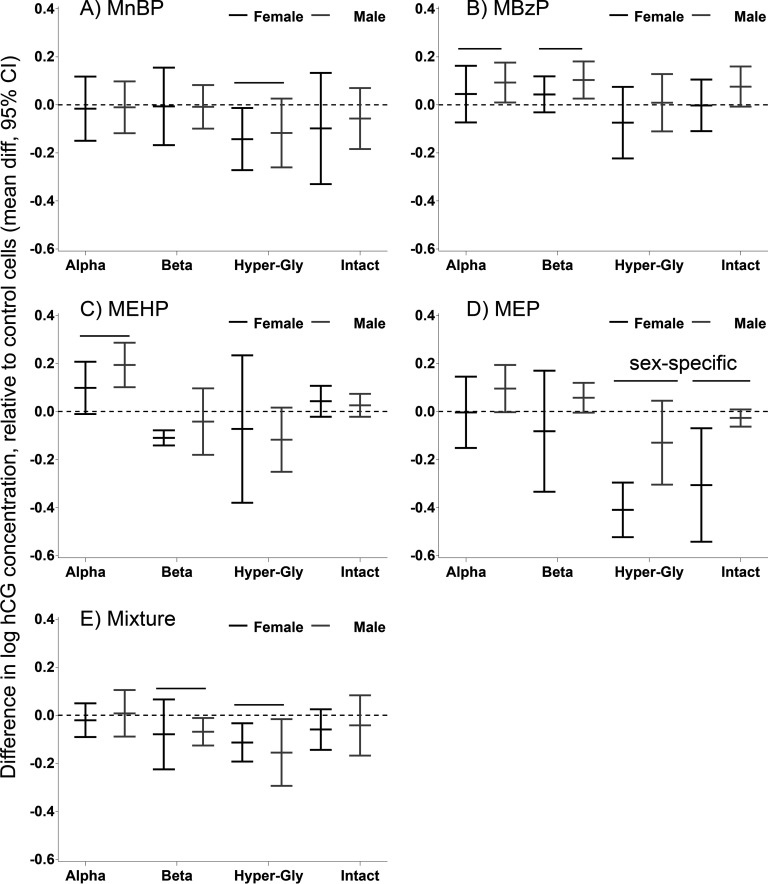
Materials and methods: Human trophoblast progenitor cells were isolated at 7-14 wk of pregnancy (two female and three male concepti), and villous cytotrophoblast cells (vCTBs) were isolated at 15-20 wk (three female and four male concepti). Cells were cultured in vitro with four phthalate metabolites and their combination at concentrations based on levels found previously in the urine of pregnant women: mono-n-butyl (MnBP, 200 nM), monobenzyl (MBzP, 3μM), mono-2-ethylhexyl (MEHP, 700 nM), and monoethyl (MEP, 1.5μM) phthalates. mRNA levels of CGA, CGB, PPARG, CYP19A1, CYP11A1, PTGS2, EREG, and the intracellular β subunit of human chorionic gonadotropin (hCGβ) and peroxisome proliferator activated receptor γ (PPARγ) were measured in the cellular extracts, and protein levels for four forms of secreted hCG were measured in the conditioned media.

Results: Previously reported associations between maternal phthalates and placental gene expression were reproduced experimentally: MnBP with CGA, MBzP with CYP11A1, and MEHP with PTGS2. CGB and hCGβ were up-regulated by MBzP. In some cases, there were marked, even opposite, differences in response by sex of the cells. There was evidence of agonism in female cells and antagonism in male cells of PPARγ by simultaneous exposure to multiple phthalates.

Conclusions: Concentrations of MnBP, MBzP and MEHP similar to those found in the urine of pregnant women consistently altered hCG and PPARγ expression in primary placental cells. These findings provide evidence for the molecular basis by which phthalates may alter placental function, and they provide a preliminary mechanistic hypothesis for opposite responses by sex. https://doi.org/10.1289/EHP1539.


Figures

Figures 1A to 1D are four whisker plots with confidence intervals plotting fold change in TBPC mRNA relative to control cells (mean, 95 percent CI) (y-axis) across phthalates CGA, CGB, and PPARG (x-axis) for metabolites MnBP, MBzP, MEHP, and their mixture.
Figure 1.
Phthalate effects on mRNAs. The effects are expressed as mean relative fold change (2ΔΔct) and 95% confidence intervals (CIs) compared with DMSO-treated control cells in undifferentiated trophoblasts (TBPCs). (A) 200nM MnBP; (B) 3μM MBzP; (C) 700nM MEHP; (D) mixture of all four metabolites (MnBP, MBzP, MEHP, MEP). The black lines indicate female-specific effects, and the gray lines indicate male-specific effects. Overall effects that were significant (p0.05) are indicated by a line and marked “sex-specific” if the phthalate effect differed in male and female cells. CG, chorionic gonadotropin; DMSO, dimethyl sulfoxide; MBzP, monobenzyl phthalate; MEHP, mono-2-ethylhexyl phthalate; MEP, monoethyl phthalate; MnBP, mono-n-butyl phthalate; PPARG, peroxisome proliferator activated receptor gamma.
Figures 2A to 2E are five whisker plots with confidence intervals plotting fold change in vCTB mRNA relative to control cells (mean, 95 percent CI) (y-axis) across phthalates CGA, CGB, and PPARG (x-axis) for metabolites MnBP, MBzP, MEHP, MEP, and their mixture.
Figure 2.
Phthalate effects on mRNAs. The effects are expressed as mean relative fold change (2ΔΔct) and 95% confidence intervals (CIs) compared with DMSO-treated control cells in differentiated cytotrophoblasts (vCTBs). (A) 200nM MnBP; (B) 3μM MBzP; (C) 700nM MEHP; (D) 1.5μM MEP; (E) mixture of all four metabolites. The black lines indicate female-specific effects, and the gray lines indicate male-specific effects. Overall effects that were significant (p0.05) are indicated by a line and marked “sex-specific” if the phthalate effect differed in male and female cells. CG, chorionic gonadotropin; DMSO, dimethyl sulfoxide; MBzP, monobenzyl phthalate; MEHP, mono-2-ethylhexyl phthalate; MEP, monoethyl phthalate; MnBP, mono-n-butyl phthalate; PPARG, peroxisome proliferator activated receptor gamma.
Figures 3A to 3E are five whisker plots with confidence intervals plotting log difference in protein intensity, relative to control cells (mean, 95 percent CI) (y-axis) across phthalates hCG beta and PPAR gamma (x-axis) for metabolites MnBP, MBzP, MEHP, MEP, and their mixture. Figure 3F and 3G are Western blots for hCG beta and PPAR gamma.
Figure 3.
Phthalate effects on intracellular hCGβ and PPARγ levels in differentiated cytotrophoblasts (vCTBs). The effects are expressed as the mean natural log difference in protein intensity and 95% confidence intervals (CIs) compared with DMSO-treated control cells. (A) 200nM MnBP; (B) 3μM MBzP; (C) 700nM MEHP; (D) 1.5μM MEP; (E) mixture of all four metabolites. The black lines indicate female-specific effects, and the gray lines indicate male-specific effects. Overall effects that were significant (p0.05) are indicated by a line and marked “sex-specific” if the phthalate effect differed in male and female cells. Examples of (F) hCGβ and (G) PPARγ Western blots. Each dose group was assayed in duplicate (two lanes). This represents a single experiment conducted on cells isolated from a female placenta at 15.6 wk gestation. DMSO, dimethyl sulfoxide; hCGβ, human chorionic gonadotropin β; MBzP, monobenzyl phthalate; MEHP, mono-2-ethylhexyl phthalate; MEP, monoethyl phthalate; MnBP, mono-n-butyl phthalate; PPARγ, peroxisome proliferator activated receptor gamma.
Figures 4A to 4E are five whisker plots with confidence intervals plotting difference in log hCG concentration, relative to control cells (mean difference, 95% confidence intervals) (y-axis) srm of hCG and intact hCG (x-axis) for metabolites MnBP, MBzP, MEHP, MEP, and their mixture.
Figure 4.
Phthalate effects on secreted hCG forms in the conditioned media of differentiated trophoblasts (villous cytotrphoblasts, vCTBs). The effects are expressed as the difference in mean natural log concentration and 95% confidence intervals (CIs) compared with DMSO-treated control cells. (A) 200nM MnBP; (B) 3μM MBzP; (C) 700nM MEHP; (D) 1.5μM MEP; (E) mixture of all four metabolites. The black lines indicate female-specific effects, and the gray lines indicate male-specific effects. Overall effects that were significant (p0.05) are indicated by a line and marked “sex-specific” if the phthalate effect differed in male and female cells. DMSO, dimethyl sulfoxide; hCG human chorionic gonadotropin; MBzP, monobenzyl phthalate; MEHP, mono-2-ethylhexyl phthalate; MEP, monoethyl phthalate; MnBP, mono-n-butyl phthalate.
Figures 5A to 5C are flowcharts showing Spearman rank correlations.
Figure 5.
Spearman rank correlations between levels of mRNAs, intracellular proteins, and secreted proteins in female and male differentiated trophoblasts (villous cytotrphoblasts, vCTBs). (A) Correlations that are common to male and female vCTBs; (B) Correlations detected only in female and in male cells (p0.05). Positive correlations are drawn as solid black lines, and negative correlations are drawn as dotted lines. hCG, human chorionic gonadotropin; PPAR, peroxisome proliferator activated receptor.

References

    1. Adibi JJ, Hauser R, Williams PL, Whyatt RM, Calafat AM, Nelson H, et al. 2009. Maternal urinary metabolites of di-(2-ethylhexyl) phthalate in relation to the timing of labor in a US multicenter pregnancy cohort study. Am J Epidemiol 169(8):1015–1024, PMID: 19251754, 10.1093/aje/kwp001. - DOI - PMC - PubMed
    1. Adibi JJ, Whyatt RM, Hauser R, Bhat HK, Davis BJ, Calafat AM, et al. 2010. Transcriptional biomarkers of steroidogenesis and trophoblast differentiation in the placenta in relation to prenatal phthalate exposure. Environ Health Perspect 118(2):291–296, PMID: 20123604, 10.1289/ehp.0900788. - DOI - PMC - PubMed
    1. Adibi JJ, Lee MK, Naimi AI, Barrett E, Nguyen RH, Sathyanarayana S, et al. 2015a. Human chorionic gonadotropin partially mediates phthalate association with male and female anogenital distance. J Clin Endocrinol Metab 100(9):E1216–E1224, PMID: 26200238, 10.1210/jc.2015-2370. - DOI - PMC - PubMed
    1. Adibi JJ, Lee MK, Saha S, Boscardin WJ, Apfel A, Currier RJ. 2015b. Fetal sex differences in human chorionic gonadotropin fluctuate by maternal race, age, weight and by gestational age. J Dev Orig Health Disease 6(6):493–500, PMID: 26242396, 10.1017/S2040174415001336. - DOI - PMC - PubMed
    1. Adibi JJ, Buckley JP, Lee MK, Williams PL, Just AC, Zhao Y, et al. 2017. Maternal urinary phthalates and sex-specific placental mRNA levels in an urban birth cohort. Environ Health 16(1):35, PMID: 28381288, 10.1186/s12940-017-0241-5. - DOI - PMC - PubMed