

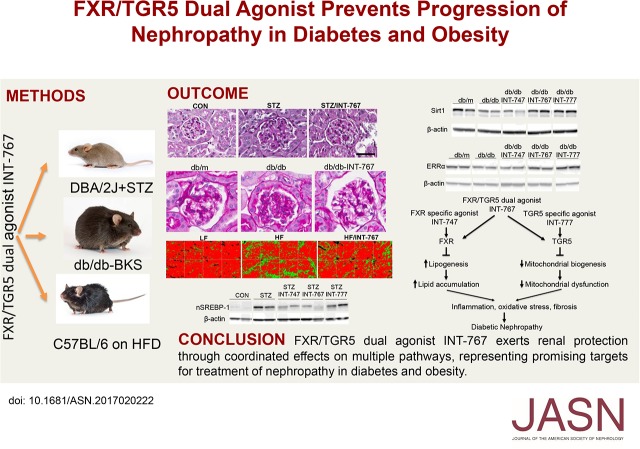
FXR/TGR5 Dual Agonist Prevents Progression of Nephropathy in Diabetes and Obesity
- PMID: 29089371
- PMCID: PMC5748904
- DOI: 10.1681/ASN.2017020222
FXR/TGR5 Dual Agonist Prevents Progression of Nephropathy in Diabetes and Obesity
Abstract
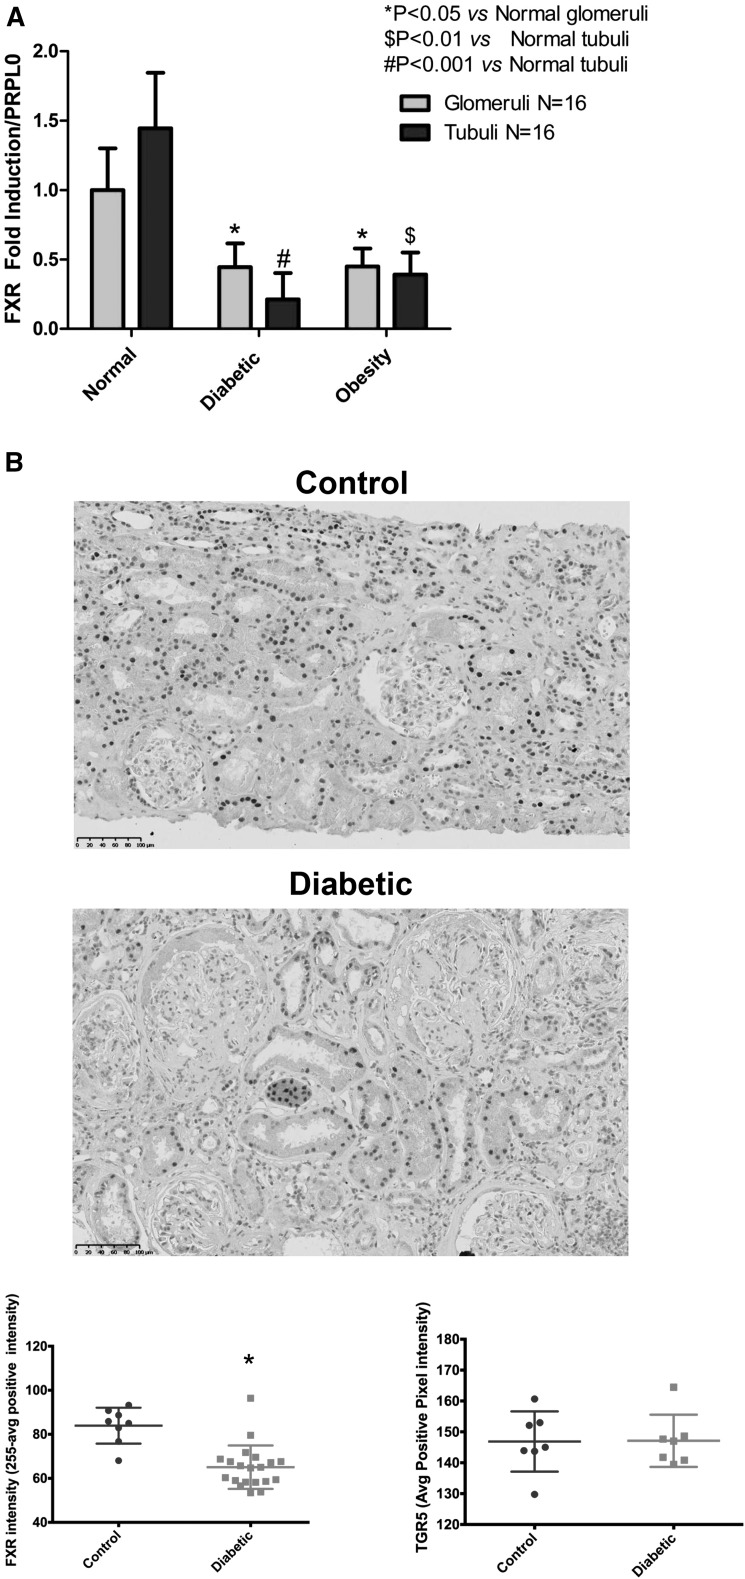
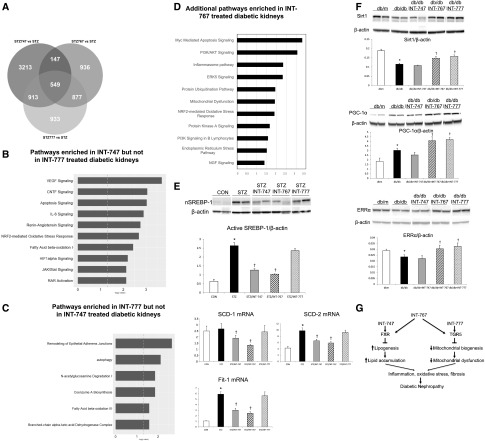
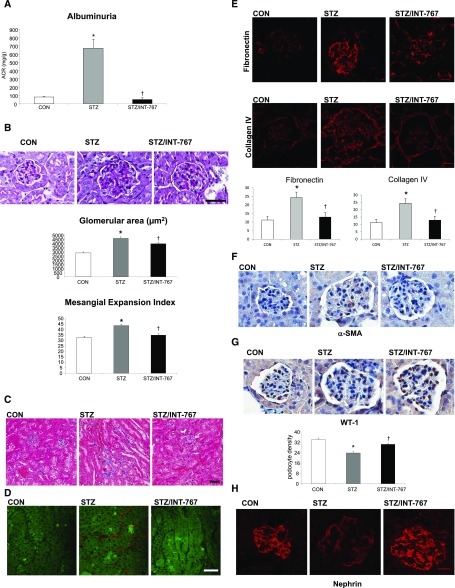
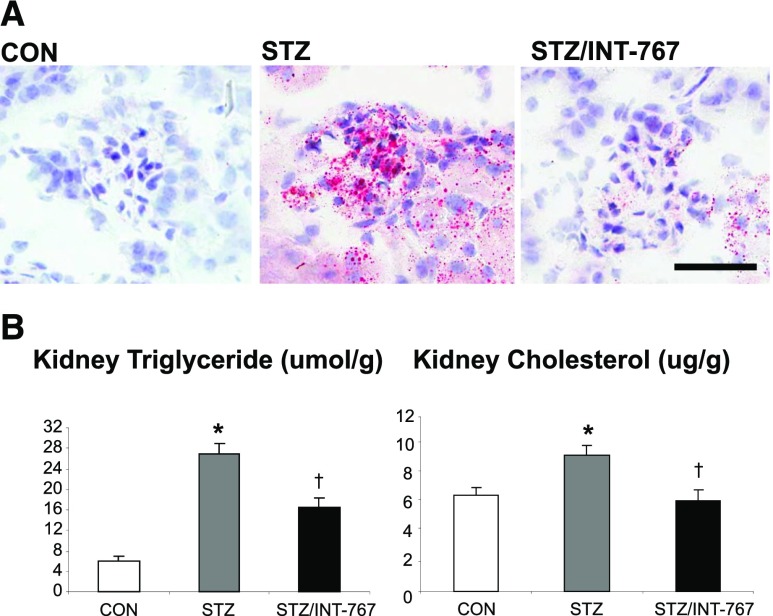
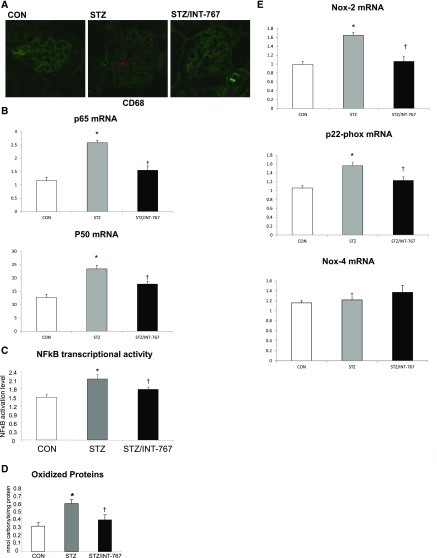
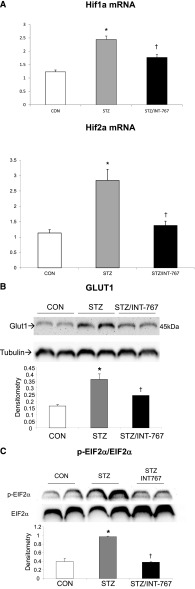
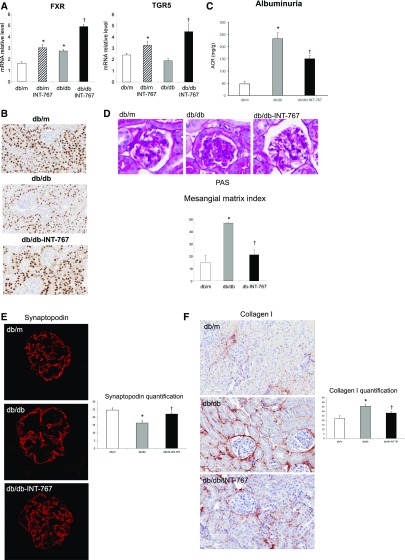
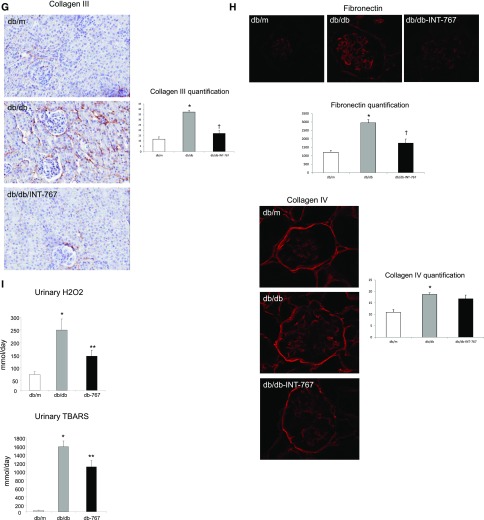
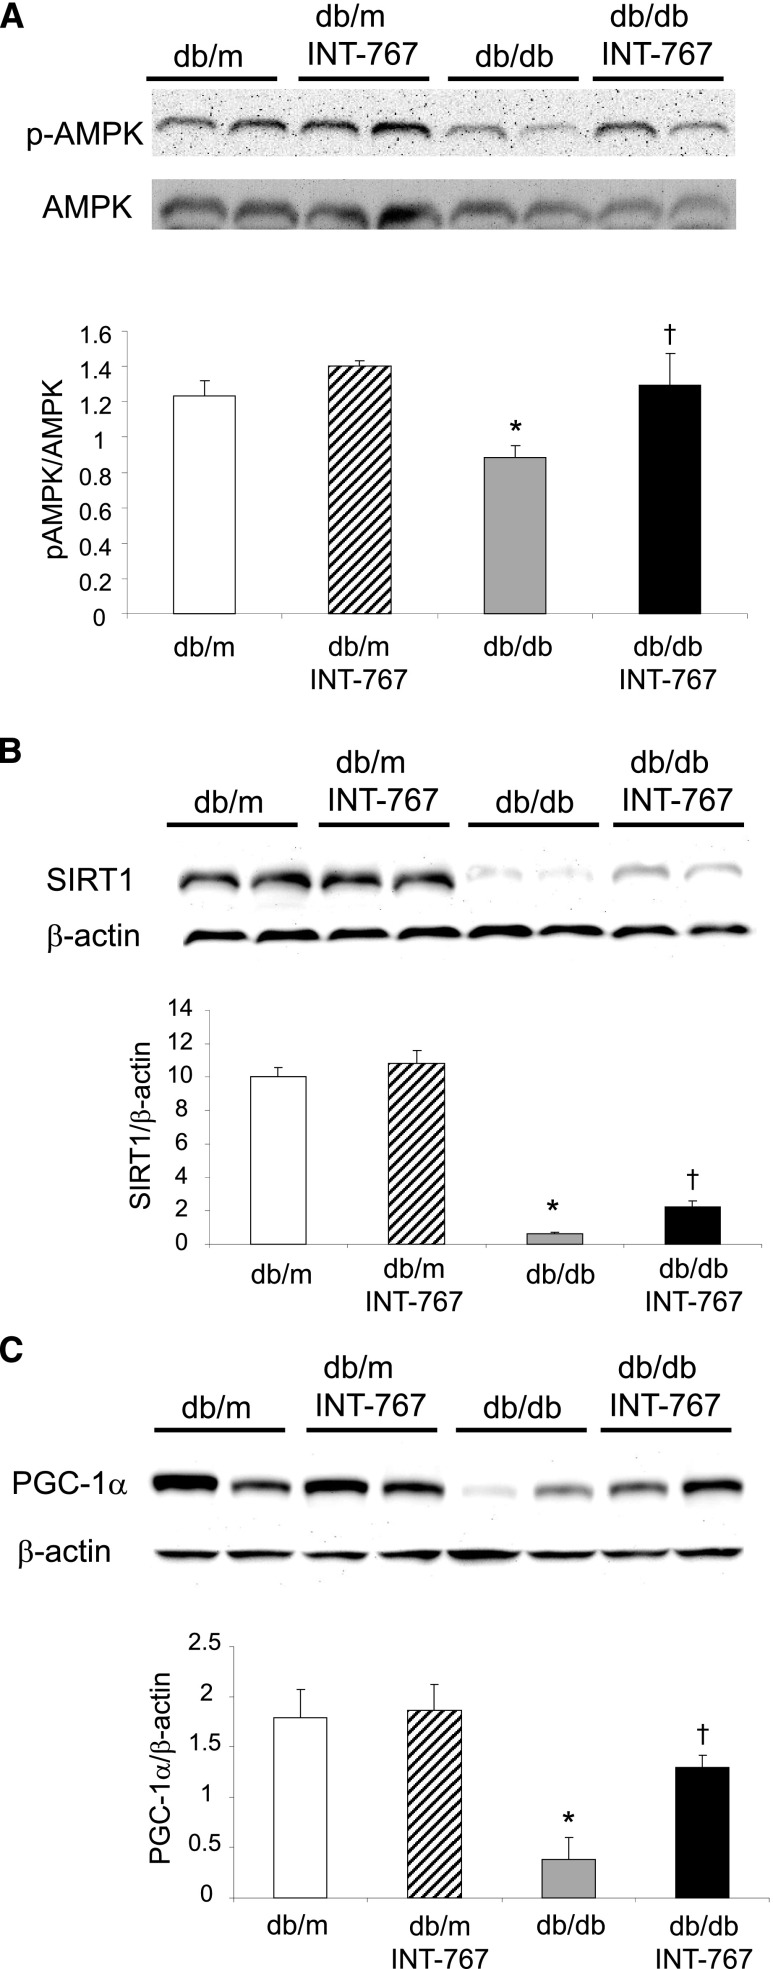
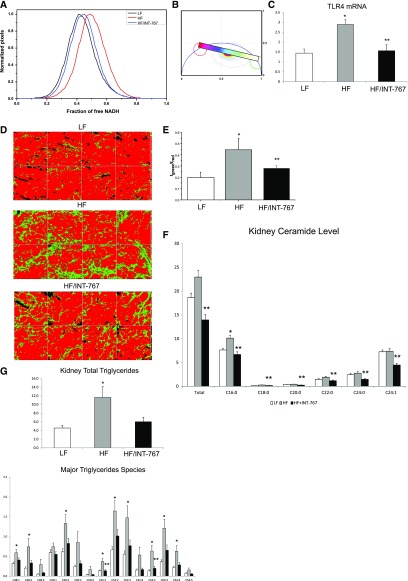
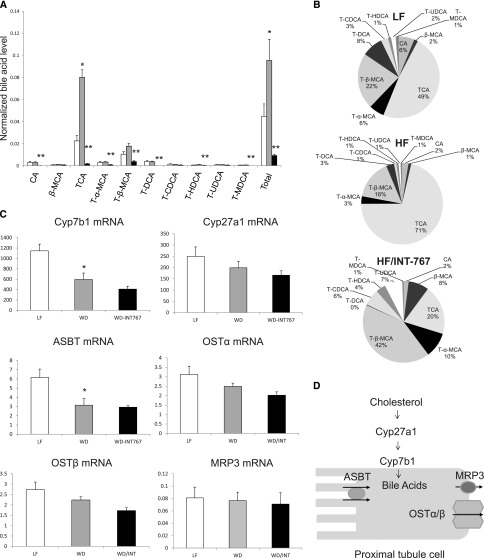
Bile acids are ligands for the nuclear hormone receptor farnesoid X receptor (FXR) and the G protein-coupled receptor TGR5. We have shown that FXR and TGR5 have renoprotective roles in diabetes- and obesity-related kidney disease. Here, we determined whether these effects are mediated through differential or synergistic signaling pathways. We administered the FXR/TGR5 dual agonist INT-767 to DBA/2J mice with streptozotocin-induced diabetes, db/db mice with type 2 diabetes, and C57BL/6J mice with high-fat diet-induced obesity. We also examined the individual effects of the selective FXR agonist obeticholic acid (OCA) and the TGR5 agonist INT-777 in diabetic mice. The FXR agonist OCA and the TGR5 agonist INT-777 modulated distinct renal signaling pathways involved in the pathogenesis and treatment of diabetic nephropathy. Treatment of diabetic DBA/2J and db/db mice with the dual FXR/TGR5 agonist INT-767 improved proteinuria and prevented podocyte injury, mesangial expansion, and tubulointerstitial fibrosis. INT-767 exerted coordinated effects on multiple pathways, including stimulation of a signaling cascade involving AMP-activated protein kinase, sirtuin 1, PGC-1α, sirtuin 3, estrogen-related receptor-α, and Nrf-1; inhibition of endoplasmic reticulum stress; and inhibition of enhanced renal fatty acid and cholesterol metabolism. Additionally, in mice with diet-induced obesity, INT-767 prevented mitochondrial dysfunction and oxidative stress determined by fluorescence lifetime imaging of NADH and kidney fibrosis determined by second harmonic imaging microscopy. These results identify the renal signaling pathways regulated by FXR and TGR5, which may be promising targets for the treatment of nephropathy in diabetes and obesity.
Keywords: diabetic nephropathy; metabolism; obesity.
Copyright © 2018 by the American Society of Nephrology.
Figures
References
-
- Gregg EW, Li Y, Wang J, Burrows NR, Ali MK, Rolka D, Williams DE, Geiss L: Changes in diabetes-related complications in the United States, 1990-2010. N Engl J Med 370: 1514–1523, 2014 - PubMed
Publication types
MeSH terms
Substances
Grants and funding
LinkOut - more resources
Full Text Sources
Other Literature Sources
Medical
Molecular Biology Databases
Miscellaneous
