. 2017 Nov 14;114(46):E9989-E9998.
doi: 10.1073/pnas.1710964114. Epub 2017 Oct 31.

Transcriptomes of major renal collecting duct cell types in mouse identified by single-cell RNA-seq

Affiliations

Transcriptomes of major renal collecting duct cell types in mouse identified by single-cell RNA-seq

Lihe Chen et al. Proc Natl Acad Sci U S A. .

Abstract

Prior RNA sequencing (RNA-seq) studies have identified complete transcriptomes for most renal epithelial cell types. The exceptions are the cell types that make up the renal collecting duct, namely intercalated cells (ICs) and principal cells (PCs), which account for only a small fraction of the kidney mass, but play critical physiological roles in the regulation of blood pressure, extracellular fluid volume, and extracellular fluid composition. To enrich these cell types, we used FACS that employed well-established lectin cell surface markers for PCs and type B ICs, as well as a newly identified cell surface marker for type A ICs, c-Kit. Single-cell RNA-seq using the IC- and PC-enriched populations as input enabled identification of complete transcriptomes of A-ICs, B-ICs, and PCs. The data were used to create a freely accessible online gene-expression database for collecting duct cells. This database allowed identification of genes that are selectively expressed in each cell type, including cell-surface receptors, transcription factors, transporters, and secreted proteins. The analysis also identified a small fraction of hybrid cells expressing aquaporin-2 and anion exchanger 1 or pendrin transcripts. In many cases, mRNAs for receptors and their ligands were identified in different cells (e.g., Notch2 chiefly in PCs vs. Jag1 chiefly in ICs), suggesting signaling cross-talk among the three cell types. The identified patterns of gene expression among the three types of collecting duct cells provide a foundation for understanding physiological regulation and pathophysiology in the renal collecting duct.

Keywords: intercalated cell; kidney; principal cell; systems biology.


Conflict of interest statement

The authors declare no conflict of interest.

Figures

Fig. 1.
Fig. 1.
Identification of cell surface markers for ICs. (A) The 24 transcripts with the highest mRNA abundance (i.e., RPKM) ratios between GFP+ (ICs) and GFP cells in pooled samples from Atp6v1b1-GFP transgenic mice. Bold type indicates a gene generally recognized to be expressed in ICs. The x-axis indicates the abundance ratios (full listing of ratios provided in Dataset S2). (B) Collecting duct from mouse kidney immunolabeled with anti–H+-ATPase (A-subunit) antibody (green) and anti–c-Kit antibody (red) shows strong basolateral c-Kit localization in A-ICs (cells labeled “A”) that have apical H+-ATPase labeling. (Inset) B-IC (cells labeled “B”) with apical and basolateral H+-ATPase labeling but only weak basolateral c-Kit localization. In contrast, the adjacent A-IC has strong basolateral c-Kit expression. Some weaker intracellular labeling for c-Kit is also detectable in B-ICs. Images were captured by using a Zeiss LSM800 confocal microscope with Airyscan. (Scale bar: 5 µm). L, lumen. (C) Transcripts enriched in c-Kit+ cell population relative to DBA+ cell population. Transcript abundance (i.e., TPM) ratio (c-Kit+:DBA+, presumed IC:PC) greater than 10 and TPM greater than 200 in either population. Bold type indicates a gene generally accepted to be expressed in ICs. The x-axis indicates the abundance ratios (full listing of ratios provided in Dataset S3). (D) Transcripts enriched in DBA+ cell population relative to c-Kit+ cell population. Transcript abundance ratio (TPM, DBA+:c-Kit+, presumed PC:IC) greater than 4.77 and TPM greater than 200 in either population. Bold type indicates a gene widely accepted to be expressed in PCs. The x-axis indicates the abundance ratios (full listing of ratios provided in Dataset S3).
Fig. 2.
Fig. 2.
Visualization of RNA-seq mapping reads for c-Kit+ and DBA+ cell populations and scRNA-seq mapped reads for representative transcripts. (A) Distribution of RNA-seq reads across gene bodies of selected genes for pooled c-Kit+ (Top) and pooled DBA+ (Bottom) cells. c-Kit+ cells abundantly express IC genes: Slc4a1, Slc26a4, and Avpr1a. DBA+ cells abundantly express PC genes: Aqp2, Avpr2, and Aqp3. (B) Distribution of scRNA-seq reads across gene bodies of Atp6v1b1 and Aqp2 in cells 1–6. Cells 1–3 abundantly express the H+-ATPase Atp6v1b1, an IC marker. Cells 4–6 abundantly express AQP2, a PC marker. Data were visualized in the UCSC Genome Browser. Vertical axis shows read counts. Map of exon/intron organization of each gene is shown on top of individual panels.
Fig. 3.
Fig. 3.
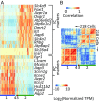
Supervised clustering of cells based on genes known to be expressed in ICs or PCs. (A) Heat map showing four different cell groups with different gene expression patterns. Group 1 cells appear to express genes associated with PCs. Group 2 cells express genes associated with ICs. Group 3 cells are likely hybrid cells with the expression of both IC and PC genes. Group 4 cells express neither of these genes. Note that, in group 2 cells, only a few cells express Slc26a4 and Insrr and are likely B-ICs. Columns are individual cells and rows are specific genes. Colors indicate the row-wise mean centered gene expression levels [mean normalized log2(TPM + 1)]. (B) Heat map showing the same cell groups (218 cells) identified in A grouped by calculating cell–cell Spearman correlation coefficients. Colors indicate the cell correlation by Spearman correlation coefficient between cells. Color bars indicate different cell clusters in A and B.
Fig. 4.
Fig. 4.
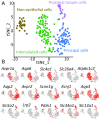
Unsupervised clustering of single-cell RNA-seq data. (A) t-SNE plot showing four different cell clusters. Different cell groups are color-coded. Brown, nonepithelial cells; green, ICs; blue, PCs; purple, proximal tubule cells. (B) t-SNE plot showing expression of selected gene among single cells. First row shows the expression of IC genes among single cells, second row shows the expression of PC genes among single cells, and third row shows the expression of proximal tubule cell genes. Red color indicates higher and gray color indicates lower gene expression. Expression of nonepithelial genes is shown in Fig. S3A. A full listing of transcripts for each single cell is provided in Dataset S4.
Fig. 5.
Fig. 5.
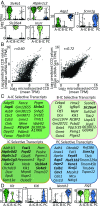
Gene distribution among three cell types. (A) Violin plot showing Slc4a1, Atp6v1c2, Slc26a4, Insrr, Aqp2, and Scnn1g expression in A-ICs, B-ICs, and PCs. (B) Correlation between scRNA-seq and single-tubule RNA-seq. Predicted CCD transcriptome (20% A-ICs + 20% B-ICs + 60% PCs) was calculated with median TPM (Left) and mean TPM (Right) of each cell type. Pearson correlation was calculated between predicted CCD transcriptome with CCD transcriptome obtained from microdissected CCDs (Dataset S1) using the cor.test function in R. Data are log2-transformed before plotting. A total of 8,022 genes that are abundantly expressed in all three cell types (Dataset S1) are plotted. (C) Top 25 transcripts enriched in A-ICs, B-ICs, ICs, and PCs. Transcript abundance fraction (mean TPM) greater than 0.85 [i.e., top 25 IC enriched transcripts: A-IC/(A-IC + B-IC + PC) > 0.85 and sorted by TPM]. Transcripts known to be expressed in collecting duct are indicated in bold type (full list provided in Dataset S4). (D) Violin plot showing ligand Kitl and Jag1 and its corresponding receptors Kit and Notch2 expression in A-ICs, B-ICs, and PCs. Each dot in the plot indicates an individual cell. A-IC cluster is colored green, B-IC cluster is colored light green, and PC cluster is colored blue. Vertical axis shows the gene expression value [log2(TPM + 1)]. Other examples are listed in Dataset S4.
Fig. 6.
Fig. 6.
Seven-membrane spanning receptors (i.e., GPCRs) expressed in ICs or PCs. (A) Tables show GPCRs selectively expressed in PCs and ICs. A yellow color gradient was used to indicate expression levels (full list provided in Dataset S4). (B) Pairwise correlation of the GPCRs, PC genes (Avpr2, Aqp2, and Scnn1g), and IC genes (Slc4a1, Kit, Aqp6, Slc4a9, Slc26a4, and Insrr) was calculated (detailed description provided in Methods). Genes with pairwise correlation >0.3 and FDR <0.05 were included for network construction. Gene pairs were presented as edges linking respective genes. PC genes are colored dark blue, B-IC genes are colored light green, and A-IC genes (Slc4a9 is a IC gene connecting A-IC and B-IC) are colored green. All other genes are colored light blue. (C) Top 16 secreted proteins abundantly expressed in A-ICs, B-ICs, and PCs (full list provided in Dataset S4). Bold type indicates cell type-specific secreted protein transcripts in A-ICs (ICs), B-ICs (ICs), and PCs.
Fig. 7.
Fig. 7.
TFs expressed in ICs or PCs. (A) TFs selectively expressed in PCs and ICs. A yellow color gradient was used to indicate expression levels (full list provided in Dataset S4). (B) Pairwise correlation of the TFs, PC genes (Avpr2, Aqp2, and Scnn1g), and IC genes (Slc4a1, Kit, Aqp6, Slc4a9, Slc26a4, and Insrr) was calculated (detailed description provided in Methods). Genes with pairwise correlation >0.3 and FDR <0.05 were included for network construction. Gene pairs were presented as edges linking respective genes. Nodes with less than two edges were removed before network construction. PC genes are colored dark blue, B-IC genes are colored light green, and A-IC genes (Slc4a9 is an IC gene connect A-IC and B-IC) are colored green. All other genes are colored light blue. (C) Heat map showing gene expression pattern of the nodes (TFs, PC, and IC genes) from B among A-ICs, B-ICs, and PCs. Colors indicate the gene expression levels [Z-normalized log2(TPM + 1)]. Columns are individual cells, and rows are specific genes listed in the box.
Fig. 8.
Fig. 8.
Immunolabeling of cell type-selective proteins. (A) Immunolabeling showing labeling for cell type-selective proteins (green) with Aqp2 (red) in mouse kidney sections. Eps8 and Foxp1 are predominately expressed in ICs. Scin is localized solely in PCs. Hoxd8 and Tfap2b are abundantly detected in the nucleus of PCs, albeit not limited to collecting ducts. Fosb shows nuclear dots staining in both ICs and PCs. Arrows indicate representative cells positive for cell type-selective proteins. (B) Tables showing the mean TPM values for proteins labeled green in A. A yellow color gradient was used to highlight expression levels.
Fig. 9.
Fig. 9.
Transporters and channels expressed in ICs or PCs. (A) Transporters and channels selectively expressed in PCs and ICs. A yellow color gradient was used to indicate expression levels (full list provided in Dataset S4). (B) Network showing the cell type-selective transporters and channels along with PC genes (Aqp2 and Scnn1g) and IC genes (Slc4a1, Kit, Aqp6, Slc4a9, Slc26a4, and Insrr). Genes with pairwise correlation >0.3 and FDR <0.05 were included for network construction. Gene pairs were presented as edges linking respective genes. Nodes with less than three edges were removed before network construction. (C) Immunohistochemistry showing labeling for AE4 (Slc4a9) in brown and pendrin (Slc26a4) in blue. (Left) Single labeling for AE4. (Right) Double labeling with pendrin. Images were obtained using DIC optics. Arrowheads in double labeling indicate pendrin-negative cells with basolateral AE4 signal. Arrows indicate pendrin-positive cells.

Comment in

References

    1. Kriz W, Bankir L. The Renal Commission of the International Union of Physiological Sciences (IUPS) A standard nomenclature for structures of the kidney. Kidney Int. 1988;33:1–7. - PubMed
    1. Lee JW, Chou CL, Knepper MA. Deep sequencing in microdissected renal tubules identifies nephron segment-specific transcriptomes. J Am Soc Nephrol. 2015;26:2669–2677. - PMC - PubMed
    1. Cheval L, et al. Atlas of gene expression in the mouse kidney: New features of glomerular parietal cells. Physiol Genomics. 2011;43:161–173. - PubMed
    1. Zeisel A, et al. Brain structure. Cell types in the mouse cortex and hippocampus revealed by single-cell RNA-seq. Science. 2015;347:1138–1142. - PubMed
    1. Treutlein B, et al. Reconstructing lineage hierarchies of the distal lung epithelium using single-cell RNA-seq. Nature. 2014;509:371–375. - PMC - PubMed

Publication types

MeSH terms