. 2017 Dec 4;149(12):1119-1138.
doi: 10.1085/jgp.201711803. Epub 2017 Oct 31.

Chasing the open-state structure of pentameric ligand-gated ion channels

Affiliations

Chasing the open-state structure of pentameric ligand-gated ion channels

Giovanni Gonzalez-Gutierrez et al. J Gen Physiol. .

Abstract

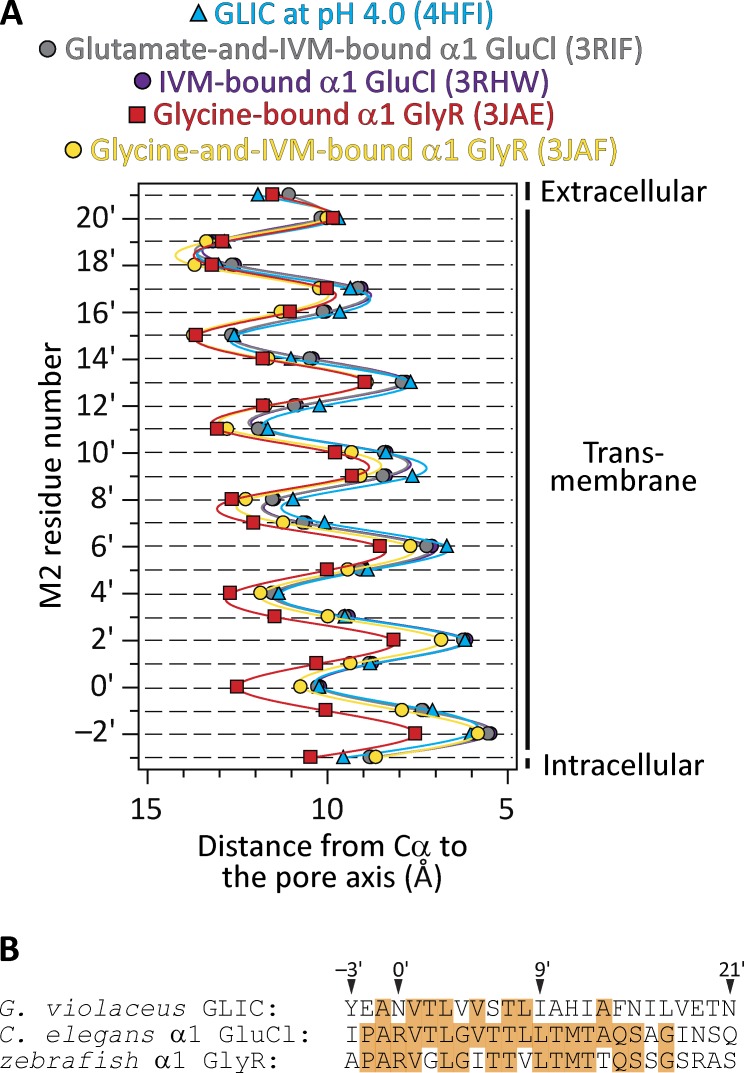
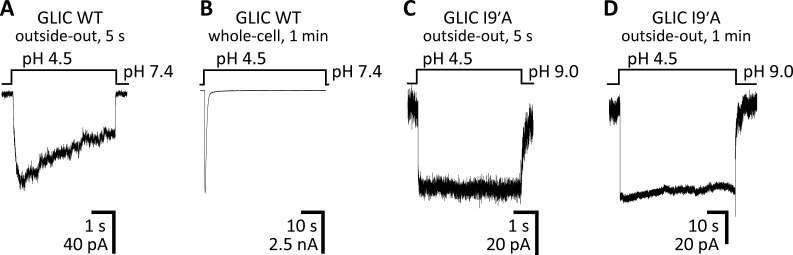
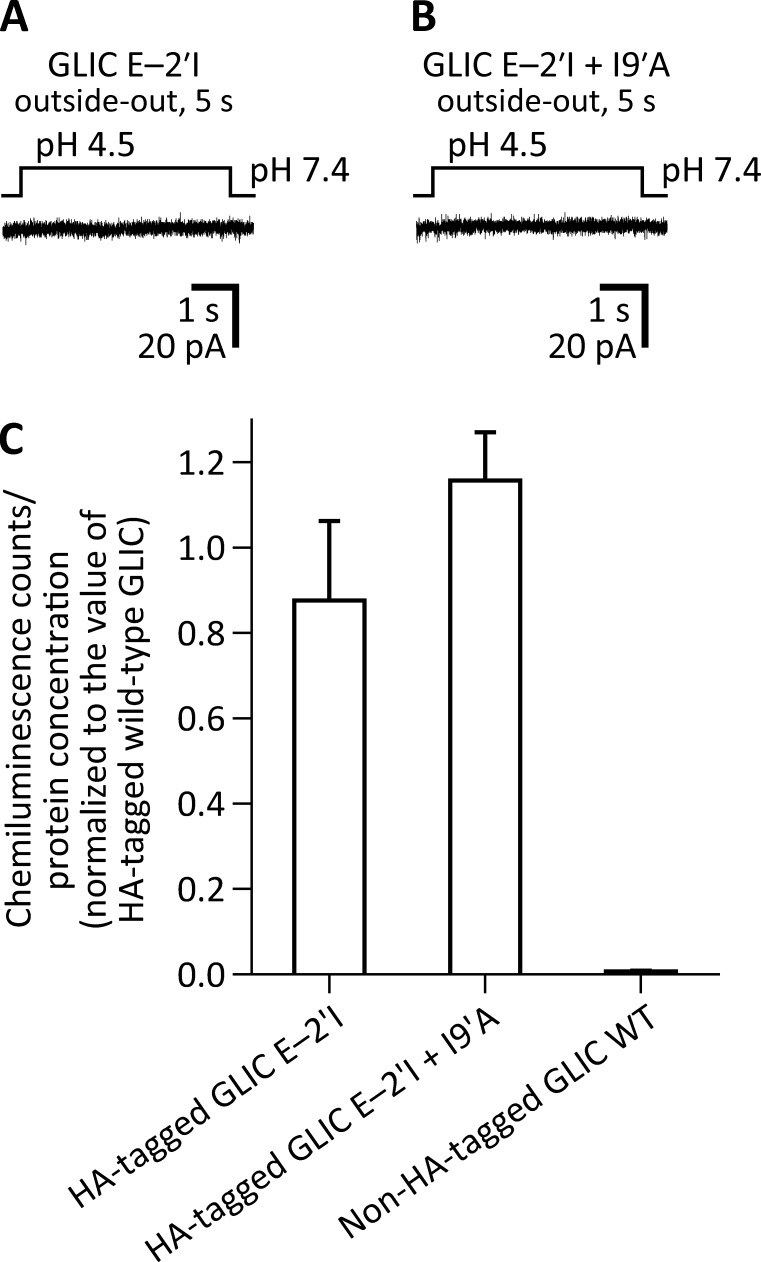
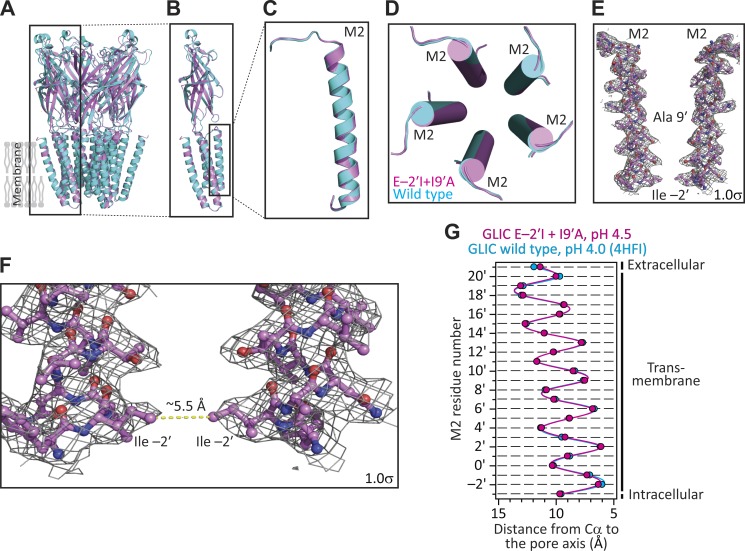
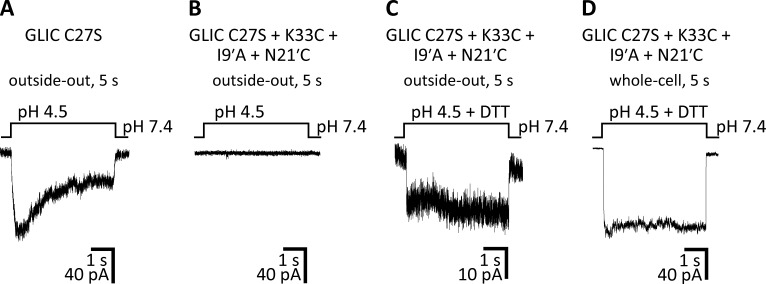
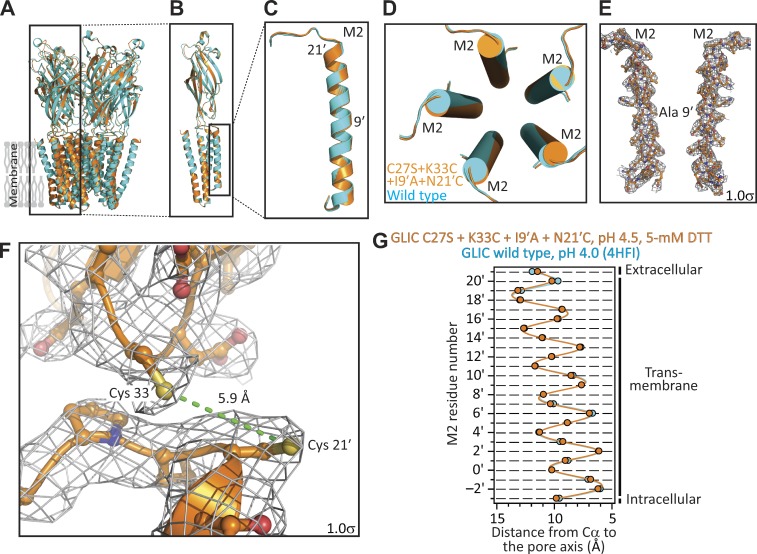
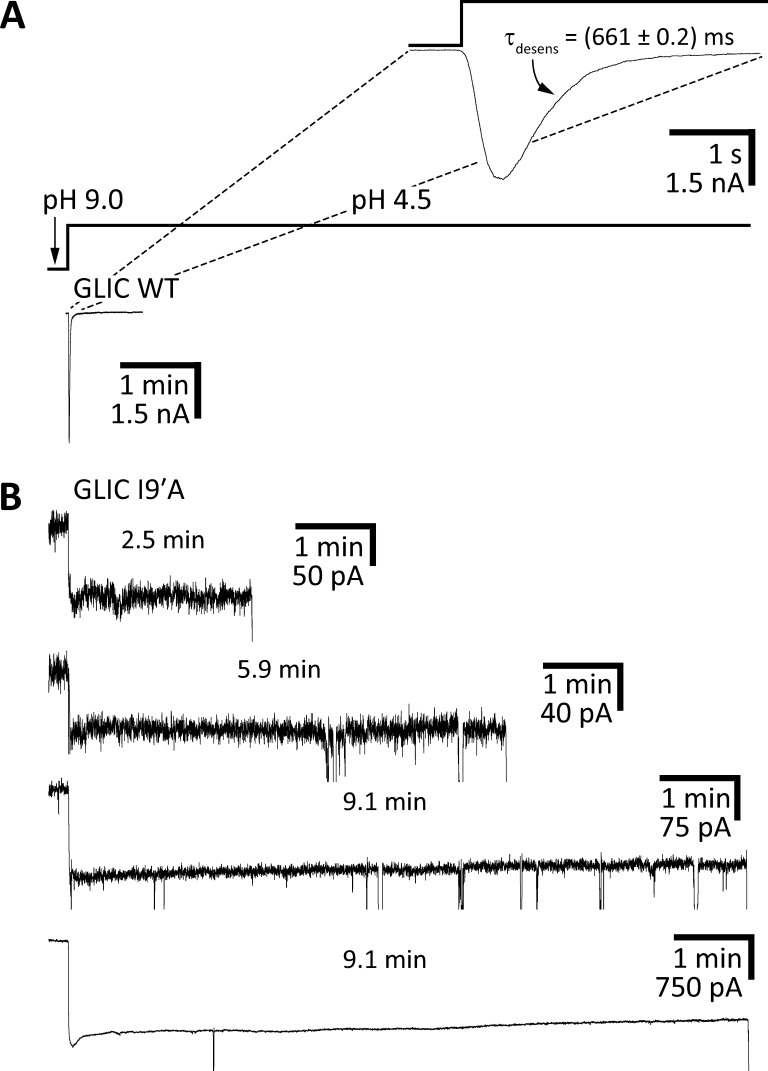
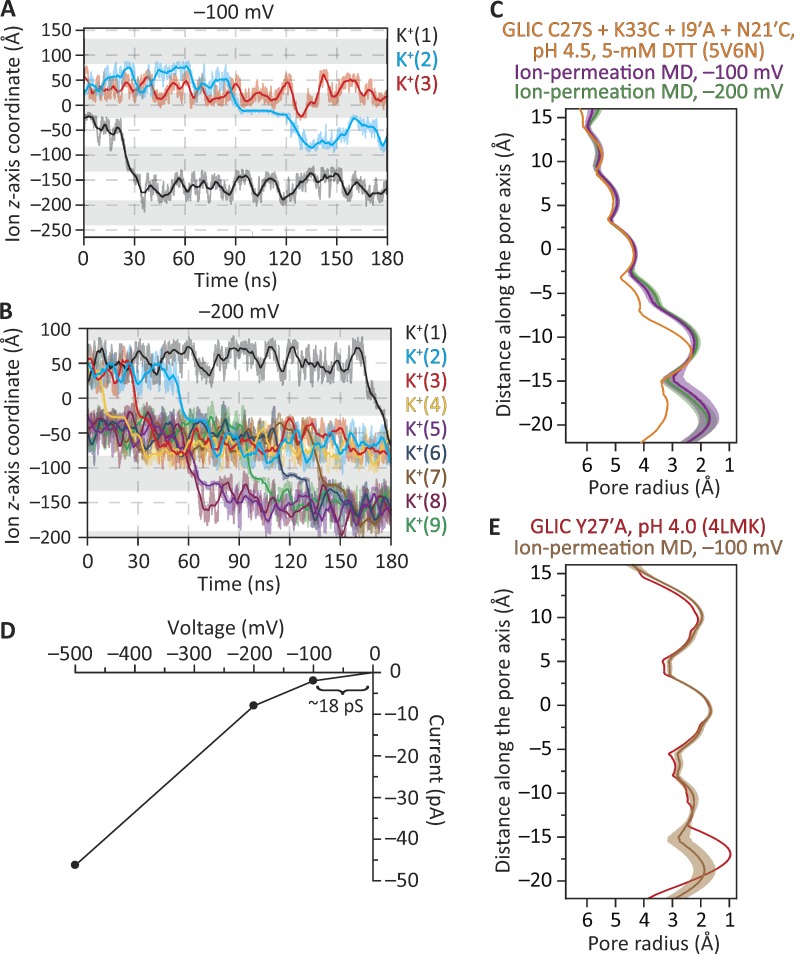
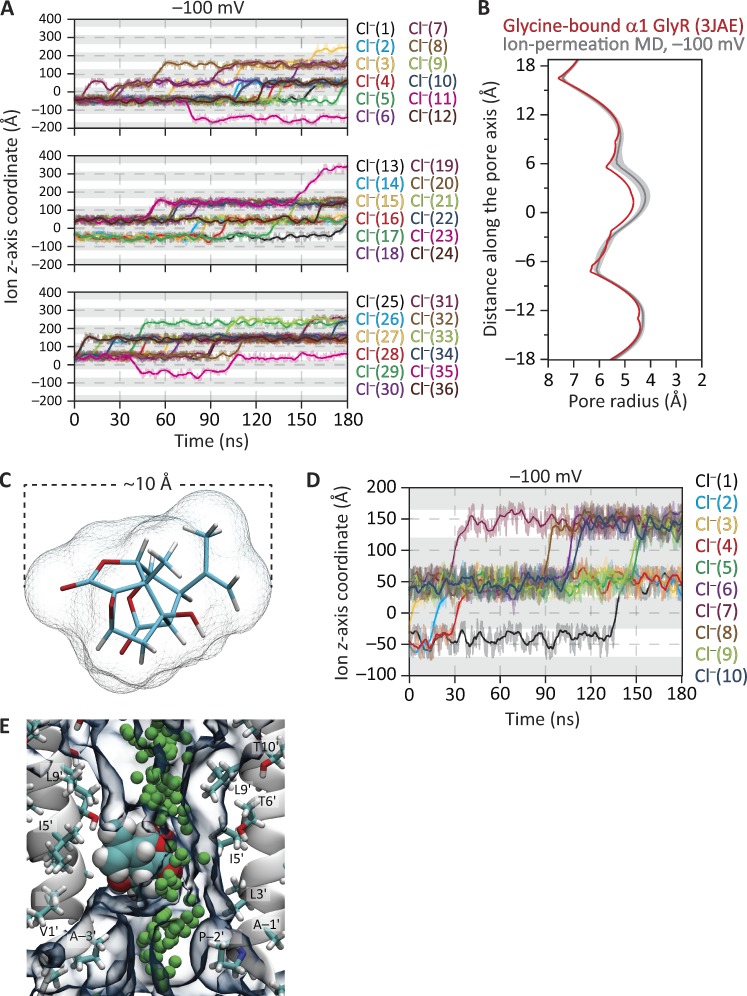
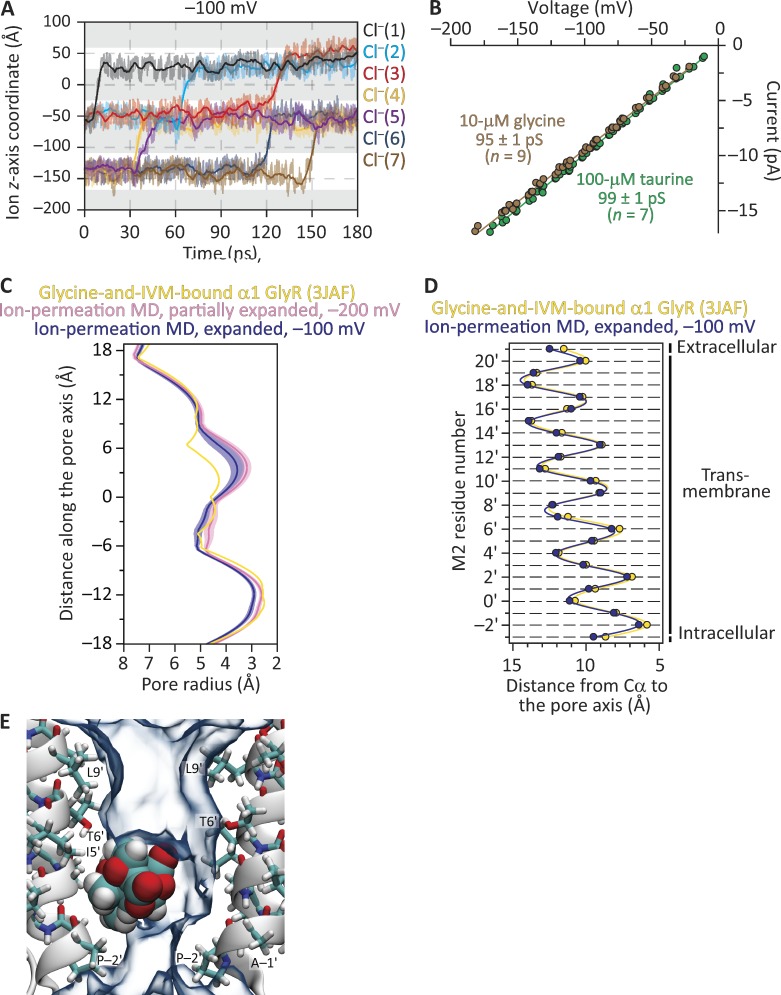
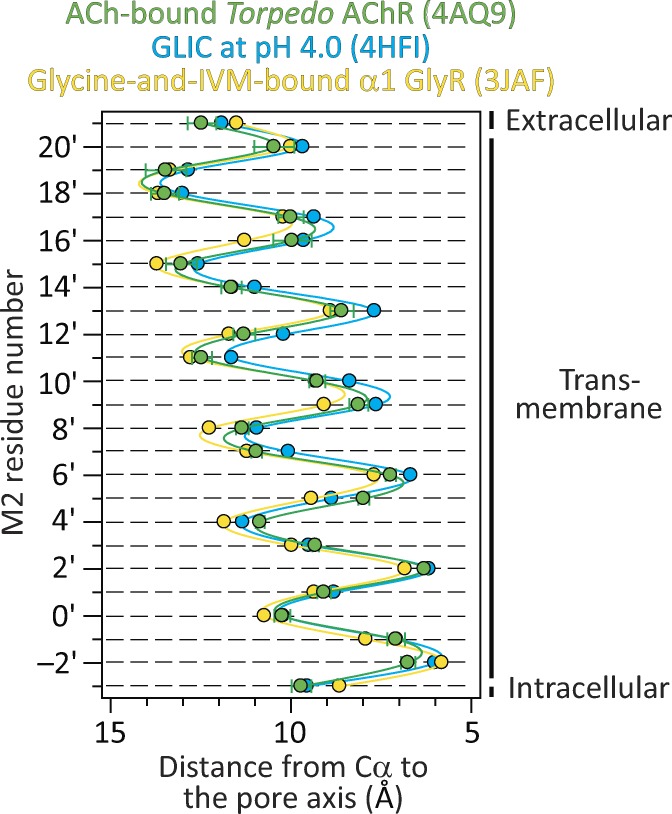
Remarkable advances have been made toward the structural characterization of ion channels in the last two decades. However, the unambiguous assignment of well-defined functional states to the obtained structural models has proved challenging. In the case of the superfamily of nicotinic-receptor channels (also referred to as pentameric ligand-gated ion channels [pLGICs]), for example, two different types of model of the open-channel conformation have been proposed on the basis of structures solved to resolutions better than 4.0 Å. At the level of the transmembrane pore, the open-state models of the proton-gated pLGIC from Gloeobacter violaceus (GLIC) and the invertebrate glutamate-gated Cl- channel (GluCl) are very similar to each other, but that of the glycine receptor (GlyR) is considerably wider. Indeed, the mean distances between the axis of ion permeation and the Cα atoms at the narrowest constriction of the pore (position -2') differ by ∼2 Å in these two classes of model, a large difference when it comes to understanding the physicochemical bases of ion conduction and charge selectivity. Here, we take advantage of the extreme open-channel stabilizing effect of mutations at pore-facing position 9'. We find that the I9'A mutation slows down entry into desensitization of GLIC to the extent that macroscopic currents decay only slightly by the end of pH 4.5 solution applications to the extracellular side for several minutes. We crystallize (at pH 4.5) two variants of GLIC carrying this mutation and solve their structures to resolutions of 3.12 Å and 3.36 Å. Furthermore, we perform all-atom molecular dynamics simulations of ion permeation and picrotoxinin block, using the different open-channel structural models. On the basis of these results, we favor the notion that the open-channel structure of pLGICs from animals is much closer to that of the narrow models (of GLIC and GluCl) than it is to that of the GlyR.


Figures

Figure 1.
Figure 1.
Different open-channel models. (A) Distances between the axis of ion permeation and the Cα atoms for residues in the pore-lining M2 α-helices of five different structural models of pLGICs (mean ± SE of all subunits; error bars smaller than the symbols were omitted). IVM, ivermectin. Solid lines are cubic-spline interpolations. The two GluCl profiles are nearly indistinguishable from each other. A comparison of pore dimensions including the side chains (as could be obtained using HOLE [Smart et al., 1996], for example) seems unwarranted here because the different models correspond to members of the superfamily with different amino acid sequences. The lumen of the pore is to the right of the plot. (B) Alignment of M2 α-helix sequences of the three pLGICs compared in A. Identical residues are indicated with an orange background.
Figure 2.
Figure 2.
The gain-of-function effect of the I9′A mutation on GLIC. (A–D) Macroscopic-current responses of WT GLIC (A and B) and the I9′A mutant (C and D) to 5-s or 1-min pulses of pH 4.5 extracellular solution. The displayed traces are representative recordings obtained in the outside-out or whole-cell configuration at −80 mV.
Figure 3.
Figure 3.
The E−2′I mutation suppresses the gain-of-function effect of the I9′A mutation on GLIC. Macroscopic-current responses of the E−2′I (A) and E−2′I + I9′A (B) mutants to 5-s pulses of pH 4.5 extracellular solution. The displayed traces are representative recordings obtained in the outside-out configuration at −80 mV. (C) Expression of GLIC mutants on the plasma membrane of HEK-293 cells. The presence of GLIC on the cell surface was detected immunochemically using a HA-tag appended to the C-terminal end of each tested construct. Values of chemiluminescence counts divided by protein concentration were normalized to those obtained for the HA-tagged WT GLIC for each individual experiment (n = 3). The mean and standard error of these normalized values were calculated and plotted for each construct.
Figure 4.
Figure 4.
X-ray crystal structure of GLIC E−2′I + I9′A at pH 4.5. (A–D) Structural alignment of the models of GLIC E−2′I + I9′A at pH 4.5 (magenta) and GLIC WT at pH 4.0 (PDB ID code 4HFI; cyan). (E and F) M2 α-helices of two nonadjacent subunits of the double mutant. The approximate locations of the mutated side chains are indicated. Mesh representations show the 2FoFc electron-density maps contoured at a level of 1.0σ. The narrowest constriction of this mutant’s pore occurs at the level of the engineered isoleucine side chains; its diameter (estimated using HOLE [Smart et al., 1996], and thus taking into account the atoms’ van der Waals radii) is ∼2.0 Å. (G) Cα profiles of the two structural models compared in (A–D). The five subunits of each model were averaged. Error bars (omitted if smaller than the symbols) are standard errors. Solid lines are cubic-spline interpolations. The lumen of the pore is to the right of the plot.
Figure 5.
Figure 5.
A disulfide bridge between cysteines engineered at positions 33 and 21′ suppresses the gain-of-function effect of the I9′A mutation on GLIC. (A–D) Macroscopic-current responses of the indicated constructs to 5-s pulses of pH 4.5 extracellular solution. The displayed traces are representative recordings obtained in the outside-out (A–C) or whole-cell (D) configuration at −80 mV. The cysteine at position 27—the only native cysteine of GLIC—was mutated to serine. The concentration of DTT was 5 mM. The traces in C and D are two examples of recordings from the same construct obtained on different cells. The recording in D was more heavily low-pass filtered than those in A–C.
Figure 6.
Figure 6.
X-ray crystal structure of GLIC C27S + K33C + I9′A + N21′C, in the presence of 5 mM DTT, at pH 4.5. (A–D) Structural alignment of the models of GLIC C27S + K33C + I9′A + N21′C, in the presence of 5 mM DTT, at pH 4.5 (orange) and GLIC WT at pH 4.0 (PDB ID code 4HFI; cyan). (E) M2 α-helices of two nonadjacent subunits of the quadruple mutant. The approximate location of position 9′ is indicated. (F) Magnified view of the cysteines engineered at positions 33 (in the β1–β2 loop of the extracellular domain) and 21′ (at the extracellular end of M2). The ∼5.9-Å distance between the two side-chain sulfur atoms (in yellow) is consistent with the cysteines being reduced. In E and F, mesh representations show the 2FoFc electron-density maps contoured at a level of 1.0σ. (G) Cα profiles of the two structural models compared in A–D. The five subunits of each model were averaged. Error bars (omitted if smaller than the symbols) are standard errors. Solid lines are cubic-spline interpolations. The lumen of the pore is to the right of the plot.
Figure 7.
Figure 7.
The desensitization time course of GLIC I9′A. Macroscopic-current responses of the indicated constructs upon stepping the pH of the extracellular solution from 9.0 to 4.5. The displayed traces are representative recordings obtained in the whole-cell configuration at −80 mV. (A) WT GLIC. In this recording, the current decayed to a zero-current level with a time-constant of ∼0.66 s. This means that it took only ∼3.0 s for the WT current to decay to ∼1% of its peak value. (B) GLIC I9′A. The brief downward current deflections reflect the instability of the membrane during prolonged exposure to pH 4.5; eventually, the seals broke, and the recordings ended. The duration of the pH 4.5 application before the seals broke is indicated for each I9′A trace. Evidently, desensitization is greatly slowed down by the mutation. The time scale is the same for all traces in A and B (with the exception of those in the inset of A).
Figure 8.
Figure 8.
MD simulations of ion permeation through the structural model of the disulfide-reduced GLIC C27S + K33C + I9′A + N21′C mutant. The membrane was bathed by symmetrical 150 mM KCl, and the temperature was 37°C. (A) Ion trajectories at −100 mV. (B) Ion trajectories at −200 mV. In A and B, only the trajectories of ions that crossed the membrane are plotted. In these plots, gray areas indicate the regions occupied by the membrane in the periodic-simulation system, and downward transitions of the ion trajectories through these regions represent inward crossings. The darker lines are running averages of the data, which are displayed in a lighter shade. The length of the simulation box along the z-axis was 108 Å. (C) Pore-radius profiles (estimated using HOLE [Smart et al., 1996]) of structural models of the disulfide-reduced quadruple mutant. The profile of the crystal-structure model (PDB ID code 5V6N; this work) is compared with those computed during the ion-permeation MD simulations illustrated in A and B. (D) Current–voltage relationship from simulations performed at −100, −200, and −500 mV; ion trajectories at −500 mV, and the corresponding MD pore-radius profile, are shown in Fig. S2. (E) Pore-radius profiles of structural models of the closed-channel conformation. The profile of the crystal-structure model (PDB ID code 4LMK; Gonzalez-Gutierrez et al., 2013) is compared with that computed during an ion-permeation MD simulation at −100 mV. In C and E, ion-permeation-MD pore-radius profiles are mean profiles—displayed as the mean (darker lines) ± 1 SD (lighter shade)—calculated from the different frames of each simulation; the vertical axes extend, approximately, between M2 positions −3′ (bottom) and 21′ (top). Side-chain rotamers were optimized using SCWRL4 (Krivov et al., 2009) before the ion-permeation simulations were run.
Figure 9.
Figure 9.
MD simulations of ion permeation and block through the structural model of the glycine-bound α1 GlyR. The membrane was bathed by symmetrical 150 mM NaCl, and the temperature was 37°C. (A) Ion trajectories at −100 mV. For clarity of display, the trajectories of the 36 Cl that crossed the membrane at least once in the simulated 180 ns were displayed in three separate panels. (B) Pore-radius profiles (estimated using HOLE [Smart et al., 1996]) of structural models of the glycine-bound GlyR. The profile of the cryo-EM-structure model (PDB ID code 3JAE) is compared with that computed during the ion-permeation MD simulation illustrated in A. The latter is the mean profile—displayed as the mean (darker lines) ± 1 SD (lighter shade)—calculated from the different frames of the simulation; the vertical axis extends, approximately, between M2 positions −3′ (bottom) and 21′ (top). Side-chain rotamers were optimized using SCWRL4 (Krivov et al., 2009) before the ion-permeation simulation was run. (C) Stick representation of the molecule of picrotoxinin (C15H16O6); carbon atoms are cyan, oxygens are red, and hydrogens are white. The mesh representation shows the solvent-accessible surface of the toxin calculated using a 1.5-Å probe radius and with van der Waals radii taken from HOLE (Smart et al., 1996) parameter file simple.rad. (D) Ion trajectories at −100 mV computed for the glycine-bound GlyR model with a molecule of picrotoxinin placed in the pore. In A and D, only the trajectories of ions that crossed the membrane are plotted. In these plots, gray areas indicate the regions occupied by the membrane in the periodic-simulation system, and upward transitions of the ion trajectories through these regions represent outward crossings. The darker lines are running averages of the data, which are displayed in a lighter shade. The length of the simulation box along the z-axis was 95.5 Å. (E) Snapshot from the ion-permeation MD simulation of the 3JAE model at −100 mV with a molecule of picrotoxinin placed in the pore. The permeation trajectory of a Cl ion is shown as green spheres. The molecule of picrotoxinin is shown in van der Waals representation, and the 30% water-occupancy isosurface is shown as transparent shapes. For clarity, only two nonadjacent chains are shown.
Figure 10.
Figure 10.
MD simulations of ion permeation and block through the structural model of the glycine-and-ivermectin–bound α1 GlyR. (A) Ion trajectories at −100 mV through an expanded version of the cryo-EM-structure model (PDB ID code 3JAF) obtained using grid-steered MD (Wells et al., 2007). The membrane was bathed by symmetrical 150 mM NaCl, and the temperature was 37°C. Only the trajectories of ions that crossed the membrane are plotted. Gray areas indicate the regions occupied by the membrane in the periodic-simulation system, and upward transitions of the ion trajectories through these regions represent outward crossings. The darker lines are running averages of the data, which are displayed in a lighter shade. The length of the simulation box along the z-axis was 84 Å. (B) Single-channel current–voltage relationships of the (full-length) rat α1 GlyR at ∼22°C. The recordings were obtained in the cell-attached patch-clamp configuration from transiently transfected HEK-293 cells. The pipette solution contained ∼150 mM Cl. Taurine is a partial agonist of the α1 GlyR, whereas glycine is a full agonist. (C) Pore-radius profiles (estimated using HOLE [Smart et al., 1996]) of structural models of the glycine-and-ivermectin–bound GlyR. The profile of the cryo-EM-structure model is compared with those computed during MD simulations of ion permeation through a partially expanded version and the expanded version of the 3JAF model. Ion-permeation-MD pore-radius profiles are mean profiles—displayed as the mean (darker lines) ± 1 SD (lighter shade)—calculated from the different frames of each simulation; the vertical axis extends, approximately, between M2 positions −3′ (bottom) and 21′ (top). Side-chain rotamers were optimized using SCWRL4 (Krivov et al., 2009) before the ion-permeation simulations were run. IVM, ivermectin. (D) Cα profiles of the cryo-EM-structure model and the expanded version. For clarity, the Cα profile of the partially expanded model was omitted; it lies somewhere in between those displayed. In the case of the expanded 3JAF model, the profile was calculated for a randomly chosen frame of the ion-permeation MD simulation. The five subunits of each model were averaged. Error bars (omitted if smaller than the symbols) are standard errors. Solid lines are cubic-spline interpolations. The lumen of the pore is to the right of the plot. (E) Snapshot from the ion-permeation MD simulation of the expanded model at −100 mV with a molecule of picrotoxinin placed in the pore. No ion crossings were recorded through this system. The molecule of picrotoxinin is shown in van der Waals representation, and the 30% water-occupancy isosurface is shown as transparent shapes. For clarity, only two nonadjacent chains are shown.
Figure 11.
Figure 11.
The open-channel structural model of the Torpedo AChR in the context of other structures. Cα profiles of the indicated structural models. The five subunits of each model were averaged. Error bars (omitted if smaller than the symbols) are standard errors. Solid lines are cubic-spline interpolations. In the case of the Torpedo AChR, we applied a residue-numbering correction that accounts for the mis-threading of the amino-acid sequence in the original model (Mnatsakanyan and Jansen, 2013). The lumen of the pore is to the right of the plot.

References

    1. Auerbach A., and Sachs F.. 1983. Flickering of a nicotinic ion channel to a subconductance state. Biophys. J. 42:1–10. 10.1016/S0006-3495(83)84362-8 - DOI - PMC - PubMed
    1. Basak S., Schmandt N., Gicheru Y., and Chakrapani S.. 2017. Crystal structure and dynamics of a lipid-induced potential desensitized-state of a pentameric ligand-gated channel. eLife. 6:e23886 10.7554/eLife.23886 - DOI - PMC - PubMed
    1. Beato M., Groot-Kormelink P.J., Colquhoun D., and Sivilotti L.G.. 2004. The activation mechanism of α1 homomeric glycine receptors. J. Neurosci. 24:895–906. 10.1523/JNEUROSCI.4420-03.2004 - DOI - PMC - PubMed
    1. Beckstein O., and Sansom M.S.. 2003. Liquid-vapor oscillations of water in hydrophobic nanopores. Proc. Natl. Acad. Sci. USA. 100:7063–7068. 10.1073/pnas.1136844100 - DOI - PMC - PubMed
    1. Beckstein O., and Sansom M.S.. 2004. The influence of geometry, surface character, and flexibility on the permeation of ions and water through biological pores. Phys. Biol. 1:42–52. 10.1088/1478-3967/1/1/005 - DOI - PubMed

MeSH terms

Substances

LinkOut - more resources