. 2017 Oct 31;8(1):1212.
doi: 10.1038/s41467-017-01422-6.

Systematic proteome and proteostasis profiling in human Trisomy 21 fibroblast cells

Affiliations

Systematic proteome and proteostasis profiling in human Trisomy 21 fibroblast cells

Yansheng Liu et al. Nat Commun. .

Abstract

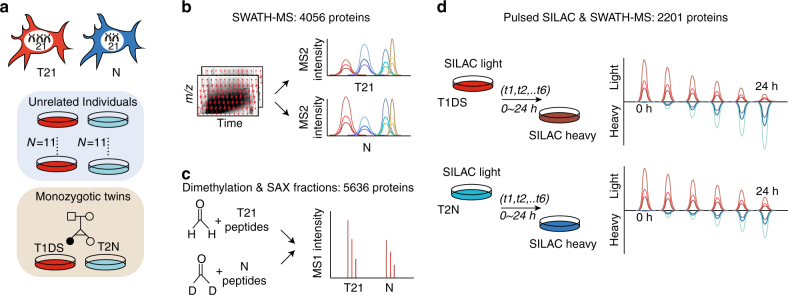
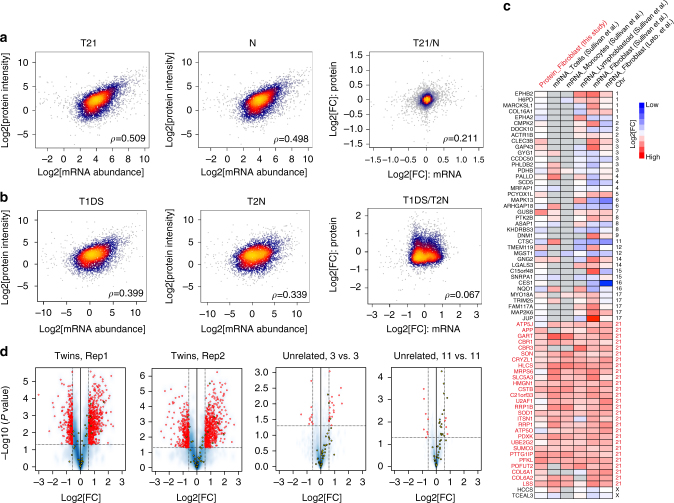
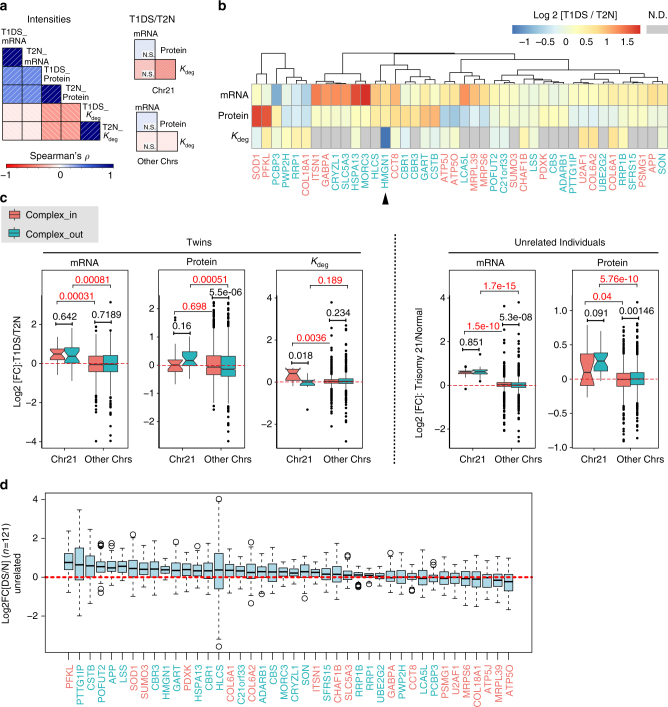
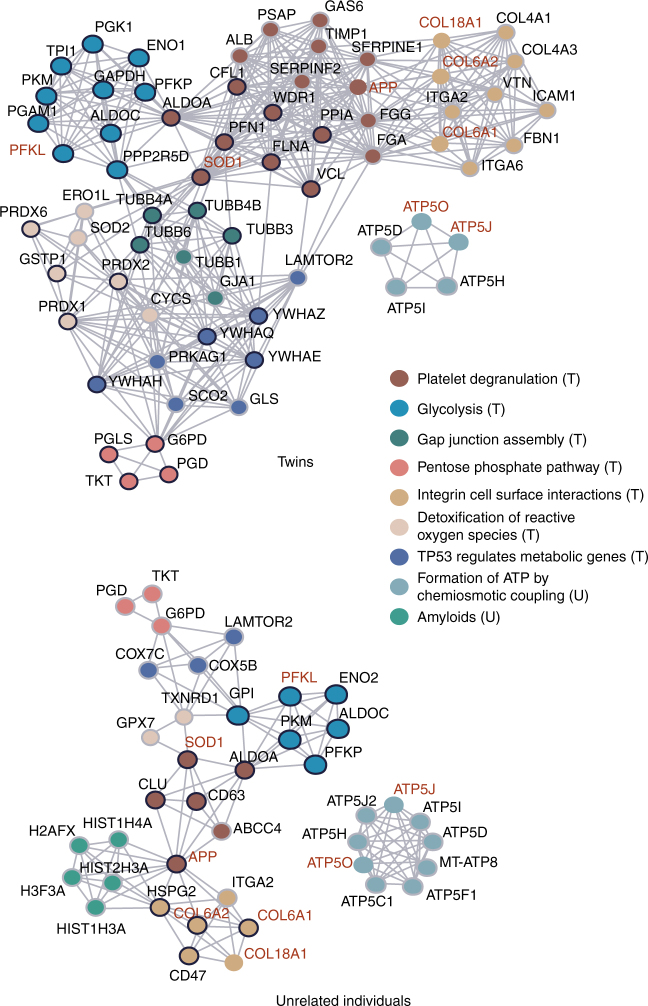
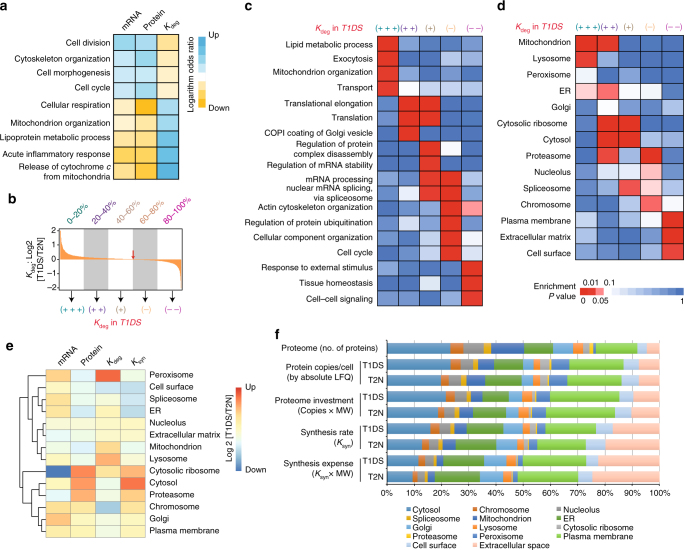
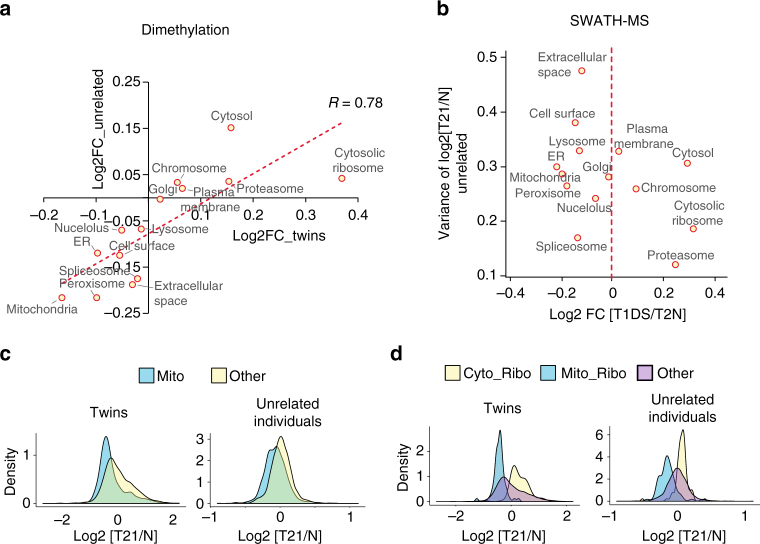
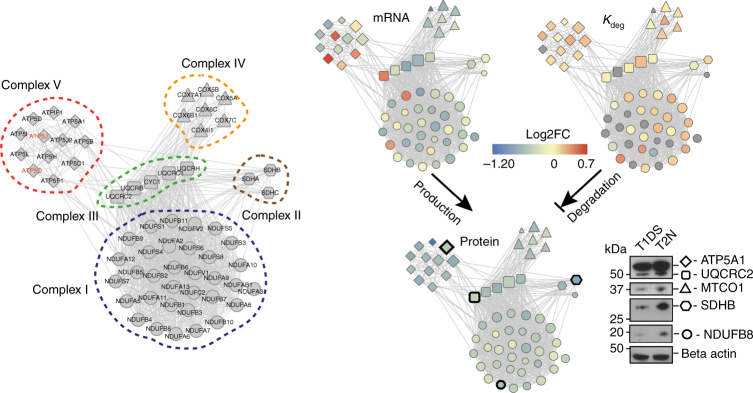
Down syndrome (DS) is mostly caused by a trisomy of the entire Chromosome 21 (Trisomy 21, T21). Here, we use SWATH mass spectrometry to quantify protein abundance and protein turnover in fibroblasts from a monozygotic twin pair discordant for T21, and to profile protein expression in 11 unrelated DS individuals and matched controls. The integration of the steady-state and turnover proteomic data indicates that protein-specific degradation of members of stoichiometric complexes is a major determinant of T21 gene dosage outcome, both within and between individuals. This effect is not apparent from genomic and transcriptomic data. The data also reveal that T21 results in extensive proteome remodeling, affecting proteins encoded by all chromosomes. Finally, we find broad, organelle-specific post-transcriptional effects such as significant downregulation of the mitochondrial proteome contributing to T21 hallmarks. Overall, we provide a valuable proteomic resource to understand the origin of DS phenotypic manifestations.


Conflict of interest statement

The authors declare no competing financial interests.

Figures

Fig. 1
Fig. 1
Proteome and proteostasis investigation on T21 fibroblast cells. a Fibroblast cells collected from a pair of monozygotic (MZ) twins discordant for Trisomy 21 (T21), together with 11 unrelated T21 individuals bearing Down syndrome (DS) and 11 unrelated controls were used for analyzing the effect of T21. T1DS and T2N denote the T21 and normal twin used. b A reproducible and accurate data-independent acquisition mass spectrometry (DIA-MS) was used in conjunction with a massively parallel targeted data analysis strategy of SWATH-MS to profile the proteomes. c A dimethylation labeling-based shotgun proteomics was used to measure protein abundance change in T21 and N sample mixtures. SAX strong anion exchanger. d A pulse SILAC (pSILAC) experiment determines the protein degradation and turnover rates in T1DS and T2N, respectively, across 6 time points over 24 h
Fig. 2
Fig. 2
Global and significant post-transcriptional regulations revealed by proteomic data. a Correlation analysis between mRNA abundance and total protein levels upon T21 revealed a moderate correlation across levels, and weak association regarding cross-layer effects of T21, reflected by matching unrelated samples. b Same analysis to a but in twin samples. c T21 transcript signatures discovered in fibroblast cells of Sullivan et al. are conserved between cell types and impact protein levels. d Volcano plots were generated for twin samples (three aliquots of T1DS vs. three aliquots of T2N), three pairs of T21, and N samples (unrelated) and the whole unrelated sample set (11 T21 vs. 11 N). Rep1 and Rep2 mean two independent twin cell cultures. Red circles denote significant proteins of >1.5-fold change (FC) at P < 0.05 (Student’s t test). The highlighted yellow circles denote Chr21 proteins
Fig. 3
Fig. 3
Chr21 protein expression and primary dosage compensation. a Correlation analysis between absolute and relative changes between mRNA, protein, K deg for global proteome, proteins encoded by Chr21 and other chromosomes. N.S., not significant. b Hierarchically clustered heatmap of FC for mRNA, protein, and K deg. The red and green colors represent “complex_in” and “complex_out” groups, respectively. N.D., not detected. c The dosage compensation against aneuploidy through protein complex stoichiometry control remained apparent at mRNA, protein, and K deg data levels, and is confirmed by the samples from unrelated individuals. N = 18 and 24 for complex_in and complex_out groups from Ch21 and N = 1906 and 2068 for those from other chromosomes (Other Chrs). d Binary log2 fold changes (N = 121 comparisons) of Chr21 protein expressions between unrelated individuals. The red and green colors represent “complex_in” and “complex_out” groups. In all box plots (Methods), the borders represent the 25th and 75th quantile, respectively, and the bold bar represents the 50th quantile. Wilcox test was used to infer P-values. Standard gene symbols are used, with corresponding SwissProt IDs listed in Supplementary Data 2
Fig. 4
Fig. 4
Significantly regulated proteins and their network associated to T21. Proteins in the reactome pathways that were found to be significantly enriched (P < 0.01, see Methods for details) are represented as a network graph, where edges indicate functional connections, i.e., links between proteins in same reactome pathways. Nodes represent individual proteins and these are colored according to a dominant reactome pathway annotation. If the protein is upregulated, its node border is black, if it is downregulated it is light gray. Names of the proteins encoded by the genes on the chromosome 21 are shown in red
Fig. 5
Fig. 5
Extent of protein degradation reveals organelle-related gradients in T21. a Selected significant, overlapping biological processes after GESA analysis at mRNA, protein, and K deg levels. The logarithm odds ratios (LOR) were visualized on a red–blue color scale, with blue color denoting LOR > 0 (i.e., T1DS gene products are under represented) and red denoting LOR < 0 (i.e., T1DS products are over-represented). b The five classes of proteins based on K deg regulation extent. The red arrow denotes zero K deg regulation. c The ranked list of protein degradation regulation under T21 stress was divided into five segments of proteins for which GO biological processes enriched in each segment were selected and displayed. d Cellular components annotation and enrichment analysis indicates the extent to which protein degradation forms an organelle-related gradient in T21. e The transcript, protein, protein degradation, and protein synthesis FC of all the proteins annotated in each organelle were averaged for hierarchical clustering analysis. f Comparing the number of proteins, absolute protein copies, protein investment, and synthesis expense for different organelles in T1DS and T2N, respectively. K deg protein degradation rate, K syn synthesis rate
Fig. 6
Fig. 6
Inter-individual variability of organelle proteome alternations induced by T21. a High correlation of organelle proteome regulation trends between twins and unrelated samples. b The correlation between log2 T1DS/T2N ratios for each organelle and the inter-individual variability of T21/normal FC using unrelated samples. ER, endoplasmic reticulum. c The distribution of T21/normal ratios of mitochondrial proteins and other proteins in the proteome, for twin samples and unrelated individuals. d The distribution of T21/normal ratios of cytosolic ribosome proteins (Cyto_Ribo), mitochondrial ribosome proteins (Mito_Ribo), and other proteins in the proteome, for twin samples and unrelated individuals
Fig. 7
Fig. 7
Co-regulation of mitochondrial protein complexes in T21. Co-regulation of mitochondrial complexes starts at the transcriptional level and gets uniform at protein level through protein level regulation and protein degradation processes. Proteins belonging to Complexes I–V are visualized by the nodes with shapes of circle, hexagon, rectangle, triangle, and diamond, respectively. The edges between nodes denote high-confidence protein interactions documented in STRING database (minimal combined score >0.45). In the visualization panels of mRNA, protein, and K deg comparisons, the node size is proportional to the log10 scale transformed protein copies. The color gradient of blue–yellow–red depicts the log2 T1DS/T2N FC values. Standard gene symbols are used, with corresponding Swissprot IDs listed in Supplementary Data 2. The Western blots were performed for selected proteins in each mitochondrial protein complex, confirming their downregulations in T1DS

References

    1. Antonarakis SE, Lyle R, Dermitzakis ET, Reymond A, Deutsch S. Chromosome 21 and Down syndrome: from genomics to pathophysiology. Nat. Rev. Genet. 2004;5:725–738. doi: 10.1038/nrg1448. - DOI - PubMed
    1. Ait Yahya-Graison E, et al. Classification of human chromosome 21 gene-expression variations in Down syndrome: impact on disease phenotypes. Am. J. Hum. Genet. 2007;81:475–491. doi: 10.1086/520000. - DOI - PMC - PubMed
    1. Sultan M, et al. Gene expression variation in Down’s syndrome mice allows prioritization of candidate genes. Genome Biol. 2007;8:R91. doi: 10.1186/gb-2007-8-5-r91. - DOI - PMC - PubMed
    1. Prandini P, et al. Natural gene-expression variation in Down syndrome modulates the outcome of gene-dosage imbalance. Am. J. Hum. Genet. 2007;81:252–263. doi: 10.1086/519248. - DOI - PMC - PubMed
    1. Sullivan, K. D. et al. Trisomy 21 consistently activates the interferon response. eLife5, e16220 (2016). - PMC - PubMed

Publication types