. 2017 Oct 31;8(1):1229.
doi: 10.1038/s41467-017-01335-4.

Functional mapping of brain synapses by the enriching activity-marker SynaptoZip

Affiliations

Functional mapping of brain synapses by the enriching activity-marker SynaptoZip

Mattia Ferro et al. Nat Commun. .

Abstract

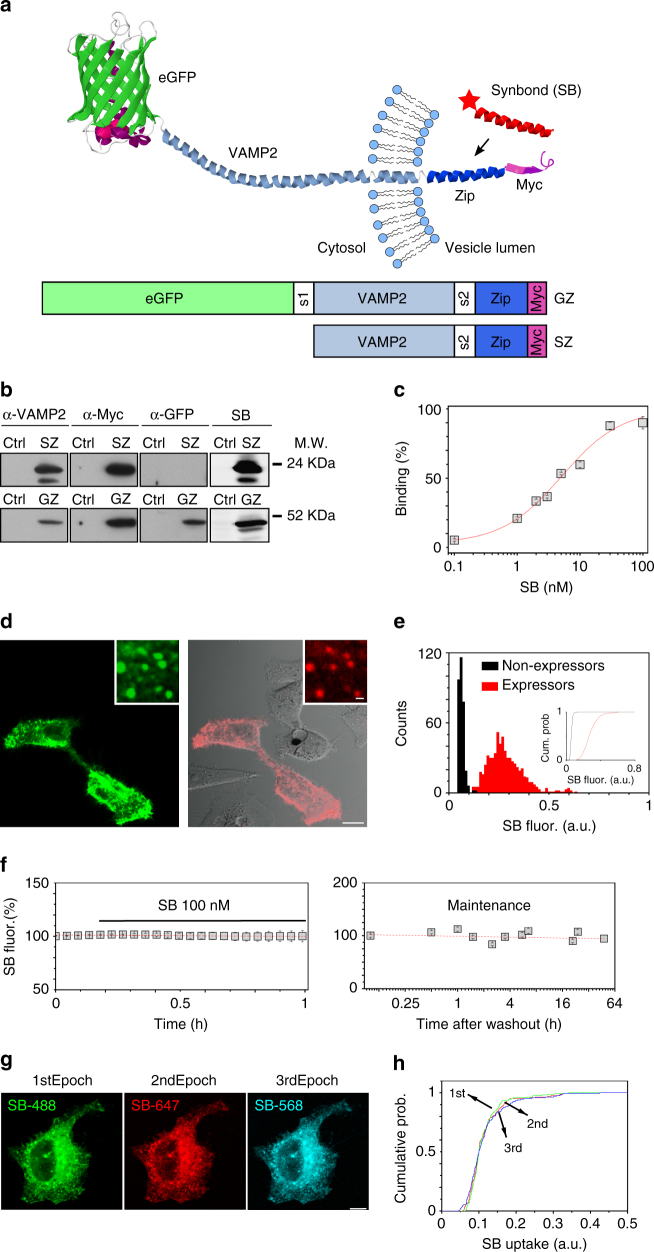
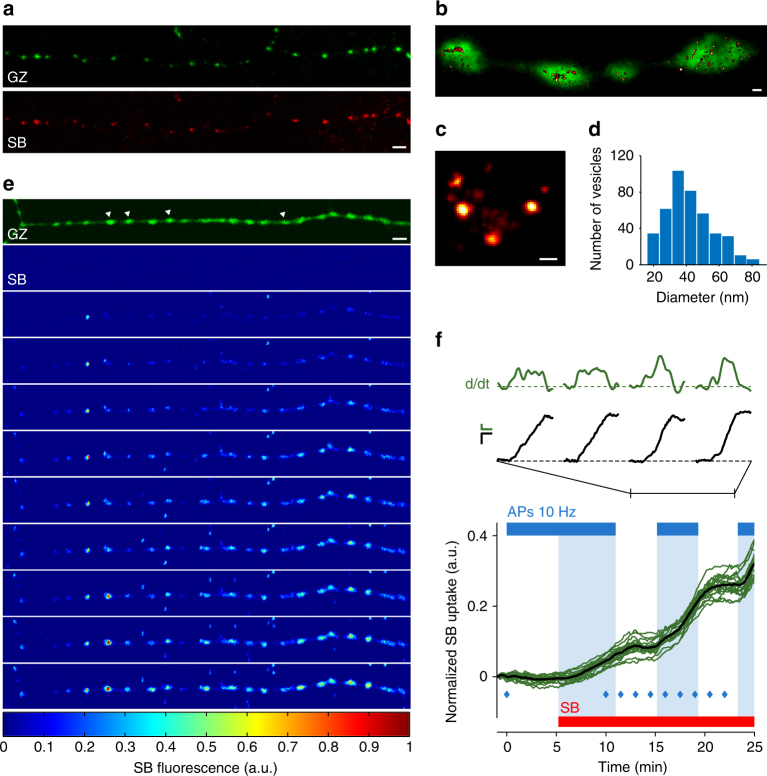
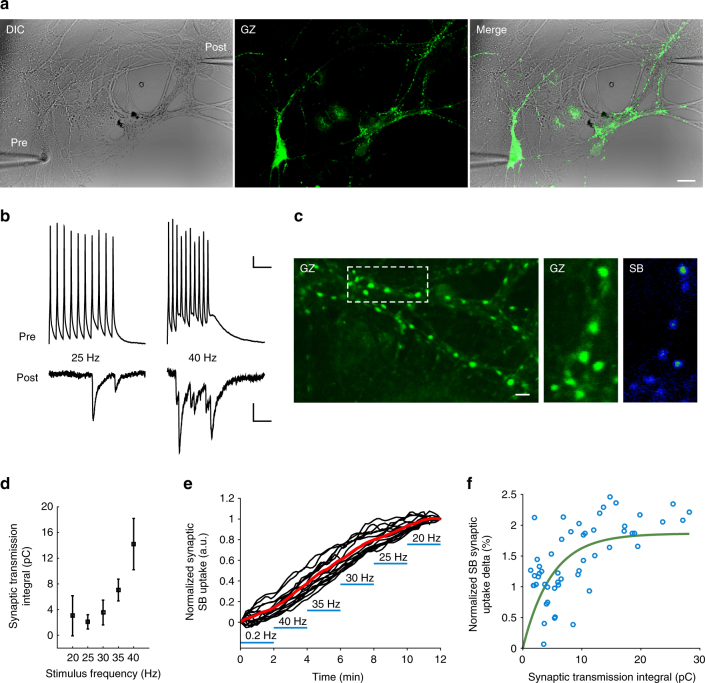
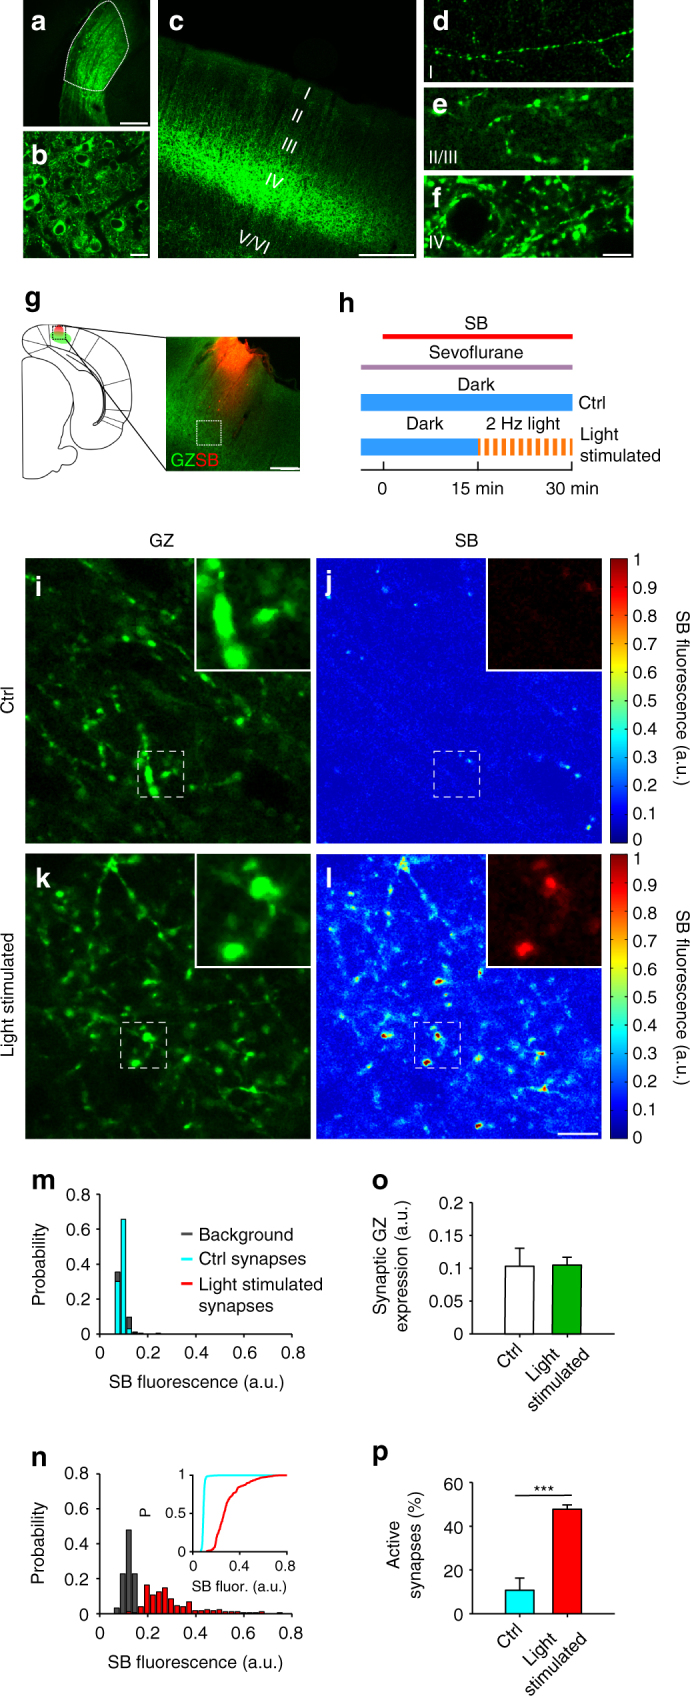
Ideally, elucidating the role of specific brain circuits in animal behavior would require the ability to measure activity at all involved synapses, possibly with unrestricted field of view, thus even at those boutons deeply located into the brain. Here, we introduce and validate an efficient scheme reporting synaptic vesicle cycling in vivo. This is based on SynaptoZip, a genetically encoded molecule deploying in the vesicular lumen a bait moiety designed to capture upon exocytosis a labeled alien peptide, Synbond. The resulting signal is cumulative and stores the number of cycling events occurring at individual synapses. Since this functional signal is enduring and measurable both online and ex post, SynaptoZip provides a unique method for the analysis of the history of synaptic activity in regions several millimeters below the brain surface. We show its broad applicability by reporting stimulus-evoked and spontaneous circuit activity in wide cortical fields, in anesthetized and freely moving animals.


Conflict of interest statement

The authors declare no competing financial interests.

Figures

Fig. 1
Fig. 1
Design and characterization of SynaptoZip. a Cartoon depicting the reporter system; box diagrams illustrate SZ moieties. S1, S2: spacer sequences; Zip: Acid-p1. b WB of transfected (GZ, SZ) and non-transfected (Ctrl) Hela cells, detection with anti-VAMP2, anti-Myc epitope tag, anti-GFP antibodies, and with SB-Alexa647 (see also Supplementary Fig. 1a). c Analysis of Zip-Bond binding in live Hela cells (the red line is the logistic fitting, adj. R 2 = 0.98, K d = 5.09 nM; N 0.1nM = 38, N 1nM = 65, N 2nM = 45, N 3nM = 80, N 5nM = 59, N 10nM = 39, N 30nM = 48, N 100nM = 36; mean ± s.e.m.). d SB uptake in a mixture of transfected and non-transfected Hela cells (green, eGFP; red, SB and DIC image; SB 5 nM, 1 h incubation). e Histograms of SB fluorescence and their cumulative representation (Inset; N = 320, non-expressing cells; N = 636, GZ-expressing cells; SBexpr = 0.284 ± 0.089, SBnon-expr = 0.063 ± 0.014, mean ± SD; p < 0.01, KS test). f Analysis of the fate of internalized SB in SZ-expressing Hela cells. Left, internalized SB-Alexa647 was not displaced by excess of SB-Alexa488 (time-lapse imaging, N = 6; mean ± s.e.m.). Right, vesicular SB remains up to 48 h from extracellular washout (N 5min = 71, N 0.5h = 60, N 1h = 47, N 1.5h = 60, N 2.5h = 53, N 3.5h = 73, N 5.5h = 42, N 6.5h = 39, N 21h = 37, N 24h = 50, N 48h = 47; mean ± s.e.m.). g Hela cells expressing non-fluorescent SZ were incubated sequentially with SB-Alexa488, SB-Alexa647, SB-Alexa568. h Cumulative histograms of cell fluorescence from N = 92 cells as in g, illustrating the labeling similarity among the epochs (p ≥ 0.26; KS test). Scale bars, 10 μm, 1 μm inset (d) and 10 μm (g)
Fig. 2
Fig. 2
Synaptic expression of SynaptoZip and activity-dependent uptake of SB. a Presynaptic boutons expressing GZ (green) in acute hippocampal slices (Schaffer collateral, CA1). Slices were bathed with SB (red; SB 5 nM, 5 min, 24 °C, 30 mM isosmotic KCl). bd Super-resolution microscopy of cultured CA3-CA1 hippocampal synapses. b Presynaptic boutons expressing GZ (green), with superimposed labeled synaptic vesicles, after spontaneous uptake of SB (hot red LUT; SB 5 nM; 60 min incubation, 37 °C). c Magnified view of synaptic vesicles loaded with SB. d Analysis of vesicles diameter following spontaneous uptake of SB (N = 428 SB-labeled vesicles from 24 synapses; 41.2 ± 16.2, mean ± SD). e, f Time-lapse imaging of SB uptake (SB 5 nM, 24 °C; color map, LUT at the bottom) in a group of boutons along a single axon (cultured hippocampal CA3–CA1 neurons), before and during trains of presynaptic action potentials (APs). In f, green lines are normalized SB uptake time series for N = 18 individual boutons (same experiment as in e; thick black line is the average SB uptake trace; blue diamonds correspond to time frames shown in e). The red bar refers to the presence of SB 5 nM in the bath, the blue bar indicates the stimulation epochs (trains of 10 AP at 10 Hz inter-leaved with 4 s pauses). Pale blue areas signal the occurrence of stimulation when SB is present. On top of graph, expanded traces to illustrate SB uptake (black lines; scale bar: 0.05 a.u. vs. 2 min) from 4 out of the 18 boutons (indicated by white arrowheads in e, GZ), and its rate (green lines, time derivative; scale bar: 0.05 a.u. h−1 vs. 2 min), during the second stimulation epoch. Notice that, despite the common trend, each synapse shows its own SB uptake dynamics. Scale bars: 4.11 µm (a, e), 400 nM (b), 40 nM (c)
Fig. 3
Fig. 3
Synaptic transmission and SB uptake at hippocampal synapses. af Simultaneous electrophysiological and optical recording from a pair of synaptically connected hippocampal neurons (representative experiment from N = 5 pairs). a Images of the pre-synaptic and post-synaptic cells (left, DIC image; middle, in green GZ expression in the presynaptic cell; right, merge). b Evoked trains of action potentials in the presynaptic neuron (top traces) and the corresponding synaptic currents in the postsynaptic cell (lower traces) at two stimulation frequencies (25 and 40 Hz, 10 action potentials per train; trains applied every 5 s). c A subset of synapses, to illustrate reporter expression (GZ) and the effect of action potential trains on SB uptake (SB). d Analysis of the strength of synaptic transmission at different presynaptic stimulation frequencies (20–40 Hz trains as in b), indicating facilitation of EPSC amplitude. e Time-course of SB uptake (normalized for its final value) for N = 18 synapses belonging to the same axon at variable stimulation frequencies. f Percent increment of SB uptake for individual trains and synapses (synaptic charge and SB uptake were averaged over trains at the same stimulation frequency; same synapses shown in e). The green line is the fitting trace with a mono-exponential curve. Notice that the correlation approaches a ceiling for very high postsynaptic current values. Scale bars: 20 µm (a), 10 mV or 25 pA, 100 ms (b), 5 µm (c)
Fig. 4
Fig. 4
Reporting the activation of thalamo-cortical synapses in vivo. a Visual thalamus (dLGN, dashed area) transduced by GZ lentiviral vector. b magnified view of transduced dLGN. c GZ-expressing synapses in V1 cortex. df Magnified views of layers I, II–III, and IV showing GZ-expressing presynaptic boutons. g Illustration (left) and merged fluorescent images (right) of the V1 cortex with sites of GZ expression (green) and SB injection (red; dashed square indicates a typical field for SB uptake analysis; see also Supplementary Figs. 6, 8). h Time flowchart showing SB perfusion, sevoflurane anesthesia, and dark or dark/light exposure visual stimuli. il V1 layer IV from control animals kept in the dark (Ctrl; i, j) or exposed to light-pulses (light stimulated; k, l), showing GZ expression (ik) and SB uptake (jl). Insets are magnified areas from dashed boxes. Color bars on the right are fluorescence LUTs. m, n SB fluorescence histograms for unstimulated control (m; cyan bars; N = 233 synapses and N = 93 neighboring non-GZ+ areas, p ctrl-background = 0.45, KS test) and light stimulated (n; red bars; N = 177 synapses and N = 92 neighboring non-GZ+ areas, p light-background < 0.0001, KS test) GZ-expressing synapses, and for the corresponding background fluorescence (gray bars; same experiments as il). Inset n, cumulative distributions of synaptic SB uptake for data set in m, n (p light-ctrl < 0.0001, KS test). o, p Population data from control and light-stimulated animals for synaptic GZ expression (o; N = 5, p = 0.93; two-samples permutation test) and activity (p; N = 5, p < 0.005; two-samples permutation test). Scale bars: 245 μm (a, c, g), 10 μm (b, df, il)
Fig. 5
Fig. 5
SynaptoZip reveals that ketamine induces a rapid and sustained increase in the activity at mPFC synapses. a Illustration (left) and merged fluorescent image (right) of the mPFC with the sites of GZ expression (green) and SB injection (red; dashed square indicates a typical field for SB uptake analysis; see also Supplementary Figs. 6, 8). b Time flowchart indicating SB delivery, ketamine treatments, and sevoflurane anesthesia (Sevo). ch GZ expression (c, e, g) and SB uptake (d, f, h) in mPFC layer II–III from control (ctrl; c, d), ketamine (e, f), and 72 h ketamine (g, h) groups. Insets: magnified areas showing synapses. Fluorescence LUTs on the right. i Cumulative distributions of SB uptake from GZ-expressing synapses (N ctrl = 216, N ket = 275, N 72hket = 227; p ctrl-ket < 0.0001, p ctrl-72hket < 0.0001; p ket-72hket = 0.35; KS test, B-H correction; same experiments as in ch). j Population data for normalized SB synaptic uptake from control and ketamine treated groups (N = 6 rats for each condition; p ctrl-ket < 0.01; p ctrl-72hket < 0.05; p ket-72hket = 0.32; two-samples permutation test, B-H correction; see also Supplementary Fig. 12). Scale bars: 100 μm (a), 10 μm (ch)

References

    1. Deisseroth K. Optogenetics: 10 years of microbial opsins in neuroscience. Nat. Neurosci. 2015;18:1213–1225. doi: 10.1038/nn.4091. - DOI - PMC - PubMed
    1. Boyden ES. Optogenetics and the future of neuroscience. Nat. Neurosci. 2015;18:1200–1201. doi: 10.1038/nn.4094. - DOI - PubMed
    1. Lin MZ, Schnitzer MJ. Genetically encoded indicators of neuronal activity. Nat. Neurosci. 2016;19:1142–1153. doi: 10.1038/nn.4359. - DOI - PMC - PubMed
    1. Reiner A, Levitz J, Isacoff EY. Controlling ionotropic and metabotropic glutamate receptors with light: principles and potential. Curr. Opin. Pharmacol. 2015;20:135–143. doi: 10.1016/j.coph.2014.12.008. - DOI - PMC - PubMed
    1. Peron S, Chen T-W, Svoboda K. Comprehensive imaging of cortical networks. Curr. Opin. Neurobiol. 2015;32:115–123. doi: 10.1016/j.conb.2015.03.016. - DOI - PubMed

Publication types