. 2017 Oct 31;8(1):1221.
doi: 10.1038/s41467-017-01355-0.

Pan-cancer analysis of homozygous deletions in primary tumours uncovers rare tumour suppressors

Affiliations

Pan-cancer analysis of homozygous deletions in primary tumours uncovers rare tumour suppressors

Jiqiu Cheng et al. Nat Commun. .

Erratum in

Abstract

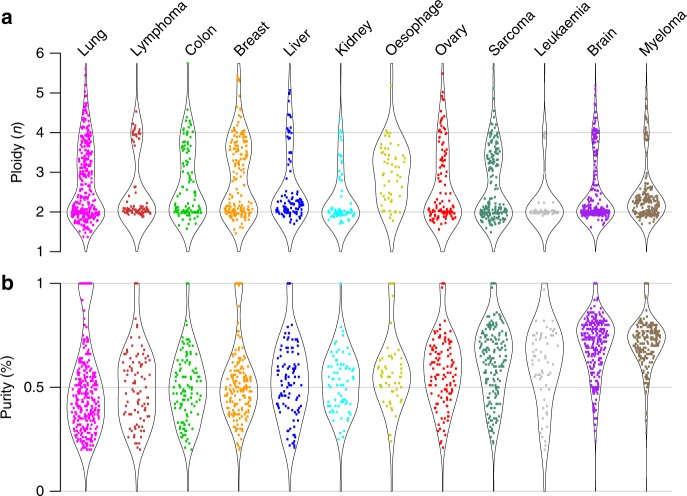
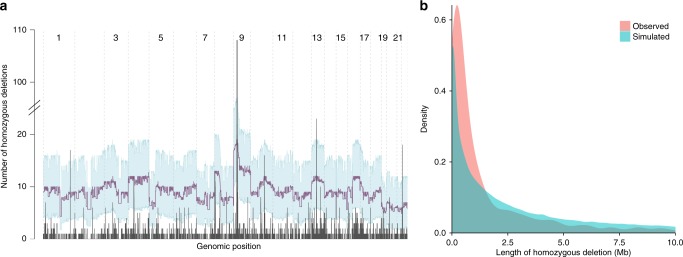
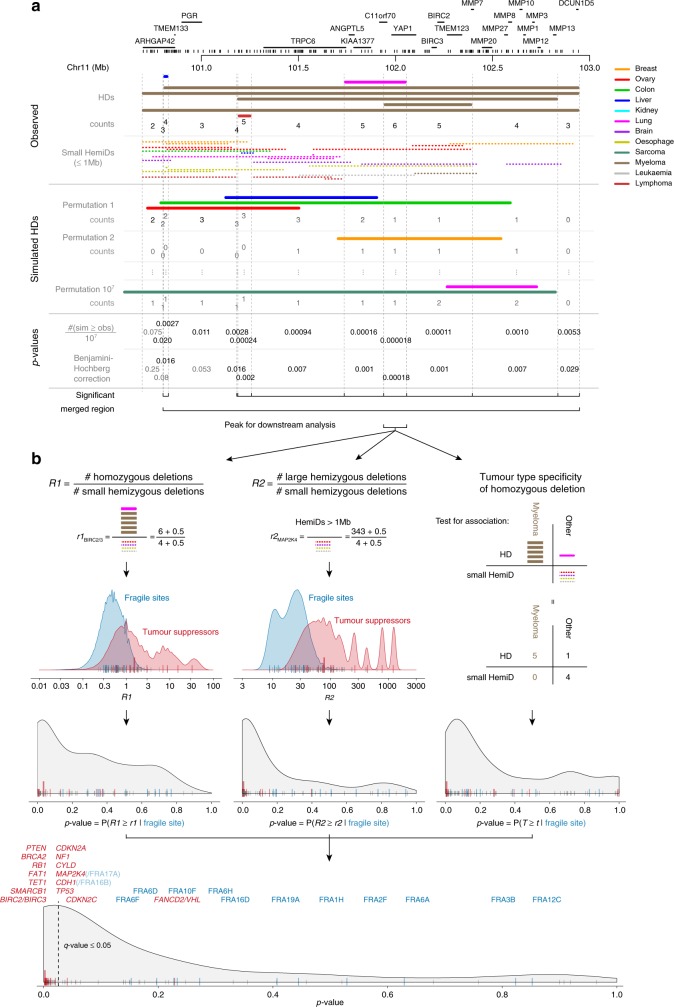
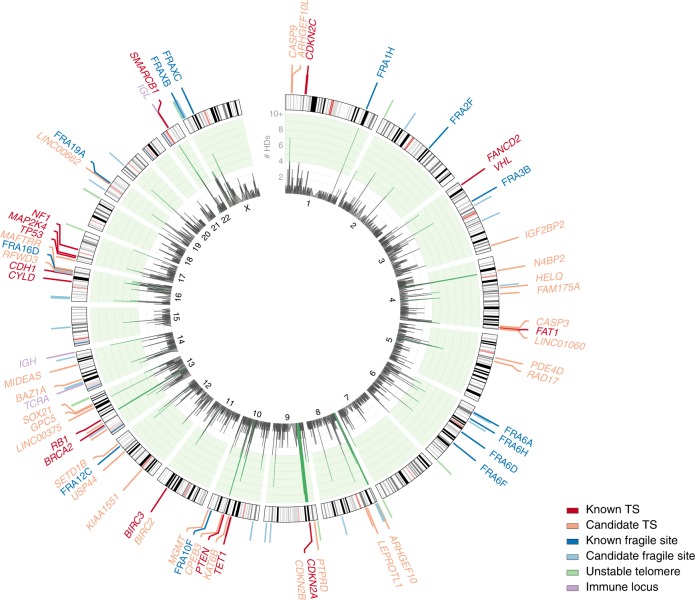
Homozygous deletions are rare in cancers and often target tumour suppressor genes. Here, we build a compendium of 2218 primary tumours across 12 human cancer types and systematically screen for homozygous deletions, aiming to identify rare tumour suppressors. Our analysis defines 96 genomic regions recurrently targeted by homozygous deletions. These recurrent homozygous deletions occur either over tumour suppressors or over fragile sites, regions of increased genomic instability. We construct a statistical model that separates fragile sites from regions showing signatures of positive selection for homozygous deletions and identify candidate tumour suppressors within those regions. We find 16 established tumour suppressors and propose 27 candidate tumour suppressors. Several of these genes (including MGMT, RAD17, and USP44) show prior evidence of a tumour suppressive function. Other candidate tumour suppressors, such as MAFTRR, KIAA1551, and IGF2BP2, are novel. Our study demonstrates how rare tumour suppressors can be identified through copy number meta-analysis.


Conflict of interest statement

K.P.W. is President of Tempus Lab, Inc., Chicago, IL, USA.

Figures

Fig. 1
Fig. 1
Tumour ploidy and purity across cancer types. A total of 2218 cancer samples hybridised to Affymetrix 250K StyI arrays, encompassing cancers arising in 12 broadly defined tissue types, were subjected to ASCAT analysis. ASCAT estimates of a tumour ploidy and b tumour purity are shown. Samples that failed ASCAT analysis (81; 3.6%) and samples that showed little to no copy number aberrations (273; 12.8%) and therefore have less accurate purity estimates are not included in these plots
Fig. 2
Fig. 2
Homozygous deletions are non-randomly distributed across the genome. a Genomic distribution of the frequency of homozygous deletions (dark grey). Permutation test results, modelling homozygous deletions as a combination of two independent loss-of-heterozygosity events, are overlaid (mean and 95% confidence intervals in purple and light blue, respectively), indicating that homozygous deletions are strongly depleted across the genome due to negative selection. b Size distribution of homozygous deletions as observed and as predicted by the model above, indicating stronger negative selection against large homozygous deletions
Fig. 3
Fig. 3
Approach to identify tumour suppressors showing excess homozygous deletions. The approach is illustrated for the BIRC2/BIRC3 locus. a Assessing enrichment of homozygous deletions. The genome is segmented into bins of constant number of observed homozygous deletions by considering all start and end points of every homozygous deletion to be a breakpoint (top). Enrichment is then evaluated over a random model in which the homozygous deletions are shuffled across the genome (permutation strategy 2, middle). For each bin, a p-value is calculated as n/M, where n is the number of permutations resulting in at least as many homozygous deletions in the bin as are observed, and M the total number of permutations (bottom). P-values are adjusted for multiple testing and considered significant when q ≤ 0.05. Neighbouring significant bins are merged when they lie within 1 Mb and share >50% of the underlying homozygous deletions. Within each combined region (96 in total), the peak used for downstream analysis is defined as the largest bin with maximal overlap. b Statistical model to test for local fragility. Two metrics capture the distinct structural signature of deletions in fragile sites when compared to regions harbouring tumour suppressors: (R1) the ratio of homozygous to small (≤1 Mb) hemizygous deletions and (R2) the ratio of large to small hemizygous deletions. Note the addition of pseudocounts to avoid zero values in the denominator. Estimated densities of these metrics for fragile sites and tumour suppressors are shown as well as the values obtained for all peaks, except those on the X chromosome (named fragile sites, blue; known tumour suppressors, red; unknown, grey; BIRC2/BIRC3 large red bar). P-values for all peaks are computed under the fragile site null model density. Tumour-type specificity is the third pillar of the model and is tested in a 2 × 2 table of homozygous vs. small hemizygous deletions in the tumour type with the most deletions vs. the other tumour types combined. P-values from the three tests are combined and adjusted for multiple comparisons. Local fragility is rejected and the presence of a tumour suppressor considered for peaks with q ≤ 0.05
Fig. 4
Fig. 4
Circos plot of peak regions of homozygous deletions. The inner circle shows the frequency of homozygous deletions, peaks of significant enrichment according to our second permutation model (single event) are coloured green. Assigned peak region classes are colour-coded and indicated on the ideogram (see also Fig. 3). Where applicable, the name of the identified named fragile site, immune locus, or the known or proposed tumour suppressor gene is provided
Fig. 5
Fig. 5
Tumours with telomeric losses show more complex (oncogenic) rearrangements. a Maximum CAAI scores, quantifying the presence of regions with complex rearrangements, for tumours with and without (sub)telomeric deletions. The increased genomic complexity in tumours with (hemizygous or homozygous) telomeric deletions is likely the product of breakage-fusion-bridge cycles initiated by these telomeric deletions. bd Examples of amplified oncogenes in regions with high CAAI scores on chromosomes with telomeric deletions
Fig. 6
Fig. 6
Examples of tumour suppressors targeted by homozygous deletions. a Known tumour suppressor PTEN; bd candidate tumour suppressors identified in this study. b KAT6B, c CPEB3, and d MAFTRR. Positions of genes are indicated as well as truncating mutations annotated in COSMIC, coloured according to tumour type and with symbols showing the mutation type. When multiple somatic mutations in the same tumour type are annotated close together in COSMIC, their numbers are shown. Array probe positions are depicted below the genes. The minimal regions of homozygous deletions are shown as bold lines and small hemizygous deletions as dotted lines, both colour-coded by tumour type. Homozygous deletions are unlikely to extend more than two array probe positions beyond the indicated segments (p = 0.015, see Methods)

References

    1. Stratton MR, Campbell PJ, Futreal PA. The cancer genome. Nature. 2009;458:719–724. doi: 10.1038/nature07943. - DOI - PMC - PubMed
    1. Beroukhim R, et al. The landscape of somatic copy-number alteration across human cancers. Nature. 2010;463:899–905. doi: 10.1038/nature08822. - DOI - PMC - PubMed
    1. Greenman C, et al. Patterns of somatic mutation in human cancer genomes. Nature. 2007;446:153–158. doi: 10.1038/nature05610. - DOI - PMC - PubMed
    1. Stephens PJ, et al. The landscape of cancer genes and mutational processes in breast cancer. Nature. 2012;486:400–404. doi: 10.1038/nature11017. - DOI - PMC - PubMed
    1. Lawrence MS, et al. Discovery and saturation analysis of cancer genes across 21 tumour types. Nature. 2014;505:495–501. doi: 10.1038/nature12912. - DOI - PMC - PubMed

Publication types