. 2017 Oct 31;8(1):1204.
doi: 10.1038/s41467-017-01269-x.

Thioredoxin-1 protects against androgen receptor-induced redox vulnerability in castration-resistant prostate cancer

Affiliations

Thioredoxin-1 protects against androgen receptor-induced redox vulnerability in castration-resistant prostate cancer

Govindi J Samaranayake et al. Nat Commun. .

Abstract

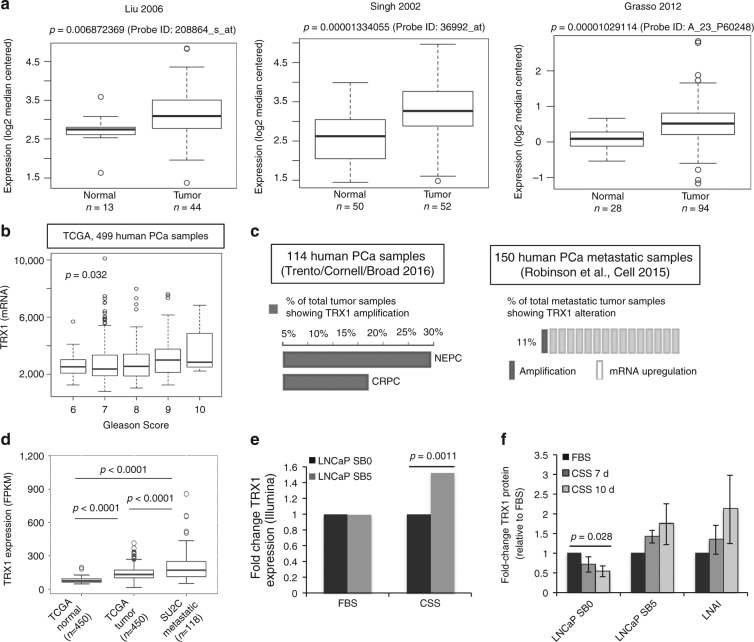
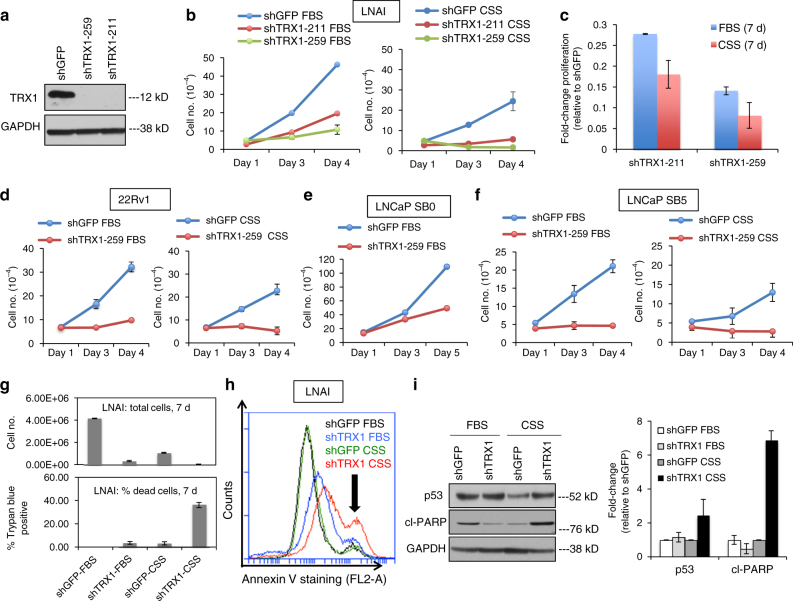
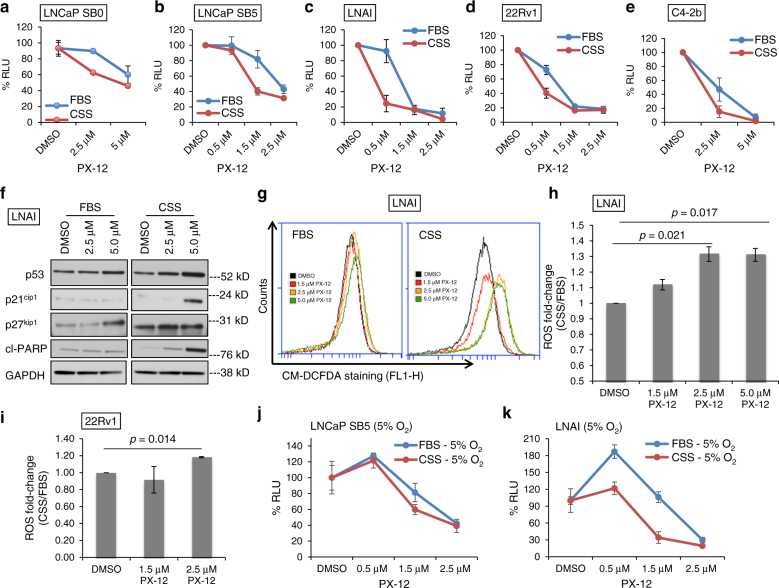
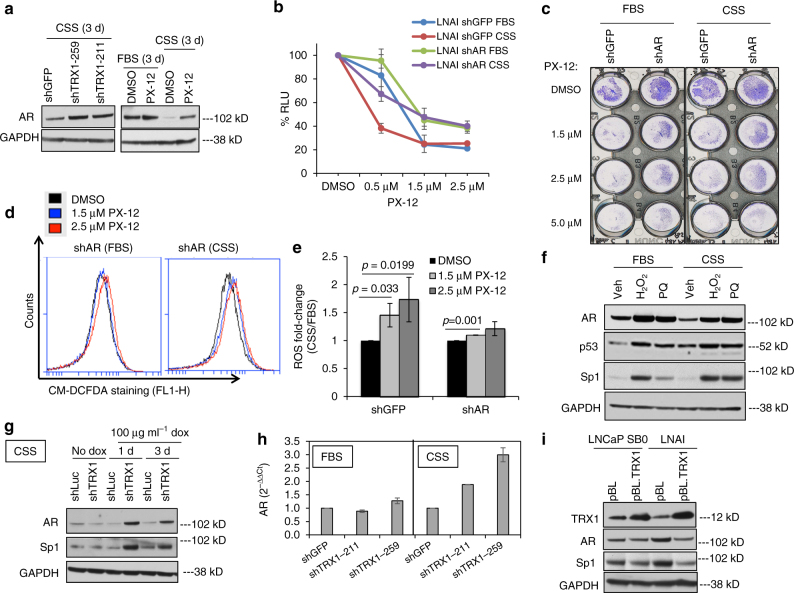
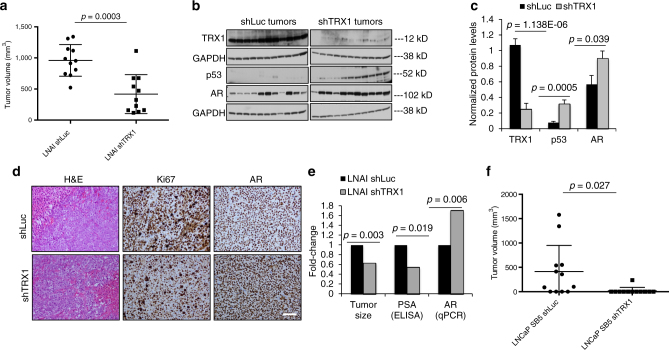
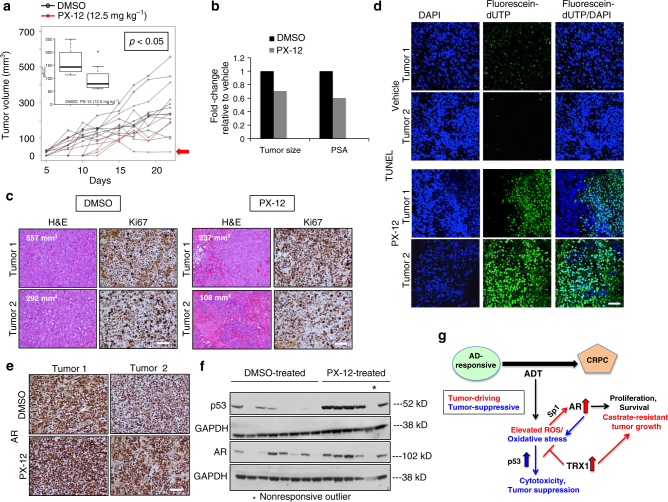
Androgen deprivation (AD) therapy failure leads to terminal and incurable castration-resistant prostate cancer (CRPC). We show that the redox-protective protein thioredoxin-1 (TRX1) increases with prostate cancer progression and in androgen-deprived CRPC cells, suggesting that CRPC possesses an enhanced dependency on TRX1. TRX1 inhibition via shRNA or a phase I-approved inhibitor, PX-12 (untested in prostate cancer), impedes the growth of CRPC cells to a greater extent than their androgen-dependent counterparts. TRX1 inhibition elevates reactive oxygen species (ROS), p53 levels and cell death in androgen-deprived CRPC cells. Unexpectedly, TRX1 inhibition also elevates androgen receptor (AR) levels under AD, and AR depletion mitigates both TRX1 inhibition-mediated ROS production and cell death, suggesting that AD-resistant AR expression in CRPC induces redox vulnerability. In vivo TRX1 inhibition via shRNA or PX-12 reverses the castration-resistant phenotype of CRPC cells, significantly inhibiting tumor formation under systemic AD. Thus, TRX1 is an actionable CRPC therapeutic target through its protection against AR-induced redox stress.


Conflict of interest statement

The authors declare no competing financial interests.

Figures

Fig. 1
Fig. 1
TRX1 expression increases with prostate cancer progression. a TRX1 expression in normal and tumor prostatic tissue from the indicated ONCOMINE datasets. Boxplots represent the five number distribution. The top and bottom of the box indicates the 75th and 25th percentile, respectively. The whisker represents 1.5 times the interquartile range from the box. Number of samples (n) and p-values (determined by a two-tailed Mann–Whitney U test) are as shown. b Analysis of TRX1 expression among advanced, high Gleason-scored tumors from the PCa TCGA provisional dataset, shown as median-centered distribution. The p-value was obtained through the Kruskal–Wallis overall comparison test. c The percentages of samples with TRX1 gene amplification in advanced PCa (CRPC, NEPC) or TRX1 mRNA upregulation (metastatic) from indicated cBioportal datasets. d Comparative differences in TRX1 expression among normal prostatic tissue, AD-responsive PCa, and metastatic PCa from indicated datasets. The pairwise p-values were determined by two-tailed Mann–Whitney U test. e TRX1 mRNA expression under AD in early CRPC LNCaP SB5 relative to their androgen-dependent LNCaP SB0 counterparts. Expression levels were obtained from an Illumina-based microarray analysis of mRNA isolated under androgen-replete (FBS) or androgen-deprived (CSS) culture with samples run in triplicate. The ordinate represents the fold-change in TRX1 expression in SB5 cells relative to SB0, in the indicated categories. The p-value is FDR-adjusted. f Quantitation of TRX1 protein expression from three independent western blots comparing androgen-dependent LNCaP (SB0), and its CRPC counterparts, LNCaP SB5, and LNAI cells under the indicated conditions. Fold-changes in protein expression relative to baseline (FBS) TRX1 expression per cell line are shown. Error bars represent ± SEM. The p-value was determined through a two-tailed Student’s t-test
Fig. 2
Fig. 2
TRX1 suppression inhibits CRPC cell proliferation and promotes AD-associated cell death. a Western blot validation of shRNA constructs in LNAI. Blot was run using 10 μg of total protein lysate. b TRX1 suppression-mediated effects on cell growth in LNAI, under androgen-replete (FBS) or androgen-deprived (CSS) conditions. Cells were plated at an initial density of 5 × 104 and counted on the indicated days. c Relative change in LNAI cell numbers following 7 days of culture. Numbers from the indicated samples were normalized to shGFP values (=1) to show the relative degree of growth defect by TRX1 suppression under FBS or CSS culture. d TRX1 suppression-mediated effects on cell growth in the 22Rv1 CRPC line. Cells were plated and processed as in (b). e TRX1 suppression produces a lesser degree of growth inhibition in the androgen-responsive LNCaP SB0 line relative to LNAI. Cells were plated at an initial density of 1.5 × 105. f Progression to CRPC sensitizes cells to TRX1 suppression-induced growth defects. LNCaP SB5 (early CRPC) were plated and processed as in (b). These cells are derived from LNCaP SB0 cells in (e). g LNAI cells transduced with shGFP or shTRX1-259 were plated at 5 × 104 cells and cultured for 7 days under either FBS or CSS conditions. Total cell numbers in each category and the corresponding percent total cells stained with Trypan blue are shown. h Annexin V staining to detect apoptotic cells. Staining was carried out in LNAI cells, transduced with either shGFP or shTRX1-259, following 48 h of culture under denoted conditions. A rightward shift and increased peak height (indicated by the arrow) show elevated staining. The flow cytometric profile is representative of two independent experiments. i Western blot of p53 and cl-PARP protein levels. Blots were run using 10 μg of total protein from LNAI cells, following 3 days of culture under the indicated conditions. Relative changes in protein expression from n = 2 blots, from independently established samples, were normalized to shGFP levels under FBS conditions (right). Note that all error bars in this figure represent ± SD
Fig. 3
Fig. 3
The TRX1 inhibitor PX-12 induces ROS-dependent loss of viability in combination with AD. ae Indicated cell lines were treated for 72 h with DMSO or PX-12 doses denoted on the abscissa under either FBS or CSS conditions prior to assessing viability. Data are representative of n = 2, each sample run in triplicate. Error bars represent ± SD. f Western blot of total protein lysates (15 µg) from LNAI cells. Cells were DMSO-treated or PX-12-treated for 48 h in FBS-containing or CSS-containing media. Blots were probed for the indicated proteins. g Flow cytometric profiles of ROS levels from LNAI cells stained with CM-H2DCF-DA following treatment with DMSO or the indicated doses of PX-12 under either FBS or CSS culture for ~6 h. A rightward shift shows elevated staining. Representative of n = 2 experiments. h Quantitation of ROS fold-changes in CSS vs. FBS following PX-12 or DMSO treatment in LNAI cells from (g). FL1-H values for CSS were normalized to the counts under FBS conditions at each dose. Values were taken from two independent measurements of ROS levels, with each sample run in duplicate per measurement. Error bars represent ± SEM. The p-value was determined via a two-tailed Student’s t-test. i Quantitation of ROS fold-changes in CSS vs. FBS following PX-12 or DMSO treatment in 22Rv1 cells. Samples were processed as in (g), data is shown as in (h). Data for (j) and (k) are representative of n = 2 experiments, each sample run in triplicate per experiment. Error bars represent ± SD. j To test low O2 tension on PX-12’s effect on LNCaP SB5 viability, cells were cultured at 5% O2 for 5 days prior to a 72-h treatment with PX-12 or DMSO under FBS or CSS conditions. k To test low O2 tension on PX-12’s effect on LNAI viability, cells were treated as in (j)
Fig. 4
Fig. 4
AR protein levels are elevated under AD by TRX1 suppression and promote PX-12-induced ROS and loss of viability. a Western blotting for AR. Blots were run using 10 μg of total protein lysate from shRNA-transduced (left) and DMSO or 1 µM PX-12-treated (right) LNAI cells under the indicated conditions. b Cell lines were treated for 48 h with the indicated DMSO or PX-12 doses, under FBS or CSS conditions, prior to assessing viability. Data are representative of n = 2 experiments, each sample run in triplicate per independent experiment. Error bars represent ± SD. c Crystal violet staining of LNAI shAR cells for visual assessment of improved survival under 48 h of PX-12 treatment. d Representative flow cytometric profiles of ROS levels from LNAI shAR cells stained with CM-H2DCF-DA. ROS levels were assessed following an ~6-h treatment with DMSO or the indicated doses of PX-12 under FBS or CSS culture. A rightward shift indicates elevated staining. e Quantitation of ROS fold-changes from (d). At each dose, FL-1H values for CSS were normalized to the counts under FBS conditions. Values were taken from n = 2 independent experiments, each sample run in duplicate. Error bars represent ± SEM. The p-values were determined via a two-tailed Student’s t-test. f Western blot of LNAI cells, mock-treated or treated with either 50 µM H2O2 or 250 µM paraquat (PQ) for 24 h. Approximately 20 µg total protein was immunoblotted and probed with the indicated antibodies. g Western blot from total LNAI protein lysates (15 µg) under the indicated time points using doxycycline to induce shRNA expression and probed for AR or Sp1. Note that this blot was run using the same lysates as in Supplementary Fig. 5e. h The indicated samples were analyzed by qPCR and results are represented as fold-change relative to baseline FBS or CSS shGFP values. Fold-changes were calculated from two separate experimental runs, each sample run in triplicate. Error bars represent ± SD. i Western blot of total protein lysates (20 μg) from FBS-cultured LNCaP SB0 and LNAI cells transduced with either the empty pBL vector or TRX1-expressing construct, probed with the indicated antibodies
Fig. 5
Fig. 5
TRX1 depletion limits CRPC tumor formation by LNAI and LNCaP SB5 cells. a Tumor endpoint volumes, at 4 weeks post-injection in castrated male Nu/Nu mice, of LNAI cells transduced with either shLuc or shTRX1 (n = 11 per group). Error bars represent ± SD. The p-value was determined via a two-tailed Student’s t-test. b Western blot of total protein lysates (30 µg) from the indicated groups of LNAI tumors was probed with the described antibodies. Both sets of samples were run under identical conditions and developed concurrently in the same cassette. Loading (GAPDH) is shown for separate runs using the same lysates. Note that the TRX1 blots are deliberately overexposed to show the extent of knockdown in the shTRX1 samples. c Quantitation of signal from all the tumors in each group from (b), normalized to GAPDH. Results are derived from two independent blots and error bars are ± SD. The p-values were determined via a two-tailed Student’s t-test. d H&E staining and immunohistochemical staining for Ki67 or AR from a representative tumor per cohort. The size bar, in white, is relevant for each panel and represents a 100 µm scale. e Fold-changes in indicated parameters for LNAI shTRX1 tumors normalized to shLuc tumor values. The p-values were determined via a two-tailed Student’s t-test. f Tumor endpoint volumes, at 7 weeks post-injection in castrated male Nu/Nu mice, of LNCaP SB5 cells transduced with either shLuc or shTRX1 (n = 12 per group). Error bars represent ± SD. The p-value was determined via a Welch’s t-test due to unequal variances
Fig. 6
Fig. 6
PX-12 treatment reduces CRPC tumor growth by LNAI cells. a PX-12 treatment of castrated male Nu/Nu mice injected with LNAI cells. Mean profiles of tumor growth for each group were obtained using linear mixed model with random intercepts and slopes. Adjusted areas under the curve (aAUCs) are plotted within the inset for the DMSO group (n = 8) and the PX-12-treated group (n = 7). Note that one tumor in the PX-12 group was dropped following outlier analysis via Grubbs’ test. The red arrow denotes a complete responder tumor, which did not recur even after cessation of drug treatment. The p-value was determined via a permutation test of the ratio of the two aAUCs. b Fold-changes in tumor size and PSA levels from PX-12-treated tumors, normalized to values from DMSO-treated tumors. c Representative images of H&E and immunohistochemical staining for Ki67 in the two treatment groups. Two separate tumors per group are shown. Tumor volumes are noted for each tumor sample. Size bars, in white, are relevant for each panel and represent a 100 µm scale. d TUNEL staining to indicate apoptosis. The TUNEL assay was carried out on tissue sections from control and PX-12-treated tumors. Representative staining images of dUTP, DAPI, and co-localized dUTP/DAPI staining are shown for two separate representative tumors in each group. Images were acquired through identical exposures per channel. The size bar, in white, is relevant for each panel and represents a 50 μm scale. e Representative images of immunohistochemical AR staining from the two treatment groups. Two separate tumors per group are shown. The size bar, shown in white, is relevant for each panel and indicates a 100 µm scale. f Western blot of total protein lysates (25 µg) from the indicated LNAI tumor treatment groups. Blots were probed with the denoted antibodies. Both sets of western blots were run and developed under identical conditions. The asterisk denotes the sole non-responder tumor in the treatment group, which is the statistical outlier referenced in (a). g Schematic of AR-induced redox stress as a putative “Achilles’ heel” in CRPC and the protective function of TRX1 in mitigating this stress

References

    1. Harris WP, Mostaghel EA, Nelson PS, Montgomery B. Androgen deprivation therapy: progress in understanding mechanisms of resistance and optimizing androgen depletion. Nat. Clin. Pract. Urol. 2009;6:76–85. doi: 10.1038/ncpuro1296. - DOI - PMC - PubMed
    1. Pienta KJ, Bradley D. Mechanisms underlying the development of androgen-independent prostate cancer. Clin. Cancer Res. 2006;12:1665–1671. doi: 10.1158/1078-0432.CCR-06-0067. - DOI - PubMed
    1. Lim SD, et al. Increased Nox1 and hydrogen peroxide in prostate cancer. Prostate. 2005;62:200–207. doi: 10.1002/pros.20137. - DOI - PubMed
    1. Kumar B, Koul S, Khandrika L, Meacham RB, Koul HK. Oxidative stress is inherent in prostate cancer cells and is required for aggressive phenotype. Cancer Res. 2008;68:1777–1785. doi: 10.1158/0008-5472.CAN-07-5259. - DOI - PubMed
    1. Arbiser JL, et al. Reactive oxygen generated by Nox1 triggers the angiogenic switch. Proc. Natl Acad. Sci. USA. 2002;99:715–720. doi: 10.1073/pnas.022630199. - DOI - PMC - PubMed

Publication types

MeSH terms