. 2017 Oct 31;7(1):14437.
doi: 10.1038/s41598-017-14485-8.

Entropy production selects nonequilibrium states in multistable systems

Affiliations

Entropy production selects nonequilibrium states in multistable systems

Robert G Endres. Sci Rep. .

Abstract

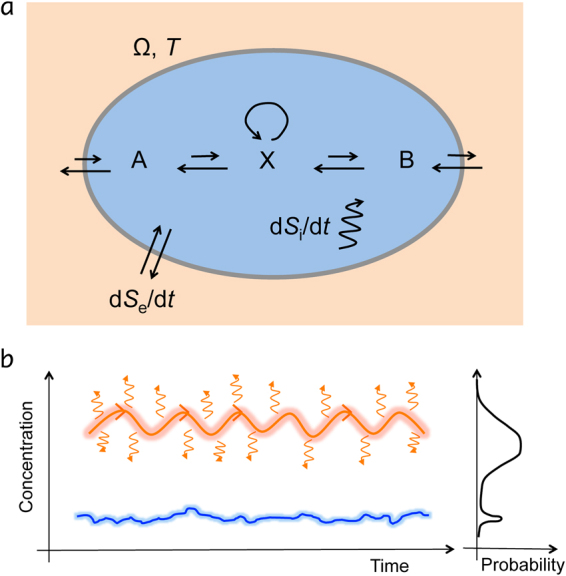
Far-from-equilibrium thermodynamics underpins the emergence of life, but how has been a long-outstanding puzzle. Best candidate theories based on the maximum entropy production principle could not be unequivocally proven, in part due to complicated physics, unintuitive stochastic thermodynamics, and the existence of alternative theories such as the minimum entropy production principle. Here, we use a simple, analytically solvable, one-dimensional bistable chemical system to demonstrate the validity of the maximum entropy production principle. To generalize to multistable stochastic system, we use the stochastic least-action principle to derive the entropy production and its role in the stability of nonequilibrium steady states. This shows that in a multistable system, all else being equal, the steady state with the highest entropy production is favored, with a number of implications for the evolution of biological, physical, and geological systems.


Conflict of interest statement

The authors declare that they have no competing interests.

Figures

Figure 1
Figure 1
Illustration of a driven system with sources of entropy production and flow. (a) Picture of a driven system (similar to Schlögl model) where fluxes of molecular species A and B drive the concentration of species X out of equilibrium. A system is called closed if only energy is exchanged with the surroundings, and open if also matter is exchanged. (For completeness, in an isolated system, there is no exchange at all with the surroundings. In a special case of the latter, everything is included, i.e. the subsystem and its surroundings.) Entropy flow rate dS e/d t across boundary of reaction volume Ω can have contributions from heat and material flow. Entropy production rate dS i/d t is due to processes inside the volume. At steady state, both time-averaged contributions are equal in magnitude but of opposite sign (see text for details). (b) Illustration of the dynamics of a bistable system with a ‘low’ and a ‘high’ molecule-concentration steady state (left). The high state produces high amounts of entropy as indicated by heat radiation, warm glow, directedness and oscillatory fluxes (projected onto the concentration axis), while the low state is cold and close to equilibrium with little entropy production. The hypothesis of MaxEPP is that the state with high entropy production also is the more likely to occur (right).
Figure 2
Figure 2
Appearance of Keizer’s paradox in Schlögl model. (a) Gillespie simulations of Schlögl model for b = 4 and Ω = 10. (b) Histogram of concentration levels for simulation from (a). (c) Bifurcation diagram (steady states) from ODE model (black). Average concentration from master equation for Ω = 10 (red solid line) and Ω = 100 (red dashed line). Quantity bc3.65 represents the critical value (green arrow). (d) Corresponding entropy production rates. Equilibrium dSi/dt=0 occurs for b0=1/6 (blue arrow). (e) Curvature (second spatial derivative) of effective potential from ODE model evaluated at steady state. Vertical grey dashed lines for guiding the eye. Parameters: k+1a=0.5,k1=3, and k+2=k2=1.
Figure 3
Figure 3
MaxEPP in Schlögl model. (a) Values of p(x) from large-Ω limit of master equation evaluated at the low (solid curve) and high (dashed curve) steady states x for different b values. (inset) Weight of states from exact master equation by summing up probabilities for each peak in probability distribution (local minimum between low and high state is separatrix). (b) Distribution p(x) from the exact master equation (red curve), large-Ω limit of the master equation (red dotted curve), and Gaussian approximation (black curve) for low and high states. (c) Entropy production rates calculated for each Gaussian peak. (inset) Entropy productions from exact master equation for each state by summing up contributions for each peak in probability distribution (local minimum between low and high state is separatrix). (a–c) Ω=100. Remaining parameters as in Fig. 3.
Figure 4
Figure 4
Min- and MaxEPPs. Illustration of MinEPP and two different MaxEPP in a semi-log plot of entropy production rate dS/dt versus control parameter b. MinEPP is valid near equilibrium, where dS/dt0. MaxEPP 1 simply states that the more a system is driven away from equilibrium the more entropy is produced. MaxEPP 2 is more subtle, describing how states are selected in a multistable system.

References

    1. Schopf, J. W. (ed.) Life’s Origin (University of California Press, 2002).
    1. Schrödinger. E., What is Life? (Cambridge University Press, 1944).
    1. Yoshida Z, Mahajan SM. “Maximum” entropy production in self-organized plasma boundary layer: A thermodynamic discussion about turbulent heat transport. Phys Plasmas ‘. 2008;15:032307. doi: 10.1063/1.2890189. - DOI
    1. Kawazura Y, Yoshida Z. Comparison of entropy production rates in two different types of s elf-organized flows: Bénard convection and zonal flow. Phys Plasmas. 2012;19:012305. doi: 10.1063/1.3675854. - DOI
    1. Helmholtz H. Zur Theorie der stationären Ströme in reibenden Flüssigkeiten. Wiss. Abh. 1968;1:223–230.

Publication types