. 2017 Nov 1;8(1):1232.
doi: 10.1038/s41467-017-01345-2.

Identifying host regulators and inhibitors of liver stage malaria infection using kinase activity profiles

Affiliations

Identifying host regulators and inhibitors of liver stage malaria infection using kinase activity profiles

Nadia Arang et al. Nat Commun. .

Abstract

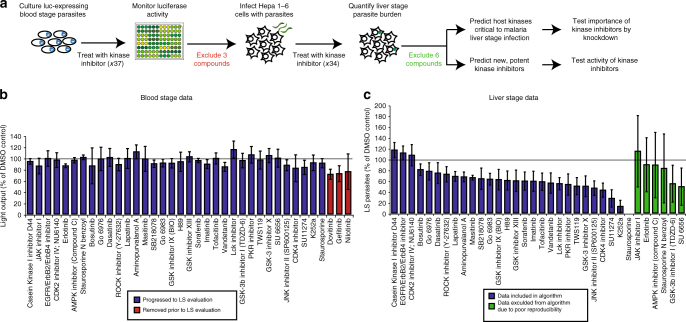
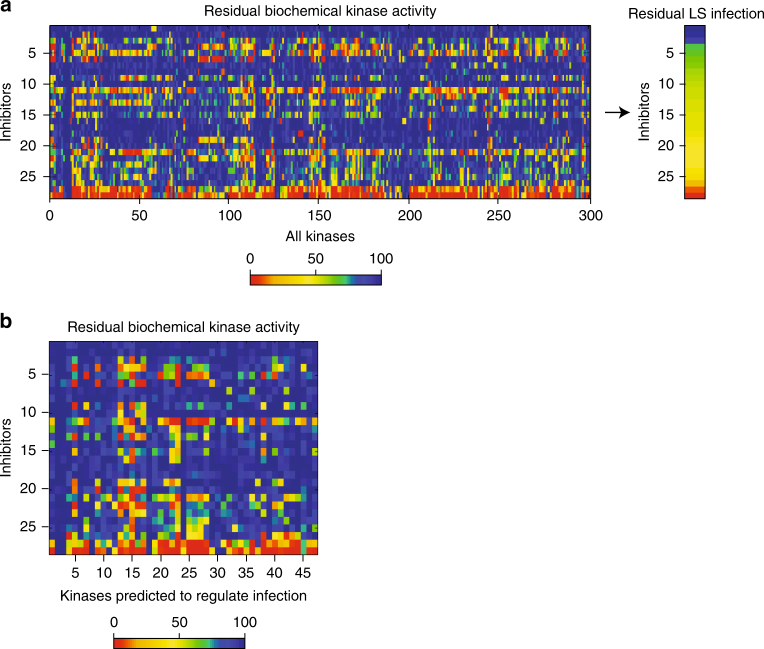
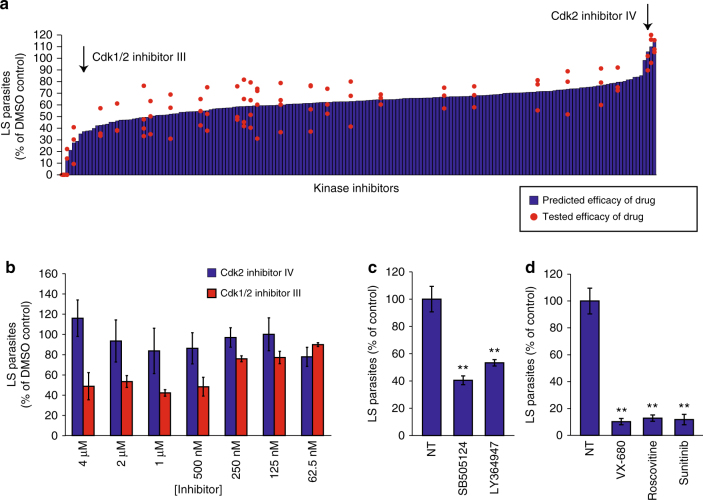
Plasmodium parasites have extensive needs from their host hepatocytes during the obligate liver stage of infection, yet there remains sparse knowledge of specific host regulators. Here we assess 34 host-targeted kinase inhibitors for their capacity to eliminate Plasmodium yoelii-infected hepatocytes. Using pre-existing activity profiles of each inhibitor, we generate a predictive computational model that identifies host kinases, which facilitate Plasmodium yoelii liver stage infection. We predict 47 kinases, including novel and previously described kinases that impact infection. The impact of a subset of kinases is experimentally validated, including Receptor Tyrosine Kinases, members of the MAP Kinase cascade, and WEE1. Our approach also predicts host-targeted kinase inhibitors of infection, including compounds already used in humans. Three of these compounds, VX-680, Roscovitine and Sunitinib, each eliminate >85% of infection. Our approach is well-suited to uncover key host determinants of infection in difficult model systems, including field-isolated parasites and/or emerging pathogens.


Conflict of interest statement

The authors declare no competing financial interests.

Figures

Fig. 1
Fig. 1
Plasmodium LS development is differentially impacted by host-targeted kinase inhibitors. a Schematic representing work flow to identify host kinases involved in LS infection by kinase profiling and elastic net regression. b P. falciparum GFP-Luciferase expressing blood stage parasites were cultured at 2% parasitemia in 5% hematocrit and evaluated for growth in response to 37 kinase inhibitors at 44 h.p.i. Light output was used as a surrogate measurement for parasite biomass. Values are normalized to the light output of non-treated parasites, which is indicated by a solid line. Kinase inhibitors that exhibited toxicity against blood stage parasites were removed for subsequent study (depicted in red). Data is the average of three independent experiments. c 150,000 Hepa 1–6 cells were infected with 50,000 P. yoelii parasites and then treated with kinase inhibitors at 500 nM 1.5 h.p.i. P. yoelii LS development in the presence of kinase inhibitors was evaluated by microscopy at 24 h.p.i. All values are normalized to vehicle-treated control (indicated by a solid line). Kinase inhibitors that exhibited high variability in parasite clearance were excluded from downstream analysis (depicted in green). Data shown is the average of 3–4 independent experiments. Error bars represent standard deviation of independent experiments. Individual data points are provided in Supplementary Table 1
Fig. 2
Fig. 2
Kinase profiles facilitate predictions of key host kinases for LS infection. a Heat map depicting residual kinase activity for 300 kinases in response to the 28 kinase inhibitors that were used to train an elastic net regression model. Inhibitors are ranked by their capacity to inhibit LS infection. b Heat map depicting residual kinase activity of 47 hit kinases identified in response to selected panel of kinase inhibitors. Inhibitors are ranked by their capacity to inhibit LS infection
Fig. 3
Fig. 3
Kinase profiling and elastic net regression successfully predict known and novel host kinases important for regulating P. yoelii LS infection. a Venn diagram depicting overlap between predicted kinase hits and kinases previously reported by whole-kinome siRNA screen. Our approach predicted 47 host kinases to be regulators of Plasmodium LS infection. Kinases without any previously described role in LS infection are depicted in blue. Kinases previously implicated in LS infection, and also predicted by the elastic net regression at α = 0.8, are depicted in red. Of the kinases previously demonstrated to regulate Plasmodium LS infection, those which are predicted at α < 0.8 are depicted in yellow. Kinases not recapitulated by our approach at any value of α are shown below. Statistical comparison to existing data was performed using hypergeometric probability test (p = 0.01). b Bar graph depicting LS development in cells with shRNA-mediated knockdown of a subset of predicted kinases. Values are normalized to non-treated parasites which are indicated by solid line. Green dashed line represents LS burden ≤70% of control. Predicted kinases with previous reports of LS activity are depicted in red. Novel predicted kinases are depicted in blue. Data is representative of at least three independent experiments. Error bars represent standard deviation of technical replicates. c Functional enrichment analysis of predicted kinases. The 47 predicted host kinases were analyzed using DAVID Bioinformatics Resources 6.8,. The 300 kinases that are evaluated by this approach were set as the background for the analysis. P-values were determined by modified Fisher’s exact test
Fig. 4
Fig. 4
Computational prediction of effective host-based drugs against Plasmodium yoelii infection. a Bar graph depicting predicted efficacy of host-targeted kinase inhibitors in eliminating LS parasite burden. Independent experimental data measuring LS inhibition from drugs used to generate the training dataset are overlaid as data points onto the bar graph. Red arrows indicate predicted efficacies of two drugs against the same kinase target—CDK2. b 150,000 Hepa 1–6 cells were infected with 50,000 P. yoelii parasites and then treated with CDK2 inhibitors at different concentrations ranging from 4 μM to 62.5 nM at 1.5 h.p.i. LS burden was evaluated by microscopy at 24 h.p.i. c 150,000 Hepa 1–6 cells were infected with 50,000 P. yoelii parasites and then treated with 500 nM of TGFBR-1 inhibitors SB505124 or LY364947 at 1.5 h.p.i. LS burden was evaluated by microscopy at 48 h.p.i. **p ≤ 0.01 evaluated by Student’s two-tailed t-test. d 150,000 Hepa 1–6 cells were infected with 50,000 P. yoelii parasites and then treated with 500 nM VX-680, Roscovitine or Sunitinib at 1.5 h.p.i. Parasite burden was evaluated by microscopy at 24 h.p.i. **p ≤ 0.01 evaluated by Student’s two-tailed t-test. All data are representative of at least three independent experiments. Error bars represent standard deviation of analytical replicates

References

    1. White NJ. Determinants of relapse periodicity in Plasmodium vivax malaria. Malar. J. 2011;10:297. doi: 10.1186/1475-2875-10-297. - DOI - PMC - PubMed
    1. Mikolajczak SA, et al. Plasmodium vivax liver stage development and hypnozoite persistence in human liver-chimeric mice. Cell Host Microbe. 2015;17:526–535. doi: 10.1016/j.chom.2015.02.011. - DOI - PMC - PubMed
    1. Krotoski WA, et al. Demonstration of hypnozoites in sporozoite-transmitted Plasmodium vivax infection. Am. J. Trop. Med. Hyg. 1982;31:1291–1293. doi: 10.4269/ajtmh.1982.31.1291. - DOI - PubMed
    1. Rodhain J. Paradoxical behaviour of Plasmodium vivax in the chimpanzee. Trans. R. Soc. Trop. Med. Hyg. 1956;50:287–293. doi: 10.1016/0035-9203(56)90036-0. - DOI - PubMed
    1. Lindner SE, Miller JL, Kappe SH. Malaria parasite pre-erythrocytic infection: preparation meets opportunity. Cell Microbiol. 2012;14:316–324. doi: 10.1111/j.1462-5822.2011.01734.x. - DOI - PMC - PubMed

Publication types

MeSH terms