. 2017 Oct 31;7(1):14455.
doi: 10.1038/s41598-017-14823-w.

High throughput discovery of influenza virus neutralizing antibodies from phage-displayed synthetic antibody libraries

Affiliations

High throughput discovery of influenza virus neutralizing antibodies from phage-displayed synthetic antibody libraries

Ing-Chien Chen et al. Sci Rep. .

Abstract

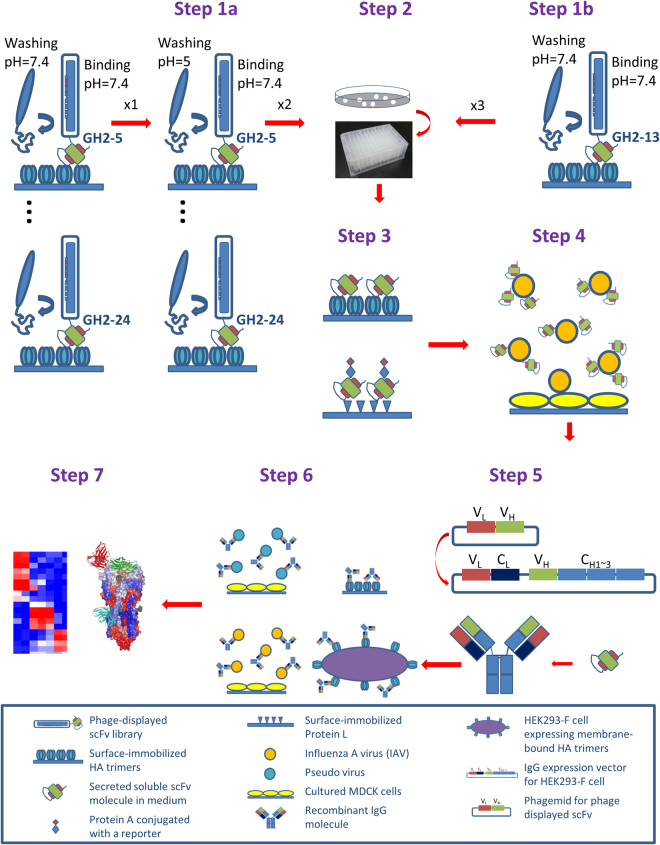
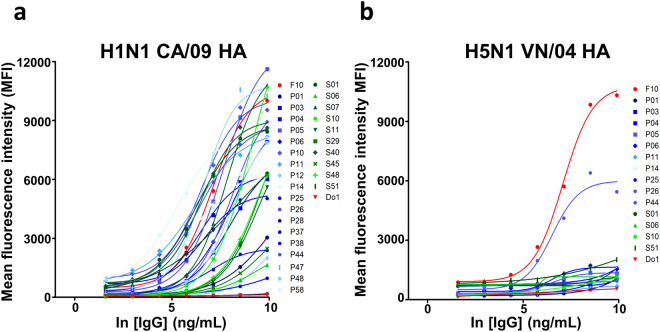
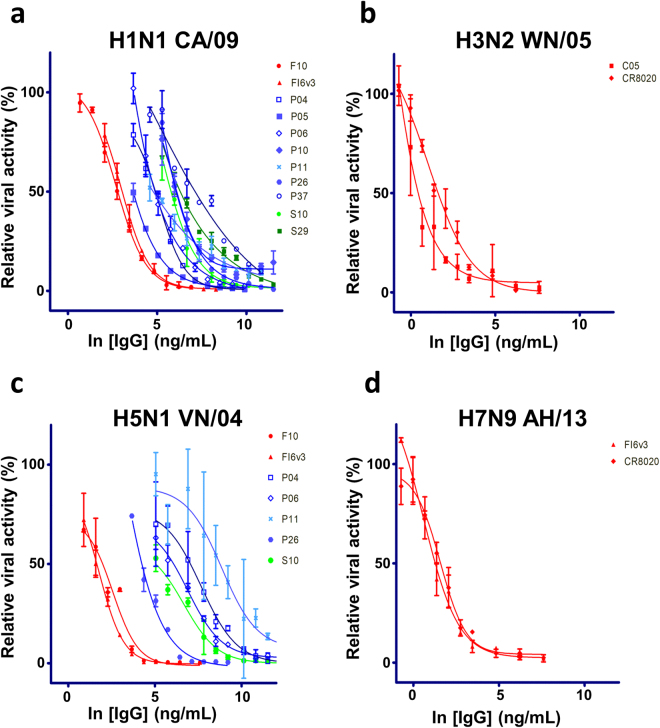
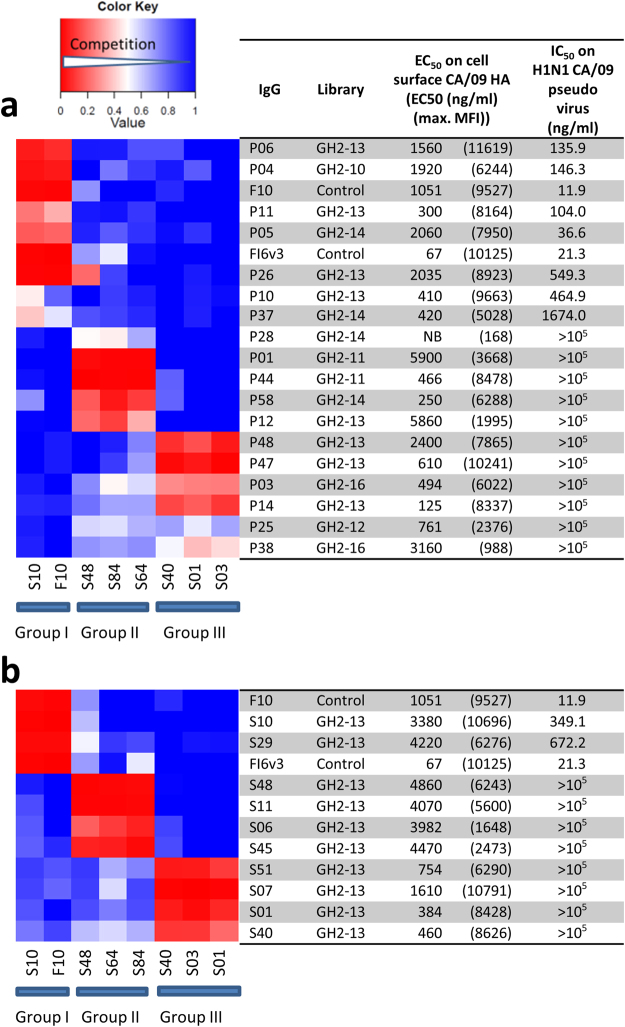
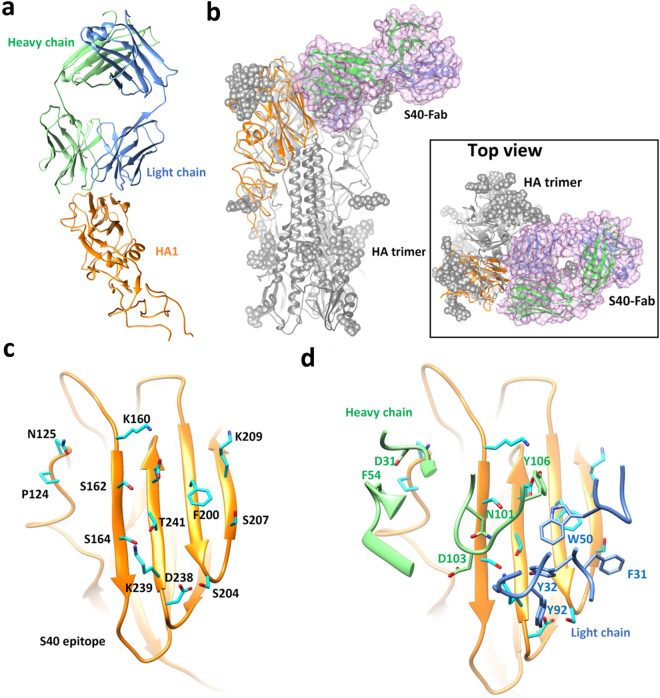
Pandemic and epidemic outbreaks of influenza A virus (IAV) infection pose severe challenges to human society. Passive immunotherapy with recombinant neutralizing antibodies can potentially mitigate the threats of IAV infection. With a high throughput neutralizing antibody discovery platform, we produced artificial anti-hemagglutinin (HA) IAV-neutralizing IgGs from phage-displayed synthetic scFv libraries without necessitating prior memory of antibody-antigen interactions or relying on affinity maturation essential for in vivo immune systems to generate highly specific neutralizing antibodies. At least two thirds of the epitope groups of the artificial anti-HA antibodies resemble those of natural protective anti-HA antibodies, providing alternatives to neutralizing antibodies from natural antibody repertoires. With continuing advancement in designing and constructing synthetic scFv libraries, this technological platform is useful in mitigating not only the threats of IAV pandemics but also those from other newly emerging viral infections.


Conflict of interest statement

The authors declare that they have no competing interests.

Figures

Figure 1
Figure 1
Schematic follow chart for the high throughput discovery of anti-IAV neutralizing antibodies from the phage-displayed synthetic antibody libraries. Step 1a: Parallel biopanning of anti-HA scFvs from 15 phage-displayed synthetic scFv libraries (GH2-5~24) under different pH conditions (results shown in Fig. 2). Step1b: Biopanning of anti-HA scFvs from the GH2-13 phage-displayed scFv library at neutral pH (results shown in Fig. 2). Step 2: Picking single colonies for soluble monoclonal scFvs secreted from cultured E. coli cells in 96-well deep well plate. Step 3: Screening for functional scFvs binding to HA trimer, Protein A, and Protein L with ELISA (results shown in Fig. 3). Step 4: Screening the functional scFvs for IAV neutralization with micro-neutralization assay (results shown in Fig. 3). Step 5: Reformating the IAV neutralizing functional scFvs to human IgG1s, expressed with 293-F cells. Step 6: Assessing the EC50’s (binding assays with ELISA and cell flow cytometry) and IC50’s (micro-neutralization assays with IAV and pseudo virus) of the recombinant IgGs (results shown in Figs 4~7). Step 7: Grouping epitopes with competition ELISA and epitope mapping with structure determination (results shown in Figs 8~9). Technical details are shown in Methods.
Figure 2
Figure 2
Results of biopanning of the synthetic antibody libraries against immobilized HA trimer of H1N1 CA/09. (a) 15 GH2 phage-displayed scFv libraries were selected for HA binding. The y-axis shows the ratio of the output/input titer of the phage library in each of the biopanning rounds (x-axis). (b) The polyclonal soluble scFvs secreted in the E. coli culture media of the output phage libraries were assayed for HA trimer binding with ELISA (y-axis) for the biopanning rounds (x-axis) with each of the 15 phage-displayed scFv libraries. (c)~(d) The descriptions are the same as in (a) and (b) respectively for the biopanning protocol of the Step 1b in Fig. 1. The experiments were repeated twice, as shown in the panels. Experimental details are described in Methods.
Figure 3
Figure 3
High throughput screening of anti-IAV H1N1 CA/09 neutralizing scFvs binding to H1N1 CA/09 HA trimer. (a) High throughput screening results (Step 3~4 in Fig. 1) for more than 5000 monoclonal scFvs with the protocol of Step 1a in Fig. 1 are summarized in this panel. The y-axis shows the ELISA signal of the monoclonal scFvs binding to H1N1 CA/09 HA trimer; the x-axis shows the relative viral activity based on the viral activity ratio measured in the microneutralization assay with IAV H1N1 CA/09 after and before addition of the scFv culture medium to the assay system – 100% relative viral active means no inhibition of the scFv to the IAV infection to the MDCK cell; 0% relative viral activity means complete inhibition of the infection. Positive control scFvs derived from F10 and FI6v3 IgGs show almost 0% relative viral activity in the assay and negative control scFv derived from AV1 IgG shows almost 100% relative viral activity. The dark blue data points labelled with antibody names are selected for IgG reformatting (Supplementary Tables S3~S4). The error bars associated with these data points were determined with at least three repeats of the microneutralization measurements. (b) The description is the same as in panel (a) for the high throughput screening results (Step 3~4 in Fig. 1) for more than 100 monoclonal scFvs with the protocol of Step 1b in Fig. 1 are summarized in this panel. Experimental details are described in Methods.
Figure 4
Figure 4
EC50 measurements with ELISA for the IgGs reformatted from the selected anti-HA trimer scFvs. (a)~(d) The IgGs were reformatted from the selected anti-HA trimer scFvs as shown in Fig. 3. The experimental details are described in Methods. The CDR sequences of these IgGs are shown in Supplementary Table S3, and the numerical values of the EC50’s and the sigmoidal curve fitting correlation coefficients are listed in Supplementary Table S4. The positive control IgGs: F10, FI6v3, C05, and CR8020 were prepared as described in Methods.
Figure 5
Figure 5
Flow cytometry-based EC50 measurements with mean fluorescence intensity (MFI) for the IgGs binding to cell surface-expressed H1N1 CA/09 and H5N1 VN/04 HA trimers on 293 T cells. (a),(b) The IgGs were reformatted from the selected anti-HA trimer scFvs as shown in Fig. 3. The experimental details are described in Methods. The CDR sequences of these IgGs are shown in Supplementary Table S3, and the numerical values of the EC50’s and the maximal MFI are listed in Supplementary Table S4. The experimental details are described in Methods.
Figure 6
Figure 6
IC50 measurements with pseudo virus-based microneutralization assay for the IgGs reformatted from the selected anti-HA trimer scFvs. (a)~(d) The IgGs were reformatted from the selected anti-HA trimer scFvs as shown in Fig. 3. The y-axis shows the relative viral activity plotted against the IgG concentration (x-axis). The experimental details are described in Methods. The CDR sequences of these IgGs are shown in Supplementary Table S3, and the numerical values of the IC50’s are listed in Supplementary Table S4. The error bars associated with the data points are calculated with at least three independent repeats of the microneutralization assay. The positive control IgGs: F10, FI6v3, C05, and CR8020 were prepared as described in Methods.
Figure 7
Figure 7
IC50 measurements with IAV H1N1 CA/09 microneutralization assay for the IgGs reformatted from the selected anti-HA trimer scFvs. The IgGs were reformatted from the selected anti-HA trimer scFvs as shown in Fig. 3. The y-axis shows the relative viral activity plotted against the IgG concentration (x-axis). The experimental details are described in Methods. The CDR sequences of these IgGs are shown in Supplementary Table S3, and the numerical values of the IC50’s are listed in Supplementary Table S4. The error bars associated with the data points are calculated with at least three independent repeats of the microneutralization assay. The positive control IgGs: F10 and FI6v3 were prepared as described in Methods.
Figure 8
Figure 8
Epitope groups of the anti-HA trimer antibodies determined with competition ELISA. (a) Competition between the pairs of antibodies derived from the protocol Step 1a in Fig. 1 are shown as the heat map in this panel. Three major epitope groups (group I, II and III) are distinguishable as shown in the heat map. The names and associated data of these IgGs are shown next to the competition heat map. The experimental details of the competition ELISA are described in Methods. (b) The description is the same as in panel A for the competition heat map between the pairs of antibodies derived from the protocol Step 1b in Fig. 1.
Figure 9
Figure 9
Structure of Fab(S40)-HA(H1N1 CA/09) complex determined with crystallography. (a) The Fab(S40) recognizes the HA1 domain as shown by the crystal structure of Fab(S40) in complex with the HA1 domain. The HA1 is colored in orange, the Fab heavy-chain and the light-chain and molecules are in green and blue, respectively. Only the backbone of the complex structure is shown. (b) The Fab(S40)-HA1 complex structure is superimposed on the HA trimer (PDB code: 4NRL). The trimeric structure of HA with the glycan (gray sphere) is shown in gray. The HA1 subunit in the Fab(S40)-HA1 complex is shown in orange ribbon and the Fab structure in the Fab(S40)-HA1 complex is outlined by the pink surface. (c) Amino acid sidechains in the conformational epitope of S40 on HA1 (backbone shown as the orange ribbon) are shown with stick model in cyan. The residue numbers of these epitope residues are also shown next to the sidechains. (d) The heavy-chain and light-chain CDRs in the interface between HA1 and Fab(S40) are shown as green and blue ribbons, respectively. The epitope contacting residue sidechains in the CDRs of Fab(S40) are shown as stick models, which are labeled in green (heavy chain) and blue (light chain) residue numbers.

References

    1. Wiersma LC, Rimmelzwaan GF, de Vries RD. Developing universal influenza vaccines: hitting the nail, not just on the head. Vaccines. 2015;3:239–262. doi: 10.3390/vaccines3020239. - DOI - PMC - PubMed
    1. Molinari NA, et al. The annual impact of seasonal influenza in the US: measuring disease burden and costs. Vaccine. 2007;25:5086–5096. doi: 10.1016/j.vaccine.2007.03.046. - DOI - PubMed
    1. Spanakis N, Pitiriga V, Gennimata V, Tsakris A. A review of neuraminidase inhibitor susceptibility in influenza strains. Expert Rev. Anti. Infect. Ther. 2014;12:1325–1336. doi: 10.1586/14787210.2014.966083. - DOI - PubMed
    1. Taubenberger JK, Morens DM. Influenza: the once and future pandemic. Public Health Rep. 2010;125(Suppl 3):16–26. - PMC - PubMed
    1. Lin JH, Wu HS. Challenges and strategies of laboratory diagnosis for newly emerging influenza viruses in Taiwan: a decade after SARS. BioMed. Res. Int. 2015;2015:805306. - PMC - PubMed

Publication types

MeSH terms