. 2017 Oct 31;7(1):14470.
doi: 10.1038/s41598-017-15040-1.

ACVR2B/Fc counteracts chemotherapy-induced loss of muscle and bone mass

Affiliations

ACVR2B/Fc counteracts chemotherapy-induced loss of muscle and bone mass

Rafael Barreto et al. Sci Rep. .

Abstract

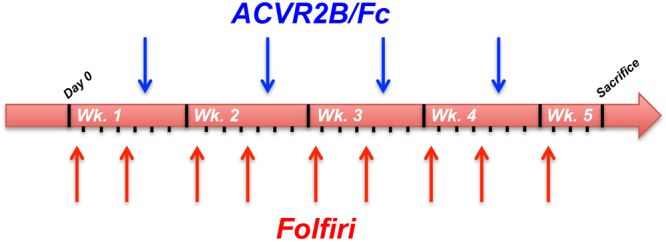
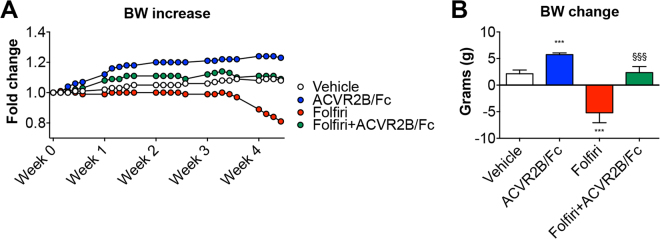
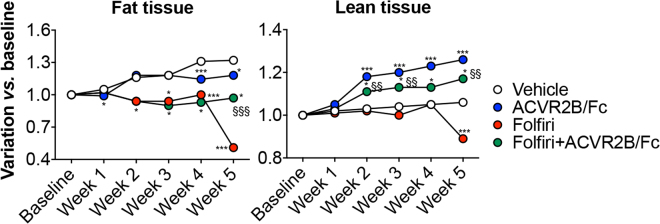
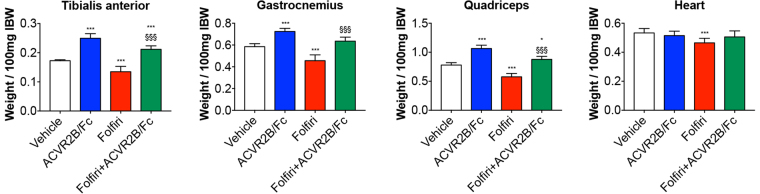
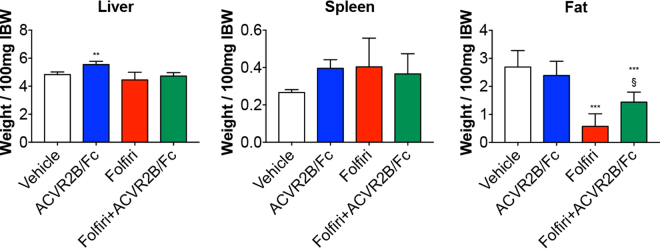
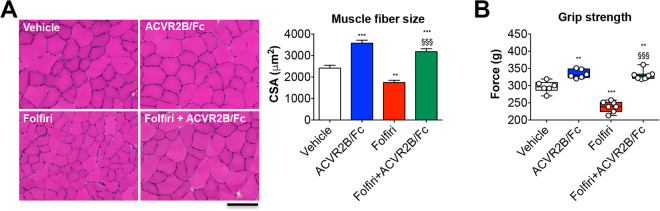
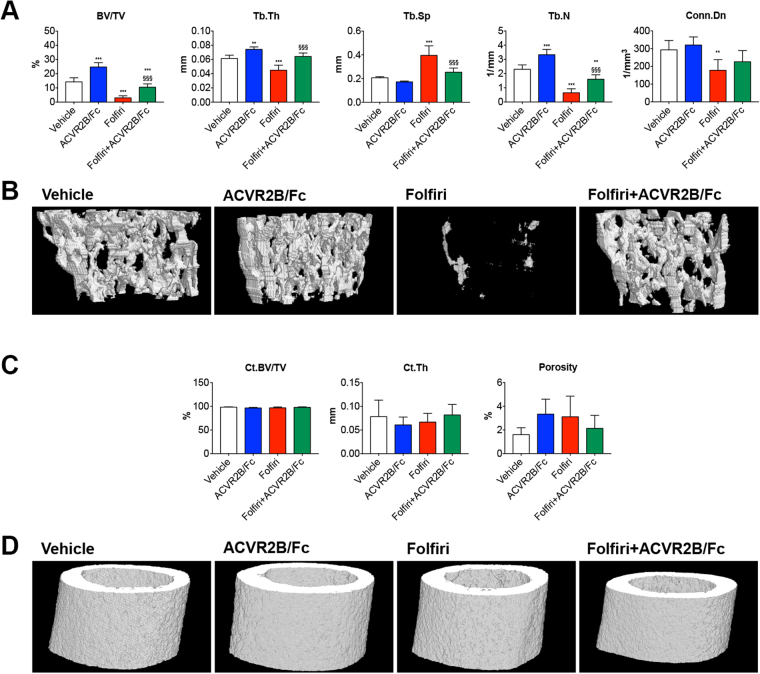
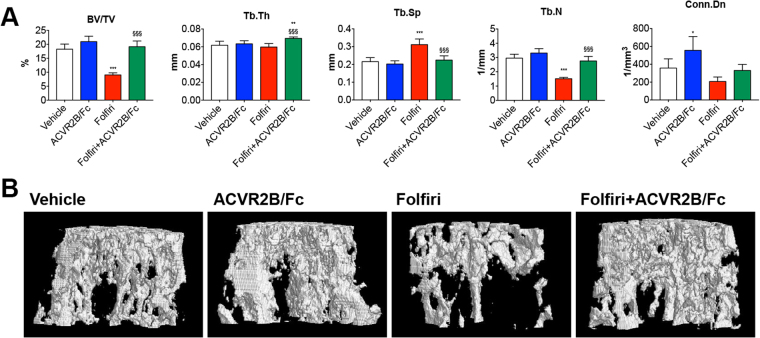
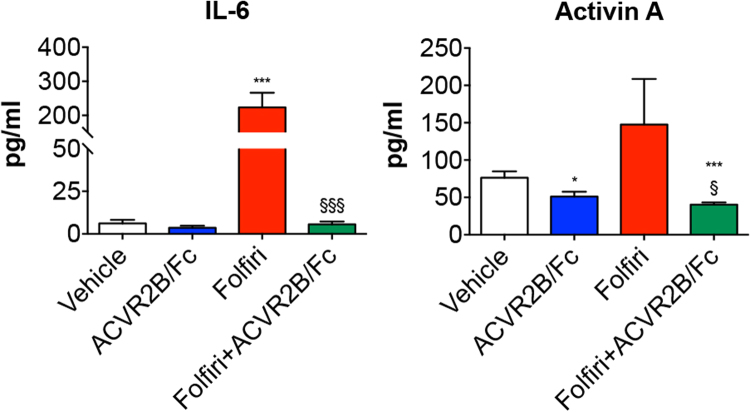
Chemotherapy promotes the development of cachexia, a debilitating condition characterized by muscle and fat loss. ACVR2B/Fc, an inhibitor of the Activin Receptor 2B signaling, has been shown to preserve muscle mass and prolong survival in tumor hosts, and to increase bone mass in models of osteogenesis imperfecta and muscular dystrophy. We compared the effects of ACVR2B/Fc on muscle and bone mass in mice exposed to Folfiri. In addition to impairing muscle mass and function, Folfiri had severe negative effects on bone, as shown by reduced trabecular bone volume fraction (BV/TV), thickness (Tb.Th), number (Tb.N), connectivity density (Conn.Dn), and by increased separation (Tb.Sp) in trabecular bone of the femur and vertebra. ACVR2B/Fc prevented the loss of muscle mass and strength, and the loss of trabecular bone in femurs and vertebrae following Folfiri administration. Neither Folfiri nor ACVR2B/Fc had effects on femoral cortical bone, as shown by unchanged cortical bone volume fraction (Ct.BV/TV), thickness (Ct.Th) and porosity. Our results suggest that Folfiri is responsible for concomitant muscle and bone degeneration, and that ACVR2B/Fc prevents these derangements. Future studies are required to determine if the same protective effects are observed in combination with other anticancer regimens or in the presence of cancer.


Conflict of interest statement

The authors declare that they have no competing interests.

Figures

Figure 1
Figure 1
Experimental plan. Schematic representation of the experimental model and dosing schedules. The black ticks indicate the days, the blue arrows the day of ACVR2B/Fc treatment and the red arrows the day of Folfiri treatment. Wk. = week.
Figure 2
Figure 2
ACVR2B/Fc prevents chemotherapy-induced body weight loss. Body weight curves (A) and body weight change (i.e. body weight at time of sacrifice vs. initial body weight) (B) in mice exposed to Folfiri and ACVR2B/Fc for up to 5 weeks (n = 6–7). Data expressed as means ± SD. Significance of the differences: ***p < 0.001 vs. Vehicle; §§§p < 0.001 vs. Folfiri.
Figure 3
Figure 3
ACVR2B/Fc administration abolishes muscle depletion and partially protects against fat loss in mice treated with Folfiri. Body composition assessment in animals exposed to Folfiri and ACVR2B/Fc (n = 6–7) was performed by means of EchoMRI. Data (grams of fat or lean tissue) are expressed as fold change variation vs. baseline (day 0) over 5 weeks. Significance of the differences: *p < 0.05, **p < 0.01, ***p < 0.001 vs. Vehicle; §§p < 0.01, §§§p < 0.001 vs. Folfiri.
Figure 4
Figure 4
Administration of ACVR2B/Fc prevents muscle atrophy in the Folfiri-treated. Muscle weights in mice treated with Folfiri and ACVR2B/Fc for up to 5 weeks (n = 6–7). Weights were normalized to the Initial Body Weight (IBW) and expressed as weight/100 mg IBW. Data expressed as means ± SD. GSN: gastrocnemius. Significance of the differences: *p < 0.05, ***p < 0.001 vs. Vehicle; §§§p < 0.001 vs. Folfiri.
Figure 5
Figure 5
Folfiri-induced adipose tissue depletion is partially prevented by ACVR2B/Fc treatment. Liver, spleen and fat weights in mice treated with Folfiri and ACVR2B/Fc for up to 5 weeks (n = 6–7). Weights were normalized to the Initial Body Weight (IBW) and expressed as weight/100 mg IBW. Data expressed as means ± SD. Significance of the differences: **p < 0.01, ***p < 0.001 vs. Vehicle; §p < 0.05 vs. Folfiri.
Figure 6
Figure 6
ACVR2B/Fc prevents the Folfiri-associated loss of muscle fiber size and muscle strength. Muscle morphology (H&E staining) and quantification of the cross-sectional area (CSA) in the tibialis anterior muscle of mice exposed to chemotherapy or ACVR2B/Fc. Scale bar: 100 μm. Magnification: 20X (A). Whole body grip strength in animals administered chemotherapy or ACVR2B/Fc for up to 5 weeks, reported as peak force, was measured by taking advantage of a grip strength meter and expressed as the average of the three top pulls from each animal (n = 6–7) (B). Data expressed as means ± SD. Significance of the differences: **p < 0.01, ***p < 0.001 vs. Vehicle; §§§p < 0.001 vs. Folfiri.
Figure 7
Figure 7
Folfiri severely affects the trabecular bone mass, but not the cortical bone, in the mouse femurs, and ACVR2B/Fc completely abolishes its effects. Quantification of bone volume fraction (BV/TV), trabecular thickness (Tb.Th), trabecular separation (Tb.Sp), trabecular number (Tb.N) and trabecular connectivity density (Conn.Dn) in the femur of mice treated with Folfiri and ACVR2B/Fc (n = 6–7) (A). Representative 3D rendering of μCT scan images of femur sections (B). Quantification of cortical bone volume fraction (Ct.BV/TV), cortical thickness (Ct.Th) and overall porosity in the femur of mice exposed to Folfiri and ACVR2B/Fc (n = 6–7) (C). 3D rendering of μCT scan images of cortical femur sections (D). Data are expressed as means ± SD. Significance of the differences: *p < 0.05, **p < 0.01, ***p < 0.001 vs. Vehicle; §§§p < 0.001 vs. Folfiri.
Figure 8
Figure 8
ACVR2B/Fc prevents the Folfiri-mediated effects on vertebral bone tissue. Quantification of bone volume fraction (BV/TV), trabecular thickness (Tb.Th), trabecular separation (Tb.Sp), trabecular number (Tb.N) and trabecular connectivity density (Conn.Dn) in the vertebrae of mice treated with Folfiri and ACVR2B/Fc (n = 6–7) (A). Representative 3D rendering of μCT scan images of vertebral sections (B). Data are expressed as means ± SD. Significance of the differences: *p < 0.05, ***p < 0.001 vs. Vehicle; §§§p < 0.001 vs. Folfiri.
Figure 9
Figure 9
ACVR2B/Fc treatment potently reduces IL-6 and Activin A circulating levels in combination with Folfiri. Quantification of IL-6 and Activin A levels in the plasma from mice exposed to Folfiri, alone or in combination with ACVR2B/Fc (n = 6–7). Data, expressed as means ± SD, are reported in pg/ml. Significance of the differences: ***p < 0.001 vs. Vehicle; §p < 0.05, §§§p < 0.001 vs. Folfiri.

References

    1. Siegel RL, Miller KD, Jemal A. Cancer Statistics, 2017. CA: a cancer journal for clinicians. 2017;67:7–30. - PubMed
    1. Fearon K, et al. Definition and classification of cancer cachexia: an international consensus. The lancet oncology. 2011;12:489–495. doi: 10.1016/S1470-2045(10)70218-7. - DOI - PubMed
    1. Costelli P, Baccino FM. Mechanisms of skeletal muscle depletion in wasting syndromes: role of ATP-ubiquitin-dependent proteolysis. Current opinion in clinical nutrition and metabolic care. 2003;6:407–412. - PubMed
    1. Tisdale MJ. Mechanisms of cancer cachexia. Physiological reviews. 2009;89:381–410. doi: 10.1152/physrev.00016.2008. - DOI - PubMed
    1. Fearon KC, Glass DJ, Guttridge DC. Cancer cachexia: mediators, signaling, and metabolic pathways. Cell metabolism. 2012;16:153–166. doi: 10.1016/j.cmet.2012.06.011. - DOI - PubMed

Publication types

MeSH terms

Supplementary concepts