. 2017 Oct 24:8:56.
doi: 10.1186/s13229-017-0174-4. eCollection 2017.

RNA sequencing and proteomics approaches reveal novel deficits in the cortex of Mecp2-deficient mice, a model for Rett syndrome

Affiliations

RNA sequencing and proteomics approaches reveal novel deficits in the cortex of Mecp2-deficient mice, a model for Rett syndrome

Natasha L Pacheco et al. Mol Autism. .

Abstract

Background: Rett syndrome (RTT) is an X-linked neurodevelopmental disorder caused by mutations in the transcriptional regulator MeCP2. Much of our understanding of MeCP2 function is derived from transcriptomic studies with the general assumption that alterations in the transcriptome correlate with proteomic changes. Advances in mass spectrometry-based proteomics have facilitated recent interest in the examination of global protein expression to better understand the biology between transcriptional and translational regulation.

Methods: We therefore performed the first comprehensive transcriptome-proteome comparison in a RTT mouse model to elucidate RTT pathophysiology, identify potential therapeutic targets, and further our understanding of MeCP2 function. The whole cortex of wild-type and symptomatic RTT male littermates (n = 4 per genotype) were analyzed using RNA-sequencing and data-independent acquisition liquid chromatography tandem mass spectrometry. Ingenuity® Pathway Analysis was used to identify significantly affected pathways in the transcriptomic and proteomic data sets.

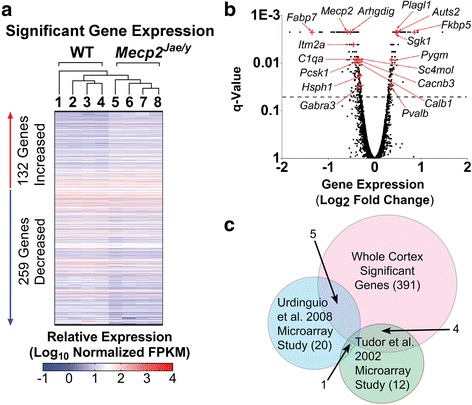
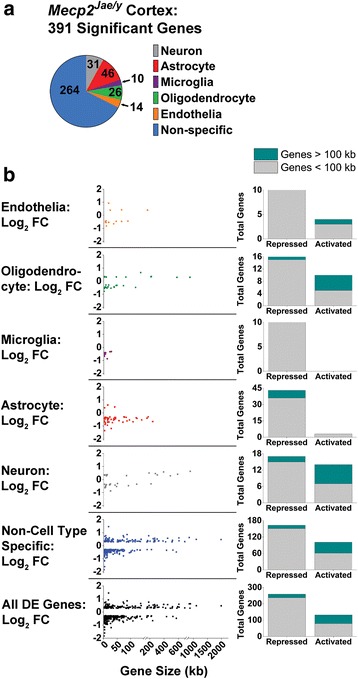
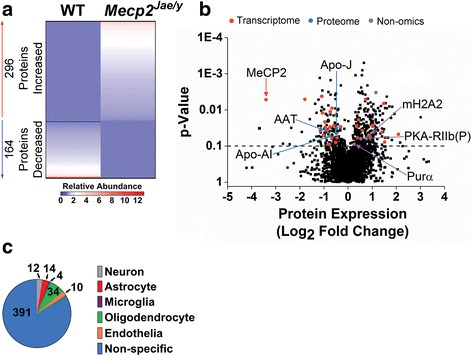
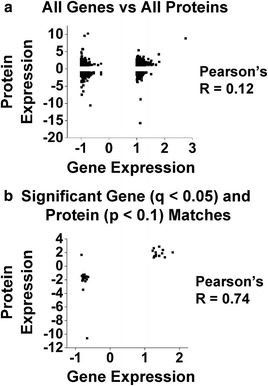
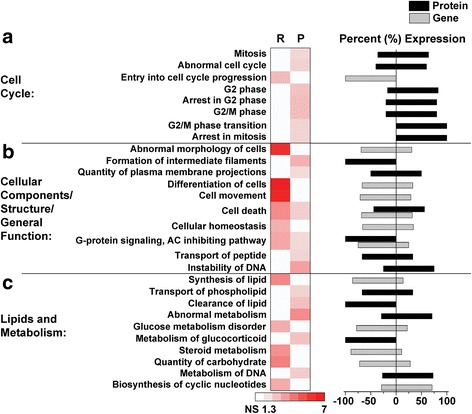
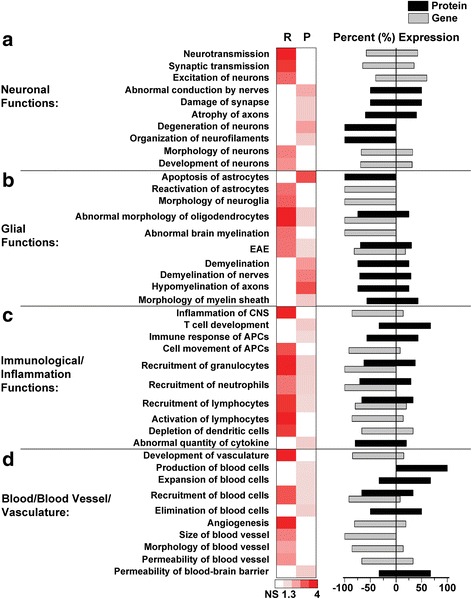
Results: Our results indicate these two "omics" data sets supplement one another. In addition to confirming previous works regarding mRNA expression in Mecp2-deficient animals, the current study identified hundreds of novel protein targets. Several selected protein targets were validated by Western blot analysis. These data indicate RNA metabolism, proteostasis, monoamine metabolism, and cholesterol synthesis are disrupted in the RTT proteome. Hits common to both data sets indicate disrupted cellular metabolism, calcium signaling, protein stability, DNA binding, and cytoskeletal cell structure. Finally, in addition to confirming disrupted pathways and identifying novel hits in neuronal structure and synaptic transmission, our data indicate aberrant myelination, inflammation, and vascular disruption. Intriguingly, there is no evidence of reactive gliosis, but instead, gene, protein, and pathway analysis suggest astrocytic maturation and morphological deficits.

Conclusions: This comparative omics analysis supports previous works indicating widespread CNS dysfunction and may serve as a valuable resource for those interested in cellular dysfunction in RTT.

Keywords: Multi-cellular deficits; Proteome; Rett syndrome; Transcriptome.


Conflict of interest statement

Ethics approval

All mouse experimental protocols were followed according to NIH guidelines and approval from the Animal Care and Use Committee of the University of Alabama at Birmingham.

Consent for publication

Not applicable.

Competing interests

MRH owns shares in Vulcan Analytical, LLC. The remaining authors declare that they have no competing interests.

Publisher’s Note

Springer Nature remains neutral with regard to jurisdictional claims in published maps and institutional affiliations.

Figures

Fig. 1
Fig. 1
Transcriptome-wide expression in Mecp2 Jae/y cortex. a. Heat map of 391 significant, differentially expressed (DE) genes. Each genotype has 4 biological replicates, where each column represents 1 biological replicate and each row represents the Log10-transformed FPKM of a significant DE gene. Biological replicates are listed in the order of how they cluster, which is indicated by the cluster dendrogram above the heat map. Genes with a false discovery rate (q-value or FDR) of < 0.05 were considered to be significantly, differentially expressed. b. Volcano plot of all the detected genes’ expression (Log2 fold change) in the Mecp2 Jae/y whole cortex transcriptome. Significant DE genes previously identified as RTT hits are highlighted in red crosses and arrows. Due to space constraints, additional genes identified in supplemental material from Chahrour et al. [4] and Veeraragavan et al. [34] were not highlighted in this volcano plot; for information on these genes, see Table 1. Dotted line indicates a q-value of 0.05, where anything above the line indicates a significant DE gene. c. Venn diagram comparing our transcriptome data to previously published microarray studies (Urdinguio et al. [24] and Tudor et al. [20]) on Mecp2 Jae/y mouse cortex. Note that in the Urdinguio study, the fold change expression was not differentiated between cortex, midbrain, and cerebellum due to their finding that there were no differences in gene expression between the 3 brain regions [24]; rather, fold change values represent combined tissue expression. Six genes were shared between the Mecp2 Jae/y transcriptome data and the Urdinguio et al. study, while 5 genes from the Tudor et al. study were shared in common with the transcriptome data. One of the targets (Fabp7) from the Tudor et al. study was also overlapped with the Urdinguio et al. study
Fig. 2
Fig. 2
Cell type-specific gene expression correlation. a. Mecp2 Jae/y cortex significant DE genes compared to top 500 CNS cell type-specific genes based on the Zhang et al. study [69], which is also provided as a public database. Each pie slice lists the number of DE genes associated with each CNS cell type. b. Fold change expression and gene size correlation in the Mecp2 Jae/y transcriptome. Significant DE genes were plotted by Log2 fold change (FC) expression (y-axis) and gene size (x-axis; in units of kilobase (kb)) according to their respective CNS cell type distribution (based on part A). Expression and gene size correlations were also examined as a whole (bottom scatter plot in black). This relationship is also represented to the right of each scatter plot based on the number of short (defined as being less than 100 kb; gray) and long (defined as being greater than 100 kb; turquoise) genes that are either repressed (i.e., decreased expression) or activated (i.e., increased expression) in the Mecp2 Jae/y cortex
Fig. 3
Fig. 3
Proteome-wide expression in Mecp2 Jae/y cortex. a. Heat map of 460 significant, abundantly expressed proteins. Each column represents pooled biological replicates per genotype (n = 4), and each row represents the relative abundance fold change of an individual protein (with or without a PTM). Proteins with a p-value of < 0.1 were considered differentially abundant. b. Volcano plot of all the detected proteins’ expression (Log2 fold change) in the Mecp2 Jae/y whole cortex proteome. Dotted line indicates a p-value of 0.1, where anything above the line indicates a significant protein. Previously identified RTT hits are highlighted in red, blue, or purple filled circles. Red circles denote that the significant protein was identified from a transcriptome-based gene expression study, blue circles denote identification from a proteomics-based study, and purple circles denote identification from a non-omics-based study. Due to space constraints, only the selected RTT protein hits identified from proteomics and non-omics-based studies were highlighted in this volcano plot. For a comprehensive list of all the identified RTT protein hits, refer to Additional file 8. c. Pie chart of significant proteins compared to top 500 cell type-specific genes based on the Zhang et al. study [69]. All significant proteins were included in the analysis. Each pie slice lists the number of significant proteins associated with each CNS cell type
Fig. 4
Fig. 4
Transcriptome-proteome expression correlation in Mecp2 Jae/y cortex. a. Overall gene-protein expression correlation. Detected genes (7026) from the RNA-Seq data set were matched against detected proteins (4789) from the proteomics data set, resulting in a total of 3780 gene-protein matches. Each individual gene-protein match is plotted by gene fold change expression (x-axis, Mecp2 Jae/y/WT) and its corresponding protein fold change expression (y-axis, Mecp2 Jae/y/WT). Pearson’s R reports a correlation of 0.12. b. Significant gene and significant protein expression correlation. Out of the 3780 detected gene-protein matches, only 35 have both a significant gene (q < 0.05) and corresponding significant protein (p < 0.1) match. Each match is plotted by gene fold change expression (x-axis, Mecp2 Jae/y/WT) and its corresponding protein fold change expression (y-axis, Mecp2 Jae/y/WT). Pearson’s R reports a correlation of 0.74
Fig. 5
Fig. 5
Transcriptome and proteome general cellular and molecular pathways in Mecp2 Jae/y cortex. Selected biological pathways that are both shared and unique to the transcriptome (R) and proteome (P) data sets are grouped by broad categories associated with general cellular/molecular function: (a) cell cycle, (b) cellular components/structure/general function, and (c) lipids and metabolism. Respective pathways are plotted by −Log10 p-value, where a value of 1.3 or greater represents a p-value of at least p < 0.05; non-significant (NS) pathways are denoted in white. The direction of gene (gray bars) and/or protein (black bars) expression changes associated with each respective pathway are represented as a percent expression to the right of the heat map, where a value greater than 0 indicates increased expression and a value less than 0 indicates decreased expression. The percent expression was calculated by taking the number of genes/proteins with significant increased or decreased expression divided by the total sum of significant genes/proteins assigned to the respective pathway. Note in part B, the abbreviation “AC” in the “G-protein signaling, AC inhibiting pathway” stands for “adenylate cyclase.” For a comprehensive list of all pathways and associated significant genes/proteins identified in both the transcriptome and proteome data sets, see Additional file 10
Fig. 6
Fig. 6
Transcriptome and proteome cell type-specific pathways in Mecp2 Jae/y cortex. Selected biological pathways that are both shared and unique to the transcriptome (R) and proteome (P) data sets are grouped by broad categories associated with CNS and general cell type specific function: (a) neuronal functions, (b) glial functions, (c) immunological/inflammation functions, and (d) blood/blood vessel/vasculature. Respective pathways are plotted by −Log10 p-value, where a value of 1.3 or greater represents a p-value of at least p < 0.05; non-significant (NS) pathways are denoted in white. The direction of gene (gray bars) and/or protein (black bars) expression changes associated with each respective pathway are represented as a percent expression to the right of the heat map, where a value greater than 0 indicates increased expression and a value less than 0 indicates decreased expression. The percent expression was calculated as described in Fig. 5. Note in part B, the abbreviation “EAE” stands for “experimental autoimmune encephalomyelitis”; in part C, the abbreviation “APCs” in the pathways “Immune response of APCs” and “Cell movement of APCs” stands for “antigen presenting cells.” For a comprehensive list of all pathways and associated significant genes/proteins identified in both the transcriptome and proteome data sets, see Additional file 10

References

    1. Percy AK, Lane JB. Rett syndrome: model of neurodevelopmental disorders. J Child Neurol. 2005;20:718–721. doi: 10.1177/08830738050200090301. - DOI - PubMed
    1. Amir RE, Van den Veyver IB, Wan M, Tran CQ, Francke U, Zoghbi HY. Rett syndrome is caused by mutations in X-linked MECP2, encoding methyl-CpG-binding protein 2. Nat Genet. 1999;23:185–188. doi: 10.1038/13810. - DOI - PubMed
    1. Cuddapah VA, Pillai RB, Shekar KV, Lane JB, Motil KJ, Skinner SA, Tarquinio DC, Glaze DG, McGwin G, Kaufmann WE, et al. Methyl-CpG-binding protein 2 (MECP2) mutation type is associated with disease severity in Rett syndrome. J Med Genet. 2014;51:152–158. doi: 10.1136/jmedgenet-2013-102113. - DOI - PMC - PubMed
    1. Chahrour M, Jung SY, Shaw C, Zhou X, Wong ST, Qin J, Zoghbi HY. MeCP2, a key contributor to neurological disease, activates and represses transcription. Science. 2008;320:1224–1229. doi: 10.1126/science.1153252. - DOI - PMC - PubMed
    1. Yasui DH, Peddada S, Bieda MC, Vallero RO, Hogart A, Nagarajan RP, Thatcher KN, Farnham PJ, Lasalle JM. Integrated epigenomic analyses of neuronal MeCP2 reveal a role for long-range interaction with active genes. Proc Natl Acad Sci U S A. 2007;104:19416–19421. doi: 10.1073/pnas.0707442104. - DOI - PMC - PubMed

Publication types

MeSH terms