. 2017 Oct 30:3:17075.
doi: 10.1038/cddiscovery.2017.75. eCollection 2017.

A signature of enhanced lipid metabolism, lipid peroxidation and aldehyde stress in therapy-induced senescence

Affiliations

A signature of enhanced lipid metabolism, lipid peroxidation and aldehyde stress in therapy-induced senescence

Amy C Flor et al. Cell Death Discov. .

Abstract

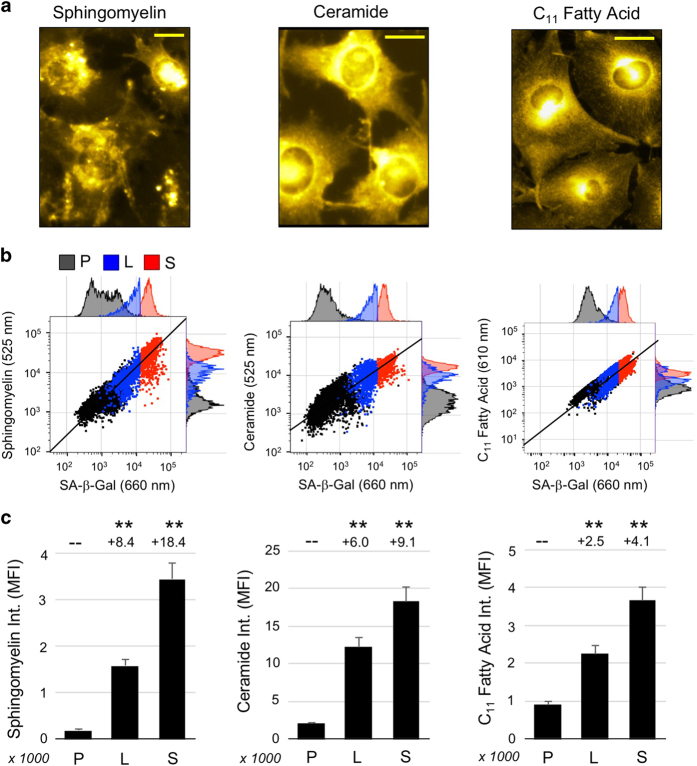
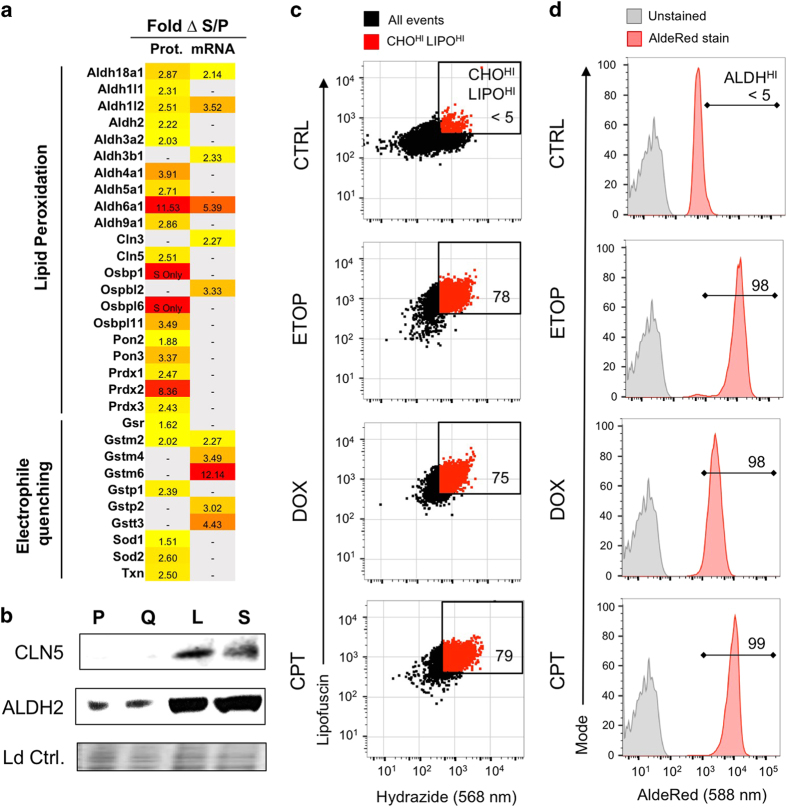
At their proliferative limit, normal cells arrest and undergo replicative senescence, displaying large cell size, flat morphology, and senescence-associated beta-galactosidase (SA-β-Gal) activity. Normal or tumor cells exposed to genotoxic stress undergo therapy-induced senescence (TIS), displaying a similar phenotype. Senescence is considered a DNA damage response, but cellular heterogeneity has frustrated identification of senescence-specific markers and targets. To explore the senescent cell proteome, we treated tumor cells with etoposide and enriched SA-β-GalHI cells by fluorescence-activated cell sorting (FACS). The enriched TIS cells were compared to proliferating or quiescent cells by label-free quantitative LC-MS/MS proteomics and systems analysis, revealing activation of multiple lipid metabolism pathways. Senescent cells accumulated lipid droplets and imported lipid tracers, while treating proliferating cells with specific lipids induced senescence. Senescent cells also displayed increased lipid aldehydes and upregulation of aldehyde detoxifying enzymes. These results place deregulation of lipid metabolism alongside genotoxic stress as factors regulating cellular senescence.


Conflict of interest statement

The authors declare no conflict of interest.

Figures

Figure 1
Figure 1
FACS of senescent cells for proteomics analysis. (a) Flow cytometric assay data using near-infrared fluorescent SA-β-Gal probe DDAOG to evaluate senescence in proliferating (P, gray), quiescent (Q, yellow) or etoposide-treated cells (L, SA-β-GalLO, blue; S, SA-β-GalHI, red). Etoposide-treated cells were flow cytometrically sorted based on SA-β-Gal intensity and subjected to downstream analysis. (b) Visualization of SA-β-Gal signal versus cell volume (FSC) demonstrates that SA-β-Gal expression is not dependent on cell size. (c) Imaging of proliferating and senescent cells for common senescent markers. Proliferating cells (P) growing in log phase are compared to the flow-sorted SA-β-GalHI (S) fraction. SAHF (senescence-associated heterochromatin foci) visualized by DAPI nuclear staining. p16 and p21, proteins commonly upregulated in senescence, visualized by immunofluorescence. F- and G-actin, known to exhibit distinct cellular localization in senescence, visualized by fluorescent actin probes. Scale bars, 10 μm. (d) Proteomics sample preparation and analysis workflow. Cultured cells were maintained in a proliferative (P) or quiescent (Q) state or induced to senesce with etoposide. Cytometric analysis of SA-β-Gal distinguished senescent cells, which were sorted into SA-β-GalLO (L) or SA-β-GalHI (S) fractions. Cell lysis and subcellular fractionation was followed by gel electrophoresis and digestion via trypsin. Samples were analyzed using LC-MS/MS and data were analyzed using label-free quantitation.
Figure 2
Figure 2
Proteomics analysis of FACS-enriched senescent cells suggests dysregulation of biological pathways involved in lipid hometostasis. (a) Quadrant plot showing significantly changed protein ratios for senescence versus proliferation (S versus P, x-axis) and senescence versus quiescence (S versus Q, y-axis). Log2 ratio values shown. Many proteins display similarly altered expression in senescence compared to proliferation or quiescence. Solid line: linear regression trendline, determined using significantly changed protein data points (red, green); R2=0.574. (b) Volcano plot visualizing fold change (log2) plotted versus p-value (−log10) for the ratio of protein expression in FACS-enriched senescent cells (S) versus proliferating cells (P). P-values were calculated using mean label-free quantitation spectral intensity data for statistical analysis using a paired, two-tailed t-test. Protein hits meeting both fold change and statistical significance are indicated in green (downregulated) or red (upregulated). Proteins of particular interest are named on the plot. (c) GO categories enriched for significantly changed levels of proteins for senescence versus proliferation (S versus P). Enriched GO categories included terms conventionally associated with senescence and several related to lipid homeostasis. Green, negative change; red, positive change during senescence. Number of proteins per GO term and p-value of term enrichment are shown to right of dot plot. (d) KEGG biological pathways related to lipid homeostasis and glycolipid processing found to be significantly upregulated in senescence, as evidenced by both fold change (black) and p-values (red). (e) Protein network analysis demonstrates interconnections of lipid homeostasis pathways found to be enriched in accelerated senescence. STRING database protein network analysis showing literature-reported interactions between lipid-related proteins identified as upregulated during senescence in this study. Interaction confidence levels are indicated by line weight, as shown. Ten subcategories were identified, from (1) sphingomyelin-ceramide pathway to (10) lipid droplets.
Figure 3
Figure 3
Upregulation of glycolipid processing proteins during accelerated senescence. (a) Heat map showing proteomics and transcriptomics data for glycolipid processing genes upregulated in senescence, including subcategories of galectins, glycan processing proteins, and sphingolipid-ceramide metabolism. (b) Chromogenic staining of glycolipid processing enzymes GLB1, FUCA1/2, HEXA/B, and MAN1/2 using indolyl enzyme substrates as indicated. (c) Flow cytometric analysis of cell surface expression of galectins LGALS3 and LGALS9 on etoposide-treated senescent cells (S, red) and proliferating cells (P, black). (d) Western blot showing upregulation of sphingolipid-ceramide pathway proteins GBA, SGPP1, and SMPD1 in senescent (S) compared to proliferating (P) and quiescent (Q) cells. Equal loading indicated by total protein stain (Ld Ctrl).
Figure 4
Figure 4
Overexpression of proteins involved in cellular lipid homeostasis in accelerated senescence. (a) Heat map showing proteomics and transcriptomics data for lipid homeostasis related genes upregulated in senescence, including subcategories of annexins, fatty acid beta-oxidation, LDs, LDL receptor, lysosomal lipid processing, and phospholipases. (b) Flow cytometric analysis of lipid metabolism-related cell surface proteins LRP1 and PLD3 in proliferating (P, black) and senescent (S, red) cells. (c) Western blotting data confirming upregulation of lipid associated proteins ANXA6, CLN5, CPT1A, DGAT1, PEX1, and PLIN2 in senescent (SA-β-GalLO, L; SA-β-GalHI, S) compared to proliferating (P) and quiescent (Q) cells. Equal protein loading indicated by total protein stain.
Figure 5
Figure 5
Lipid storage droplets are abundant and enlarged in senescent cells. (a) Oil Red O staining reveals larger and more numerous LDs in senescent cells. Scale bar=10 μm. (b) Enumeration of LDs per cell (mean and S.D. indicated, **p<1.0×10⁻⁴ by unpaired, two-tailed t-test, n=20 cells).
Figure 6
Figure 6
Upregulation of lipid import is correlated with SA-β-Gal overexpression in TIS. (a) Images of etoposide-induced senescent cells incubated with fluorescent sphingomyelin, ceramide, or C11 fatty acid for 30 min. Scale bar=10 μm. (b) Flow cytometry analysis of uptake for each fluorescent lipid versus SA-β-Gal, examined in proliferating (P, black) or etoposide-induced senescent cells, indicating SA-β-GalLO (L, blue) and SA-β-GalHI (S, red) populations. General correlation of SA-β-Gal expression versus lipid uptake can be seen, as indicated by solid black line. (c) MFI data for cell populations shown in b. Fold-increase in MFI of SA-β-GalLO (L) or SA-β-GalHI (S) versus proliferating cells (P) is shown at top of graph, **p<1.0×10⁻⁴ by unpaired, two-tailed t-test, n=500 cells.
Figure 7
Figure 7
Ceramide and triglyceride induce accelerated senescence. B16-F10 tumor cells were cultured in media supplemented with standard or delipidized FBS for 72 h. Etoposide (ETOP) induced a similar, high percentage of SA-β-Gal+ cells in both media. Addition of phosphatidylcholine (PC), cardiolipin (CARDIO), sphingomyelin (SPH), low-density lipoprotein (LDL), or cholesterol (CHOL) to the DL-FBS had a small effect on SA-β-Gal. Adding C2-ceramide (CER) or a C2-C10 triglyceride mixture (TRIGLY) enhanced expression of SA-β-Gal, indicating that these lipids effectively induced accelerated senescence.
Figure 8
Figure 8
Therapy-induced senescence is characterized by increased cellular aldehydes and elevated aldehyde dehydrogenase activity. (a) Heat map showing proteomics and transcriptomics data for lipid peroxidation related genes found to be overexpressed in senescence, including subcategories of lipid peroxidation and electrophile quenching. (b) Western blot showing expression of lipofuscinosis related protein CLN5 and mitochondrial aldehyde dehydrogenase ALDH2 in proliferating (P), quiescent (Q), SA-β-GalLO (L) or SA-β-GalHI (S) senescent cells. Equal protein loading indicated by total protein stain (Ld Ctrl). (c) Flow cytometry assay using Alexa 568 hydrazide for aldehyde levels in cells treated with topoisomerase poisons etoposide (ETOP), doxorubicin (DOX), or camptothecin (CPT). For each agent, aldehyde detection by Alexa 568 is plotted versus lipofuscin autofluorescence, a senescence marker associated with lipid peroxidation. A gate drawn to identify high aldehyde, high lipofuscin cells, based on the signal from the proliferating cell control (<5%) indicates high aldehyde levels correspond with lipofuscin accumulation in TIS. (d) Flow cytometry assay with AldeRed-588 for ALDH enzyme activity in cells treated with topoisomerase poisons etoposide (ETOP), doxorubicin (DOX), or camptothecin (CPT). An unstained reference sample is shown in gray. A gate drawn based on the proliferating cell control indicates increased ALDH activity in TIS, with the percentage of ALDHHI cells indicated on each histogram.

References

    1. Ewald JA, Desotelle JA, Wilding G, Jarrard DF. Therapy-induced senescence in cancer. J Natl Cancer Inst 2010; 102: 1536–1546. - PMC - PubMed
    1. Ma Y, Yang H, Pitt JM, Kroemer G, Zitvogel L. Therapy-induced microenvironmental changes in cancer. J Mol Med 2016; 94: 497–508. - PubMed
    1. Gewirtz DA. Autophagy and senescence in cancer therapy. J Cell Physiol 2014; 229: 6–9. - PubMed
    1. Falandry C, Bonnefoy M, Freyer G, Gilson E. Biology of cancer and aging: a complex association with cellular senescence. J Clin Oncol 2014; 32: 2604–2610. - PubMed
    1. Aravinthan A. Cellular senescence: a hitchhiker's guide. Human Cell 2015; 28: 51–64. - PubMed