. 2017 Dec 7;121(48):10869-10881.
doi: 10.1021/acs.jpcb.7b08622. Epub 2017 Nov 21.

Characterization of Solubilizing Nanoaggregates Present in Different Versions of Simulated Intestinal Fluid

Affiliations

Characterization of Solubilizing Nanoaggregates Present in Different Versions of Simulated Intestinal Fluid

Andrew J Clulow et al. J Phys Chem B. .

Abstract

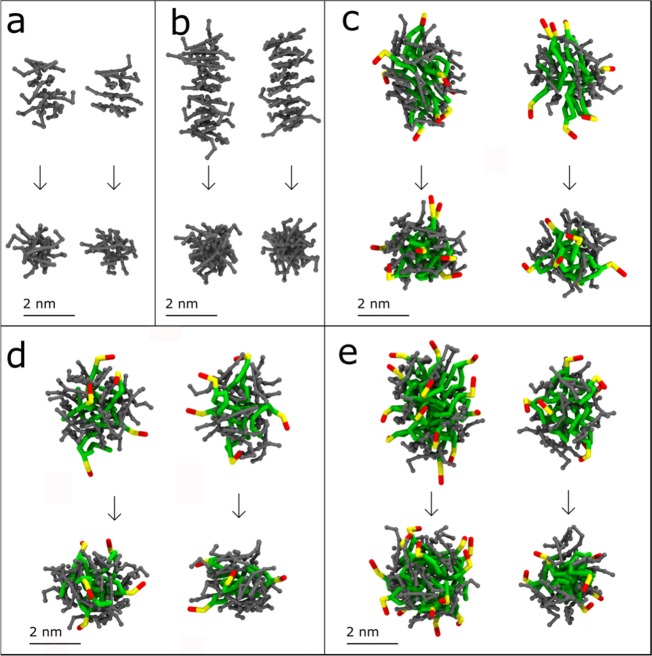
The absorption of hydrophobic drugs and nutrients from the intestine is principally determined by the amount that can be dissolved by the endogenous fluids present in the gut. Human intestinal fluids (HIFs) comprise a complex mixture of bile salts, phospholipids, steroids and glycerides that vary in composition in the fed and fasted state and between subjects. A number of simulated intestinal fluid (SIF) compositions have been developed to mimic fasted and fed state intestinal conditions and allow the in vitro determination of drug solubility as a proxy for the maximum dissolved concentration it is possible to reach. In particular these solvents are used during the development of lipophilic and poorly water-soluble drugs but questions remain around the differences that may arise from the source and methods of preparation of these fluids. In this work, a range of SIFs were studied using small-angle X-ray scattering (SAXS), cryogenic-transmission electron microscopy (cryo-TEM) and molecular dynamics (MD) simulations in order to analyze their structures. In-house prepared SIFs based on sodium taurodeoxycholate (NaTDC) and 1,2-dioleoyl-sn-glycero-3-phosphatidylcholine (DOPC) formed oblate ellipsoidal micelles irrespective of lipid concentration and preparation conditions. In contrast, commercially available SIFs based on sodium taurocholate and lecithin formed prolate ellipsoidal micelles in the fed state and vesicles in the fasted state. These structural variations are the likely reason for the dramatic differences sometimes observed in the solubility enhancements for hydrophobic drugs, nutrients and digestion products when using different SIFs. However, the structural homogeneity of the NaTDC/DOPC micelles makes them ideal candidates for standardizing SIF formulations as the structures of the solubilizing nanoaggregates therein are not sensitive to the preparation method.


Conflict of interest statement

The authors declare no competing financial interest.

Figures

Figure 1
Figure 1
(a) Scattering profiles of fed and fasted bile salt (NaTDC) micelles (BSM). Individual colored points represent the recorded data and the solid black lines indicate fit curves to biaxial ellipsoid models. The CMC of NaTDC has been reported to be 0.8–1.0 mM in the temperature and salt concentration ranges used in the experiments. (b) Scattering profiles of fed and fasted bile salt micelles (BSM) and NaTDC/DOPC mixed micelles (MM) normalized by dividing by the molar concentration of lipids. Individual colored points represent the recorded data and the dashed black lines indicate the BSM curves divided by 10.
Figure 2
Figure 2
(a) Scattering profiles of fed and fasted NaTDC/DOPC mixed micelles (MM) prepared under a variety of conditions. Individual SAXS profiles are offset in intensity for clarity in the direction indicated by the black arrows. Before offsetting, the five Fasted MM profiles overlapped in intensity, as did the three Fed MM profiles. Individual colored points represent recorded data and the black lines represent fit curves. (b) Core–shell ellipsoid fitting models used to fit the data. The colored lines indicate the core and shell boundaries of the MMs with the colors matching the curves in part a, the dotted gray lines indicate the outer radii of the BSMs (modeling in Figure 1) and the dashed black line along x = 0 indicates the principal rotation axis of the ellipsoids. The numbers in the core, shell and solvent portions of the graph indicate the common SLDs used for that portion of the model in units of 10–6 Å–2.
Figure 3
Figure 3
(a) Pair distance distribution function [p(r)] fits and (b) corresponding normalized p(r) functions and characteristic distance probability functions [g(r) = p(r)/4πr2] for Fed and Fasted MMs. The particles have similar p(r) functions at low r indicating similar particle shapes but at higher r the negative values of p(r) beyond the particle radius for the Fed MMs indicate interparticle interactions.
Figure 4
Figure 4
(a) Scattering profiles recorded for freshly prepared and 2-day old FaSSIF media. Individual colored points represent the recorded data and the solid black lines indicate fit curves. The Fresh FaSSIF profile and fit have been offset by an order of magnitude for clarity. (b) SLD versus radius plots used to fit the data in part a. The colored lines represent the changes in SLD as a function of radius from the center of the particles and the dashed black lines indicate the Gaussian distribution (polydispersity) in core radius used in the modeling.
Figure 5
Figure 5
Cryo-TEM images of frozen samples of (a, b) FaSSIF solution showing vesicular particles with diameters on the order of 40 nm and (c, d) FeSSIF solution showing smaller ellipsoidal mixed micelles highlighted in white boxes. Images of the particles shown were observed in at least three independent grid squares.
Figure 6
Figure 6
(a) Scattering profiles for fresh and 2-day old FeSSIF and FeSSIF V2 solutions with the profile of Fed MM in 50 mM Tris buffer included for comparison. (b) Core–shell ellipsoidal fitting models used to fit the SAXS data. (c) p(r) fits and (d) p(r) and g(r) functions for the fresh FeSSIF and FeSSIF V2 media. In parts a and c, individual colored points represent the recorded data and the solid black lines indicate fit curves. The colored lines indicate the core and shell boundaries with the colors matching the curves in part a. The dashed line along x = 0 indicates the principal rotation axis of the ellipsoid and the shell region of the Fed MM in 50 mM Tris model (gray) has been shaded to aid comparison.
Figure 7
Figure 7
Snapshots of two micelles from each of the following simulated systems: (a) Fasted BSM, (b) Fed BSM, (c) Fasted MM, (d) Fed MM, and (e) FeSSIF. In each subfigure two micelles are viewed perpendicular to the principle rotation axis (upper images) and along the principle rotation axis (lower images) and the arrows indicate the 90° rotations. Bile salts are dark gray, phospholipid tails are green and the polar head groups are red and yellow. For the MMs an accumulation of bile salts can be seen around the micelle surfaces with the phospholipids having their head groups pointing outward in all directions and their hydrophobic tails more densely packed in the inner core. The corresponding BSMs are smaller and more prolate or rod-like.
Figure 8
Figure 8
(a) Shape factors of the micelles modeled in the MD simulations. The shape factor was determined from the MD simulations as the ratios of the largest and smallest radius of gyration tensors as described in the experimental methods section, where a sphere will have a shape factor of 1.0. The individual colored crosses indicate the shape factors of individual clusters and the offset colored circular point with error bars represents the average shape factor and standard deviation for the distribution. Shape factors from the SAXS analysis are shown as a single black circle for comparison and were determined by dividing the larger of the axial/equatorial radii by the smaller. All micellar systems showed some degree of ellipticity in both the MD simulations and the SAXS analysis. (b) Micelle sizes determined by the MD simulations, defined as number of CG beads. The five largest clusters (ID 1–5 from largest to smallest) from each system are compared in terms of how many CG beads they contain. Micelle IDs are on the x-axis with the number of CG beads on the y-axis.

References

    1. Dressman J. B.; Vertzoni M.; Goumas K.; Reppas C. Estimating Drug Solubility in the Gastrointestinal Tract. Adv. Drug Delivery Rev. 2007, 59 (7), 591–602. 10.1016/j.addr.2007.05.009. - DOI - PubMed
    1. Fagerberg J. H.; Bergström C. A. S. Intestinal Solubility and Absorption of Poorly Water Soluble Compounds: Predictions, Challenges and Solutions. Ther. Delivery 2015, 6 (8), 935–959. 10.4155/tde.15.45. - DOI - PubMed
    1. Madenci D.; Egelhaaf S. U. Self-Assembly in Aqueous Bile Salt Solutions. Curr. Opin. Colloid Interface Sci. 2010, 15 (1–2), 109–115. 10.1016/j.cocis.2009.11.010. - DOI
    1. Carey M. C.; Small D. M. Micelle Formation by Bile Salts: Physical-Chemical and Thermodynamic Considerations. Arch. Intern. Med. 1972, 130 (4), 506–527. 10.1001/archinte.1972.03650040040005. - DOI - PubMed
    1. Hogan A.; Ealick S. E.; Bugg C. E.; Barnes S. Aggregation Patterns of Bile Salts: Crystal Structure of Calcium Cholate Chloride Heptahydrate. J. Lipid Res. 1984, 25 (8), 791–8. - PubMed

Publication types

Substances

LinkOut - more resources