. 2018 Mar 23;81(3):484-493.
doi: 10.1021/acs.jnatprod.7b00654. Epub 2017 Nov 1.

Biochemometrics to Identify Synergists and Additives from Botanical Medicines: A Case Study with Hydrastis canadensis (Goldenseal)

Affiliations

Biochemometrics to Identify Synergists and Additives from Botanical Medicines: A Case Study with Hydrastis canadensis (Goldenseal)

Emily R Britton et al. J Nat Prod. .

Abstract

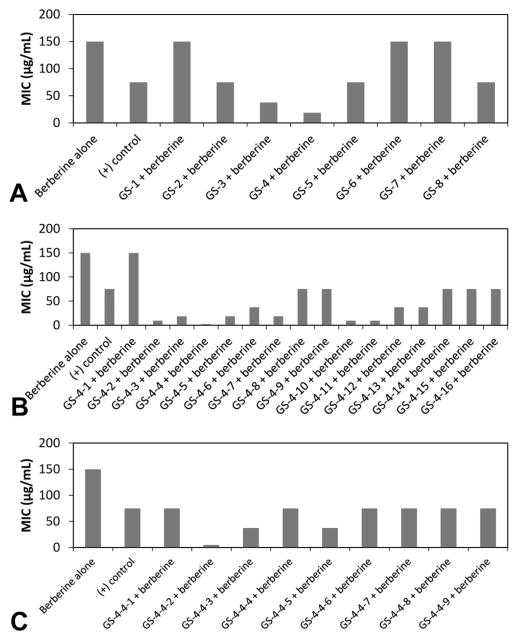
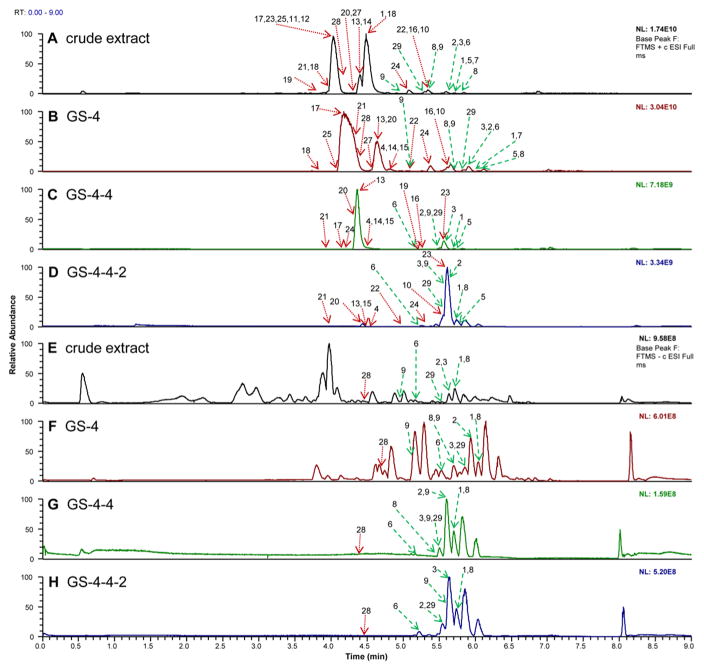
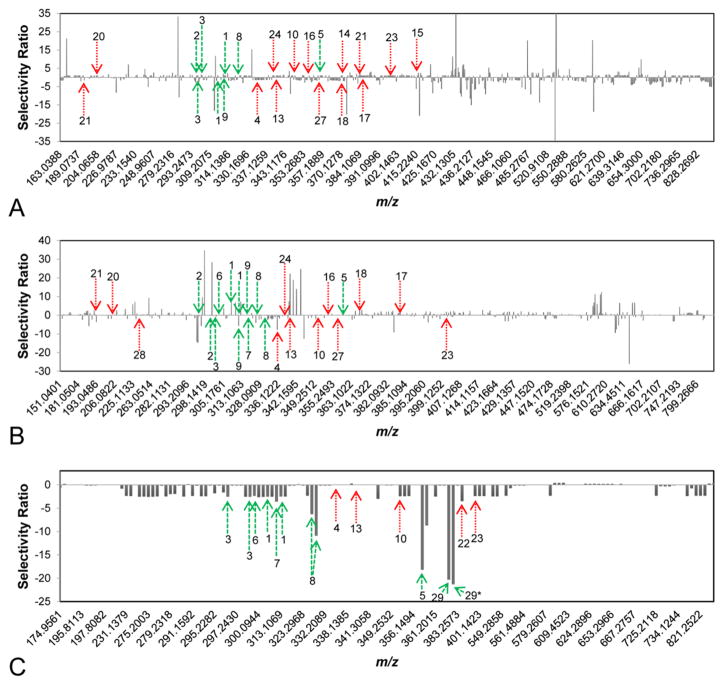
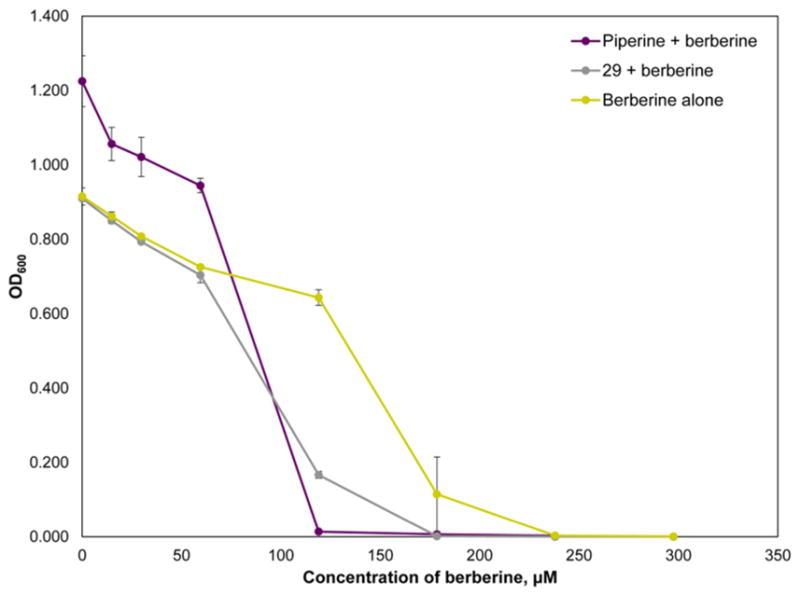
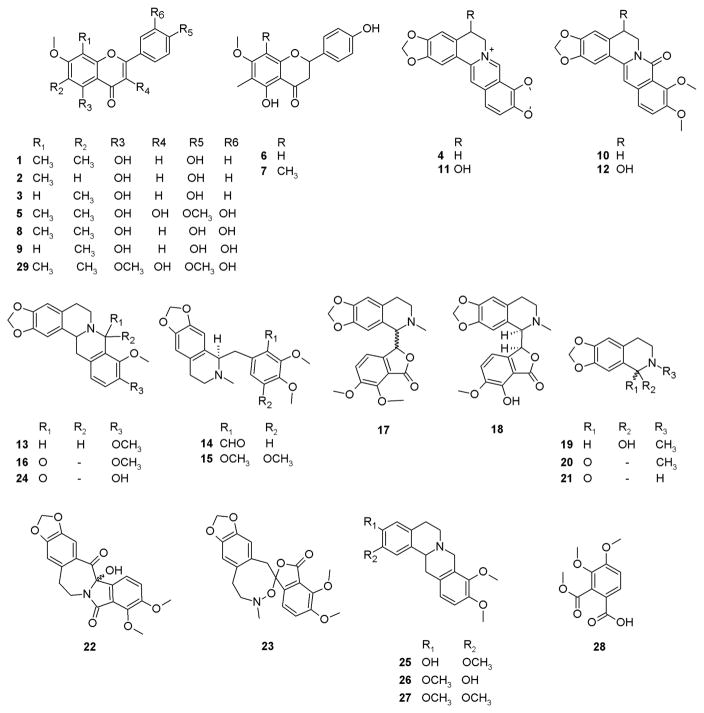
A critical challenge in the study of botanical natural products is the difficulty of identifying multiple compounds that may contribute additively, synergistically, or antagonistically to biological activity. Herein, it is demonstrated how combining untargeted metabolomics with synergy-directed fractionation can be effective toward accomplishing this goal. To demonstrate this approach, an extract of the botanical goldenseal ( Hydrastis canadensis) was fractionated and tested for its ability to enhance the antimicrobial activity of the alkaloid berberine (4) against the pathogenic bacterium Staphylococcus aureus. Bioassay data were combined with untargeted mass spectrometry-based metabolomics data sets (biochemometrics) to produce selectivity ratio (SR) plots, which visually show which extract components are most strongly associated with the biological effect. Using this approach, the new flavonoid 3,3'-dihydroxy-5,7,4'-trimethoxy-6,8- C-dimethylflavone (29) was identified, as were several flavonoids known to be active. When tested in combination with 4, 29 lowered the IC50 of 4 from 132.2 ± 1.1 μM to 91.5 ± 1.1 μM. In isolation, 29 did not demonstrate antimicrobial activity. The current study highlights the importance of fractionation when utilizing metabolomics for identifying bioactive components from botanical extracts and demonstrates the power of SR plots to help merge and interpret complex biological and chemical data sets.


Conflict of interest statement

Notes

The authors declare no competing financial interest.

Figures

Figure 1
Figure 1
Minimum inhibitory concentration (MIC) of each fraction + berberine against S. aureus. Berberine was tested alone, and berberine + piperine served as the positive control. Each fraction was combined at a constant concentration of fraction (75 μg/mL) with varying concentrations of berberine. (A) First-stage normal-phase fractions, where GS-4 lowered the MIC the greatest amount. (B) Secondary fractionation of GS-4 via normal-phase chromatography yielded fractions GS-4-1 through 16, and the fractions therefrom were also tested in combination with berberine. (C) This process was repeated for stage 3, which was prepared using reversed phase chromatographic separation of GS-4-4. Data from which the MIC values were derived, with its associated uncertainty and error bars, can be found in Figure S2 (Supporting Information). Note that error bars are not included in this figure because MIC is defined as the concentration of test compound necessary to completely inhibit bacteria growth, which is the same concentration for all three biological replicates.
Figure 2
Figure 2
LC-MS chromatograms (collected with ultraperformance liquid chromatography coupled to a Q-Exactive Orbitrap mass spectrometer) of a series of H. canadensis extract fractions. (A) Positive-ion electrospray mass spectrometry chromatogram of the crude extract after liquid–liquid partitioning. (B) The most active fraction (GS-4) of the crude extract shown in A after separation with flash chromatography over silica gel using a hexane–chloroform–methanol gradient (stage 1 separation). GS-4 was further fractionated using a second stage of flash chromatography over silica gel with a hexane–ethyl acetate–methanol gradient with GS-4-4 being the most active (C). GS-4-4-2 generated with stage 3 fractionation (using reversed-phase preparative HPLC with a water–acetonitrile gradient) (D). (E–H) The same H. canadensis extract and fractions analyzed using LC-MS in the negative-ion mode. Arrows represent the region of the chromatogram in which a given ion corresponding to a known constituent of H. canadensis (indicated by compound numbers) could be detected. Compounds 17, 10, 13, 16, 17, 2024, and 28 were identified by comparison of retention time and fragmentation with authenticated standards, while compounds 8, 9, 11, 12, 14, 15, 18, 19, and 2527 were tentatively identified by comparison of accurate mass and molecular formula with literature reports.,,,,,, 29 is a new flavonoid that was isolated and identified based on NMR and MS data as part of this report. Red dotted arrows represent alkaloids and other compounds, while green dashed arrows represent flavonoids. In cases where a specific peak is not apparent in the chromatogram, the ion was identified based on mass spectrometric data.
Figure 3
Figure 3
Selectivity ratio plots for first, second, and third stages of fractionation [(A), (B), and (C), respectively] with green dashed arrows representing flavonoids and red dotted arrows representing alkaloids and other known constituents of H. canadensis. The signals of flavonoids and the alkaloid berberine, all known to be or predicted to be active in the assay being used, are not prominent in first-stage fractionation (A) and second-stage fractionation (B). (C) Third-stage fractionation yielded seven flavonoids (1, 2, 3, 5, 6, 8, 29) and three alkaloids (10, 22, 23) with negative selectivity ratios (suggesting these compounds to contribute additively or synergistically to antimicrobial activity). The bar labeled 29* represents the 13C isotope of 29. The identities and activities of compounds represented by other prominent peaks are not known. Selectivity ratio plots were generated by integrating the bioassay data and chemical profile for each stage of fractionation separately. (Data from multiple stages of fractionation were not combined.)
Figure 4
Figure 4
Dose–response curve of berberine ranging from 0 to 298 μM in combination with piperine (positive control, fixed concentration of 263 μM) and 29 (fixed concentration of 200 μM). Error bars represent standard error (error bars are not visible for some data points because they are smaller than the point size). The expected shift to the left (increased potency) in the berberine dose–response curves in the presence of both piperine and 29 was observed. Notably, 29 did not have any antimicrobial effect when tested individually at 200 and 400 μM, which suggests that the increased potency of berberine in combination with this compound is due to synergy and not additivity.
Chart 1
Chart 1

References

    1. Gilbert B, Alves LF. Curr Med Chem. 2003;10:13–20. - PubMed
    1. Wagner H, Ulrich-Merzenich G. Phytomedicine. 2009;16:97–110. - PubMed
    1. Rasoanaivo P, Wright CW, Willcox ML, Gilbert B. Malar J. 2011;10(Suppl1):S4. - PMC - PubMed
    1. Stermitz FR, Lorenz P, Tawara JN, Zenewicz LA, Lewis K. Proc Natl Acad Sci U S A. 2000;97:1433–1437. - PMC - PubMed
    1. Junio HA, Sy-Cordero AA, Ettefagh KA, Burns JT, Micko KT, Graf TN, Richter SJ, Cannon RE, Oberlies NH, Cech NB. J Nat Prod. 2011;74:1621–1629. - PMC - PubMed

Publication types

MeSH terms