. 2017 Oct 31;21(5):1267-1280.
doi: 10.1016/j.celrep.2017.10.009.

Low-Grade Astrocytoma Mutations in IDH1, P53, and ATRX Cooperate to Block Differentiation of Human Neural Stem Cells via Repression of SOX2

Affiliations

Low-Grade Astrocytoma Mutations in IDH1, P53, and ATRX Cooperate to Block Differentiation of Human Neural Stem Cells via Repression of SOX2

Aram S Modrek et al. Cell Rep. .

Abstract

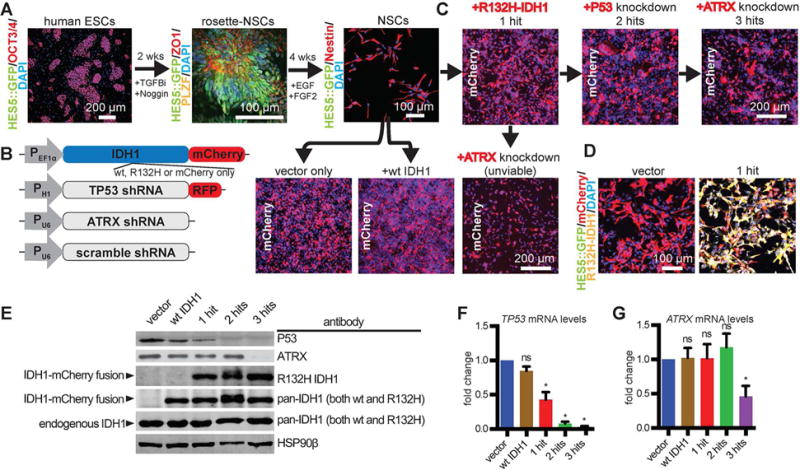
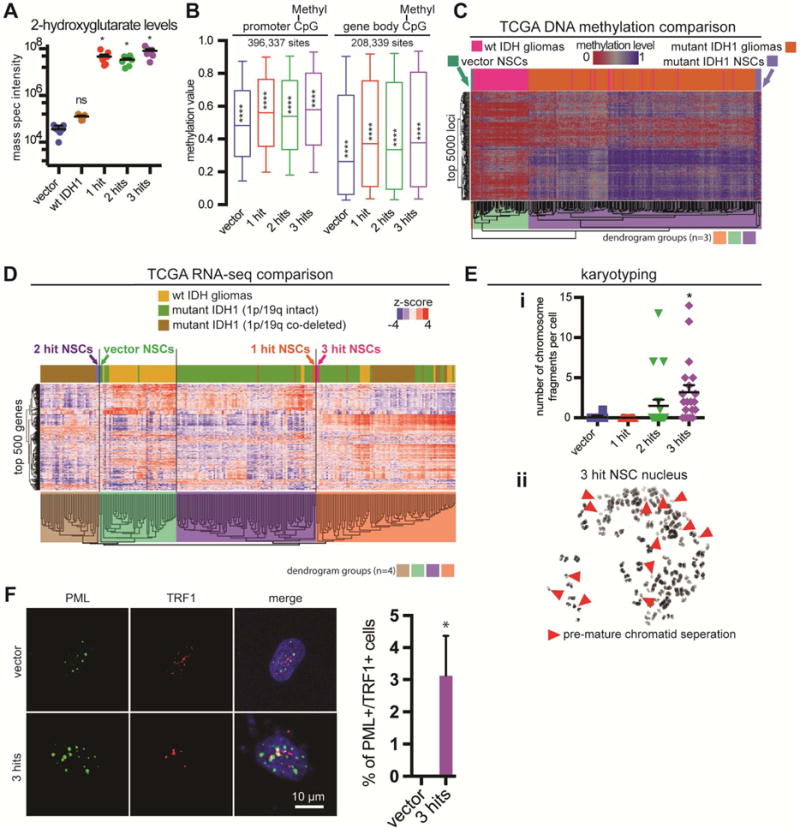
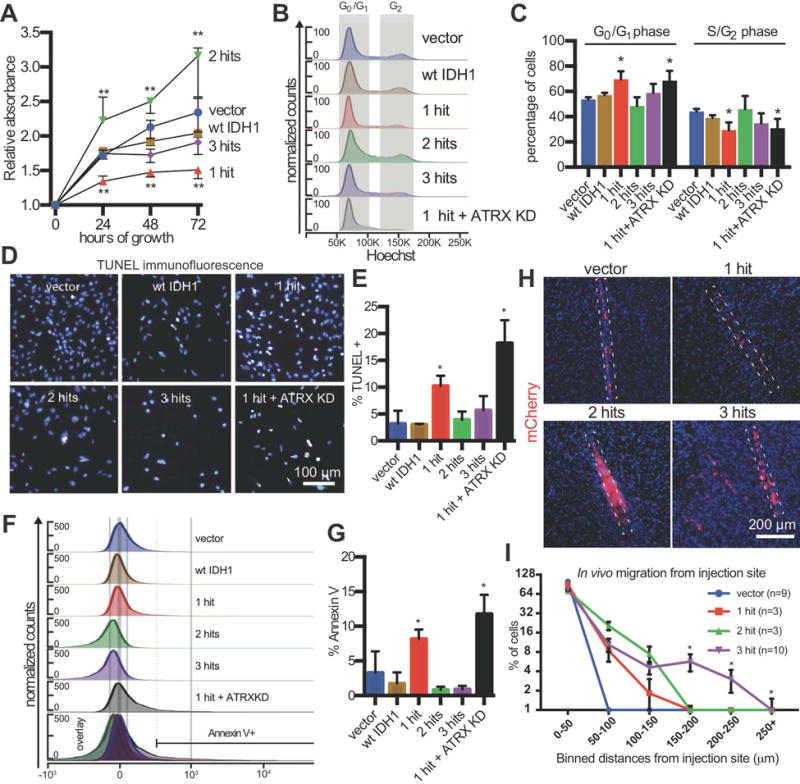
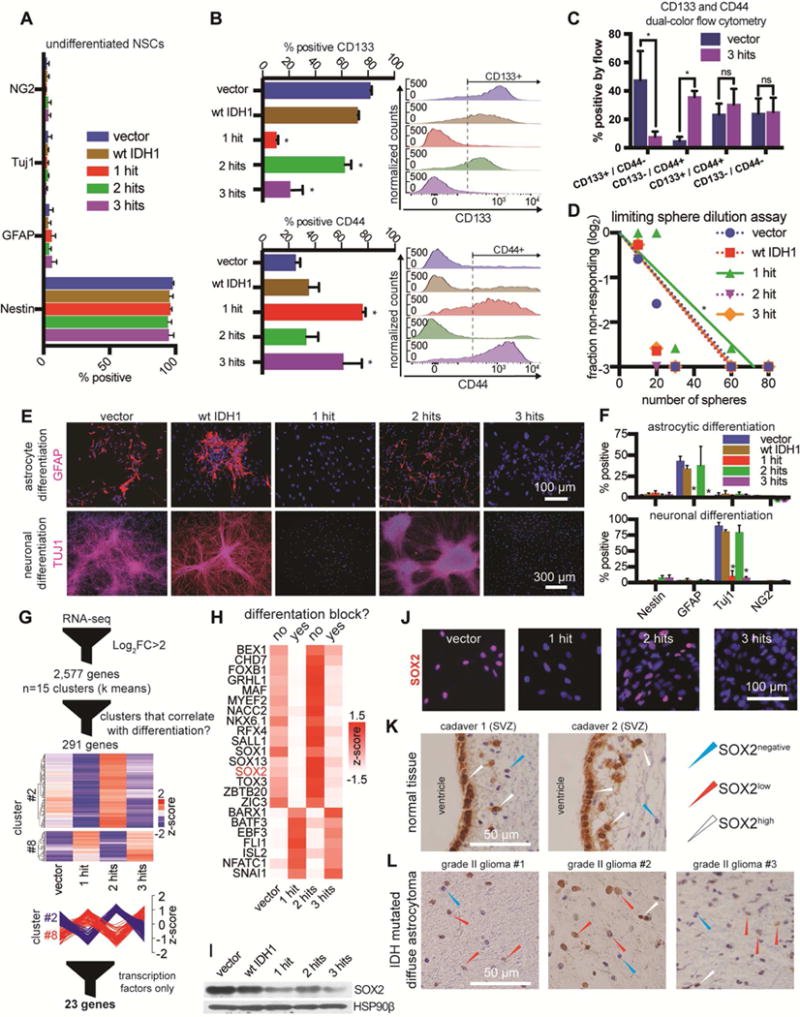
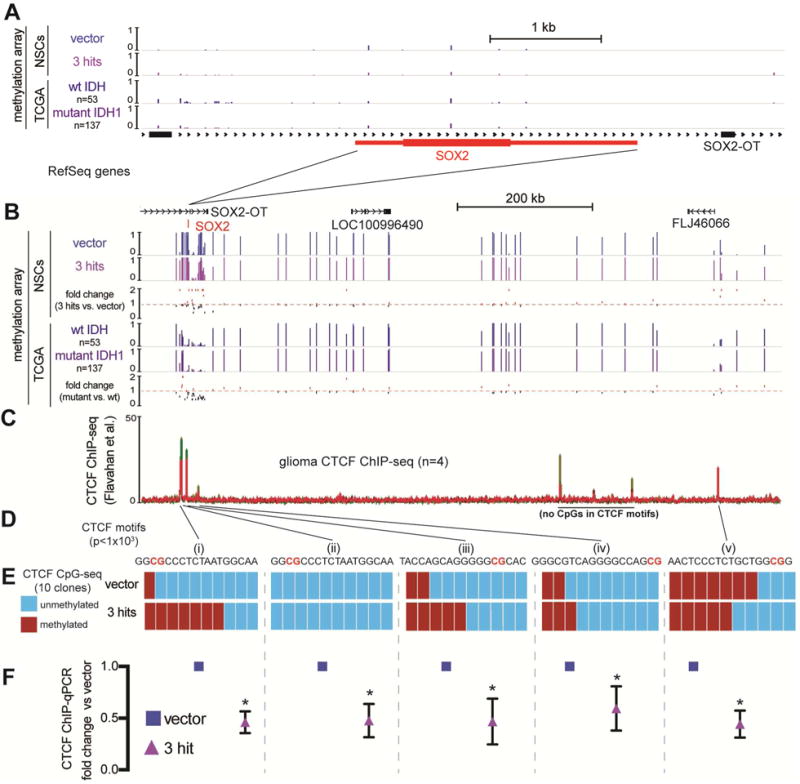
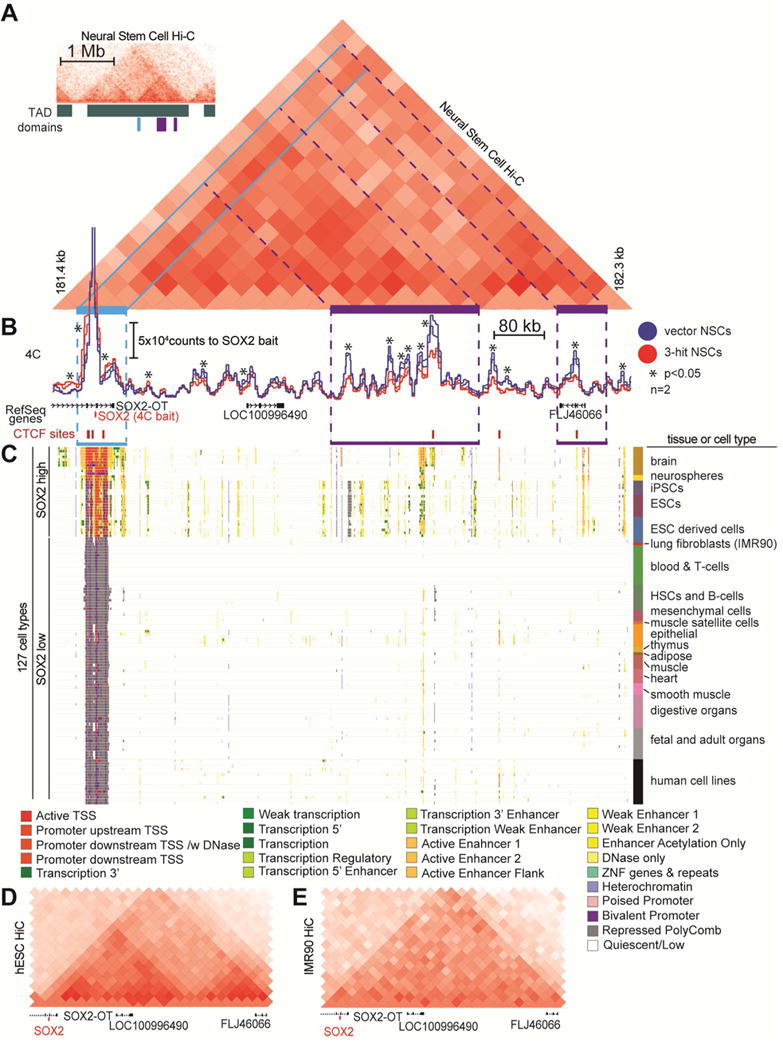
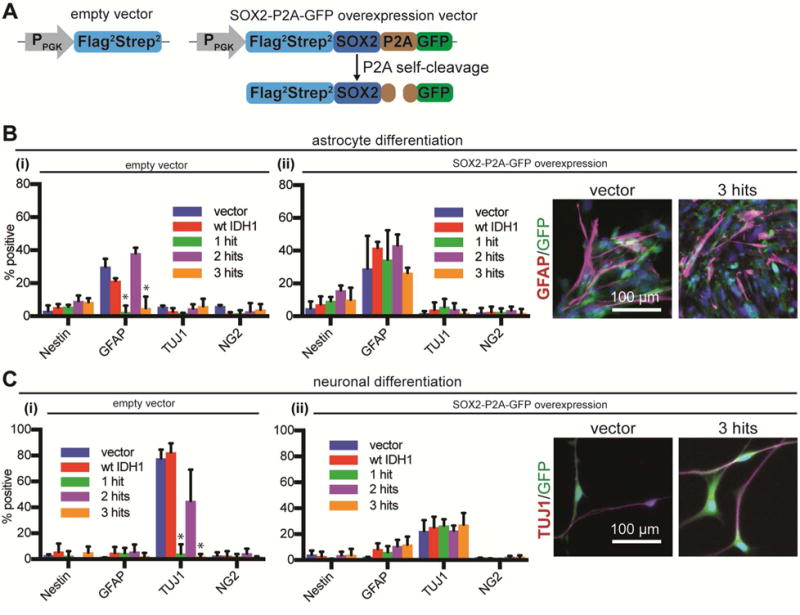
Low-grade astrocytomas (LGAs) carry neomorphic mutations in isocitrate dehydrogenase (IDH) concurrently with P53 and ATRX loss. To model LGA formation, we introduced R132H IDH1, P53 shRNA, and ATRX shRNA into human neural stem cells (NSCs). These oncogenic hits blocked NSC differentiation, increased invasiveness in vivo, and led to a DNA methylation and transcriptional profile resembling IDH1 mutant human LGAs. The differentiation block was caused by transcriptional silencing of the transcription factor SOX2 secondary to disassociation of its promoter from a putative enhancer. This occurred because of reduced binding of the chromatin organizer CTCF to its DNA motifs and disrupted chromatin looping. Our human model of IDH mutant LGA formation implicates impaired NSC differentiation because of repression of SOX2 as an early driver of gliomagenesis.

Keywords: ATRX; CTCF; DNA methylation; IDH; P53; SOX2; astrocytoma; chromatin looping; low-grade glioma; neural stem cells.


Figures

Figure 1
Figure 1. Generation of human NSCs with ectopically expressed R132H IDH1, P53 knockdown and ATRX knockdown
A. Human ESCs (OCT3/4+, HES5::GFP−) were progressed to rosette-NSCs (ZO1+, PLZF+, Hes5::GFP+) over two weeks with TGFβ inhibitor SB431542 (TGFBi; 10 μM) and noggin (100 ng/mL). HES5::GFP+ rosette structures were mechanically dissociated and plated at high densities in EGF and FGF2 over 4 weeks to produce NSCs growing as a monolayer (Nestin+, HES5:: GFP−). B. Lentiviral constructs used to engineer NSCs. PEF1a, EF1a promoter; PH1; H1 promoter; PU8, U8 promoter; RFP, red fluorescent protein. C. Wild-type NSCs were infected with lentiviruses to constitutively express either mCherry alone (vector only), wild-type IDH1-mCherry, or mutant R132H-IDH1-mCherry (1-hit). Cells were then purified for mCherry via FACS sorting. Following these transductions and sorts, cells were transduced with shRNA lentiviruses against P53 or ATRX, in either order. Cells that received ATRX shRNA as the second hit became unviable. D. Immunofluorescence microscopy of mCherry, HES5::GFP and R132H-IDH1 in vector and 1-hit NSCs. E. Western blot using antibodies against P53, ATRX, the R132H mutation and total IDH1. HSP90β, loading control. F. qRT-PCR of TP53 mRNA levels across different conditions (n = 3/condition; ANOVA F(4,10)=48.49, p=0.0048). *p<0.05, post hoc Dunnett’s test; ns, not significant. G. qRT-PCR of ATRX mRNA levels across different conditions (n = 3/condition). *p<0.05, t-test between vector and 3-hit conditions. ns, not significant.
Figure 2
Figure 2. Metabolic, transcriptional, epigenetic and karyotypic properties of transgenic NSCs
A. Quantitative MS for 2HG in genetically modified NSCs (n=6/condition, ANOVA F(4,30)=17.91, p<0.0001). *p<0.05, post hoc Dunnett’s test; ns: not significant. B. Boxplots of beta (methylation) values of CpG sites with probes at genome-wide sites marked as promoters (−1.5kb to +0.5kb from TSS, n=396,337 CpG sites) and at gene bodies (coding and non-coding regions of a gene, n=208,339 sites). NSCs with IDH1 mutation have globally elevated levels of methylation. Statistics for promoter CpGs: n=2 arrays/condition, ANOVA F(3,122696)=475.5, p<0.0001; Statistics for gene body CpGs: n=2 arrays/condition, ANOVA F(3,123352)=283.7, p<0.0001. ****p<0.0001, post hoc Tukey’s test. C. Hierarchical clustering of NSCs with LGGs (wild-type and mutant IDH1 demarcated) using the top 5000 most variable loci defined amongst the TCGA samples. The first three dendrogram levels are highlighted. D. Hierarchical clustering of NSCs with LGGs (wild-type vs. mutant IDH1 and 1p/19q status demarcated) using the top 500 most variable genes defined amongst the TCGA samples. The first four dendrogram levels are highlighted. E. i. The number of chromosome fragments per cell were significantly increased in 3-hit NSCs (n=20, ANOVA F(3,76)=11, p=0.0004). *p<0.05, post hoc Tukey’s test. ii. 3-hit NSCs had a high frequency of premature chromatid separation (red arrowheads). F. PML and TRF1 show co-localization in ~3.1% of 3-hit NSCs, but are not detected in vector NSCs (n=3 trials, ≥3 fields per trial; n=139 total vector NSCs, n=165 total 3-hit NSCs; *p<0.05, paired t-test).
Figure 3
Figure 3. Mutant IDH1, P53 shRNA and ATRX shRNA differentially alter NSC growth rate, cell death and invasiveness
A. In vitro growth assay. NSCs were plated at equal densities and absorbance was measured by WST-1 daily to determine cellular proliferation (n=3/condition, ANOVA F(4,8)=35.81, p<0.001). **p<0.01, post hoc Dunnett’s test. B. Representative flow cytometric cell cycle analysis. C. Quantification of cell cycle phases (n=3/condition, ANOVA F(1,4)=7.98, p=0.0003). **p<0.01, post hoc Dunnett’s test. D. Representative immunofluorescence microscopic image of TUNEL staining. E. Quantification of TUNEL+ cells in (D) (n=3/condition, ANOVA F(2,10)=17.58, p= 0.0208). *p<0.05, post hoc Tukey’s test. F. Representative histogram plots of Annexin V flow cytometry. G. Annexin V was significantly elevated in 1-hit and R132H/ATRX KD NSCs (n=3/condition, ANOVA F(5,12)=16.5, p<0.0001). *p<0.05, post hoc Tukey’s test. H. In vivo invasion assay. mCherry immunostaining of brain sections showing xenografts of NSCs (2.5×10⁵ cells, 4 weeks post-injection) in the frontal lobe of NOD.SCID mice. The dotted rectangles outline the injection tracks. I. Quantification of the percentage of mCherry+ NSCs in binned distances away from the injection site (n=3–10 mice/condition, ≥ 3 fields per mouse). Above the 150 μm cutoff, the 3-hit condition was significantly different from all others (two-way ANOVA F(3,16)=9.487, p<0.001). *q<0.05, post hoc Benjamini correction.
Figure 4
Figure 4. Impaired differentiation in 3-hit NSCs is associated with transcriptional downregulation of SOX2
A. Immunofluorescence quantification of Nestin, GFAP, TUJ1 and Ng2 in NSCs cultured with EGF/FGF2. B. Flow cytometric detection of CD133 (n=3/condition, ANOVA F(4,10)=53.09, p<0.0001). and CD44 (n=3/condition, ANOVA F(4,10)=6.83, p<0.001). *p<0.05, post hoc Tukey’s test. C. CD133 and CD44 dual color flow cytometry (n=3/condition, multiple t-tests). *p<0.05; ns, not significant. D. Sphere formation assay in limiting dilutions (n=3/condition, χ2 pairwise tests, p<0.001). E. Representative immunofluorescence microscopic images of GFAP and TUJ1 in cultures that were differentiated to astrocytes (top) or neurons (bottom). F. Quantification of immunofluorescence markers in astrocytic (top) or neuronal (bottom) differentiation conditions. Astrocyte differentiation: n=3/condition, ANOVA F(4,40)=10.75, p<0.0001; Neuronal differentiation: n=3/condition, ANOVA F(4,40)=86.68, p<0.0001. *p<0.05, post hoc Tukey’s test. G. Vector, 1-hit, 2-hit and 3-hit NSCs were subjected to RNA-seq in duplicates. We found 2,577 differentially expressed genes (log2 fold-change>2 and qvalue<0.05). Genes were clustered into 15 k means groups and represented on a heatmap with no column clustering. Two of the 15 groups had genes with expression patterns that strongly correlated or anti-correlated with the ability of NSCs to differentiate (n=291 genes). Within these 2 groups we identified 23 transcription factors with IPA. H. Transcription factors from (G) were visualized on a heatmap. The list includes SOX2, whose levels correlated with the ability of cells to differentiate. I. Western blot of NSCs shows that SOX2 protein is downregulated most heavily in 1-hit and 3-hit NSCs, and to a lesser degree in 2-hit NSCs. HSP90β, loading control. J. Immunofluorescence microscopy of NSCs stained for SOX2. K. Cadaver tissue immunohistochemical staining of SOX2 reveals SOX2high ependymal cells and NSCs in the SVZ (n=2 adult patients). L. LGA tumors (IDH mutated, P53 and ATRX loss, 1p/19q intact) showing diffuse brain infiltration contain predominantly SOX2low tumor cells (n=3 tumors).
Figure 5
Figure 5. Mutant IDH1-mediated hypermethylation around the SOX2 locus leads to diminished CTCF occupancy
A. The SOX2 locus (~6 kb window) aligned to 450k methylation array tracks of NSCs with the indicated transgenes (n=2) and averaged methylation beta values from TCGA grade II wild-type IDH gliomas (n=53) and mutant IDH, 1p/19q intact astrocytomas (n=157). The SOX2 locus has low levels of methylation in all these conditions. RefSeq genes are shown. B. The region (~1 Mb) containing the SOX2 locus with tracks from (A). Shown below each pair of tracks is the calculated fold change in methylation beta value. Mutant IDH astrocytomas vs. wild-type IDH gliomas share a similar pattern of changes in methylation as the comparison of 3-hit NSCs vs. vector NSCs. C. CTCF ChIP-seq tracks from grade III and IV gliomas (Flavahan et al., 2016). Red: mutant IDH grade III gliomas; Green: wild-type IDH grade IV gliomas. D. CTCF motif analysis of each ChIP peak reveals high confidence CTCF motif locations with CpG sites highlighted in red (MEME suite motif scanning, p<0.001) E. Targeted bisulfite sequencing of CpG sites within indicated CTCF motifs. Ten clones of vector and 3-hit NSCs were sequenced for every site. The most robust hypermethylation in 3-hit NSCs was observed in a CTCF site upstream of SOX2 (i). F. CTCF ChIP-qPCR of each corresponding CTCF site. CTCF occupancy was reduced approximately ~2-fold in every site assayed (p<0.01, multiple t-tests).
Figure 6
Figure 6. The promoter of SOX2 has decreased long-range contacts with putative downstream enhancers in 3-hit NSCs
A. HiC plots in human NSCs (derived from H1 hESCs) in 40 kb bins (Dixon et al., 2015), were reprocessed. The inset on the top left shows a 2 Mb window of the HiC plot, with TADs demarcated. The large HiC plot of a 1.2Mb window shows the genomic region containing SOX2 (light blue highlight) has strong long-range contacts within the entire TAD region (purple highlights). B. 4C using the SOX2 promoter as bait reveals strong long-range downstream contacts in vector NSCs that are diminished in 3-hit NSCs (n=2/condition, p<0.001). C. Epigenetic states of the genomic region downstream of SOX2. Epigenetic data is from the NIH Roadmap Epigenetics Consortium (Roadmap Epigenomics et al., 2015). Each row represents a cell type (n=127) with integrated epigenome data corresponding to 25 different chromatin states (see legend). Cell types that are high for SOX2 have active TSSs and epigenetic marks in enhancer elements downstream of SOX2 that correspond to 4C and HiC contact signals in (A) and (B) (purple highlighting). D,E. HiC plot of (D) hESCs (SOX2 high) and (E) IMR90 lung fibroblasts (SOX2 low) using the same 1.2 Mb genomic window as in (A). These plots demonstrate the genomic organization differences within the TAD that contains SOX2.
Figure 7
Figure 7. SOX2 overexpression rescues the differentiation block in 3-hit NSCs
A. Lentiviral constructs used for overexpression of SOX2. PPGK, PGK promoter. B,C. Vector and 3-hit NSCs were transduced with (i) empty vector, or (ii) SOX2-P2A-GFP lentivirus, directed to differentiate to astrocytes (B) or neurons (C) and immunostained for Nestin, GFAP, TUJ1 and NG2. There was no difference between cultures overexpressing SOX2 (n=3/condition, ANOVA F(4,40)=1.224 for astrocytic and ANOVA F(4,40)=2.1 for neuronal differentiation, both p>0.05). The expected differentiation profiles were seen with empty vector (n=3/condition, ANOVA F(4,40)=48.65 for astrocytic and ANOVA F(4,40)=113 for neuronal differentiation, both p<0.0001). *p<0.05, post hoc Tukey’s test.

References

    1. Amador-Arjona A, Cimadamore F, Huang CT, Wright R, Lewis S, Gage FH, Terskikh AV. SOX2 primes the epigenetic landscape in neural precursors enabling proper gene activation during hippocampal neurogenesis. Proceedings of the National Academy of Sciences of the United States of America. 2015;112:E1936–1945. - PMC - PubMed
    1. Amary MF, Damato S, Halai D, Eskandarpour M, Berisha F, Bonar F, McCarthy S, Fantin VR, Straley KS, Lobo S, et al. Ollier disease and Maffucci syndrome are caused by somatic mosaic mutations of IDH1 and IDH2. Nat Genet. 2011;43:1262–1265. - PubMed
    1. Annovazzi L, Mellai M, Caldera V, Valente G, Schiffer D. SOX2 expression and amplification in gliomas and glioma cell lines. Cancer Genomics Proteomics. 2011;8:139–147. - PubMed
    1. Baer K, Eriksson PS, Faull RL, Rees MI, Curtis MA. Sox-2 is expressed by glial and progenitor cells and Pax-6 is expressed by neuroblasts in the human subventricular zone. Exp Neurol. 2007;204:828–831. - PubMed
    1. Bardella C, Al-Dalahmah O, Krell D, Brazauskas P, Al-Qahtani K, Tomkova M, Adam J, Serres S, Lockstone H, Freeman-Mills L, et al. Expression of Idh1R132H in the Murine Subventricular Zone Stem Cell Niche Recapitulates Features of Early Gliomagenesis. Cancer Cell. 2016;30:578–594. - PMC - PubMed

MeSH terms

Substances