. 2017 Oct 31;21(5):1399-1410.
doi: 10.1016/j.celrep.2017.10.030.

Single-Cell RNA-Seq Analysis of Infiltrating Neoplastic Cells at the Migrating Front of Human Glioblastoma

Affiliations

Single-Cell RNA-Seq Analysis of Infiltrating Neoplastic Cells at the Migrating Front of Human Glioblastoma

Spyros Darmanis et al. Cell Rep. .

Abstract

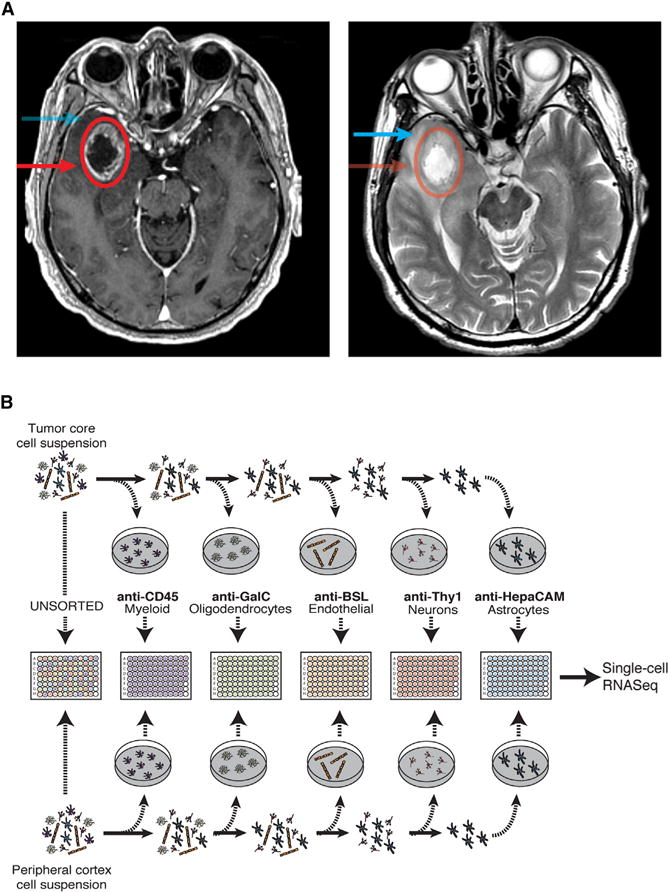
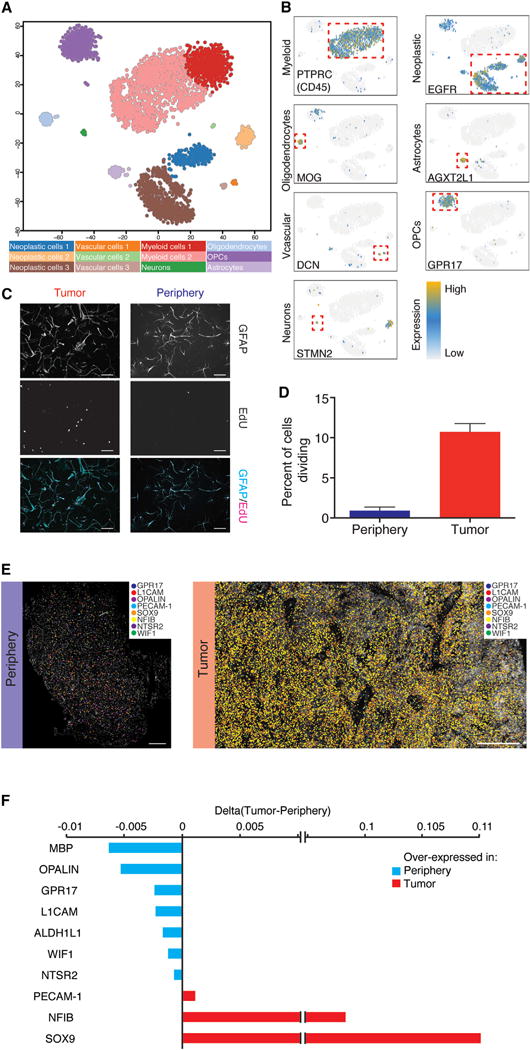
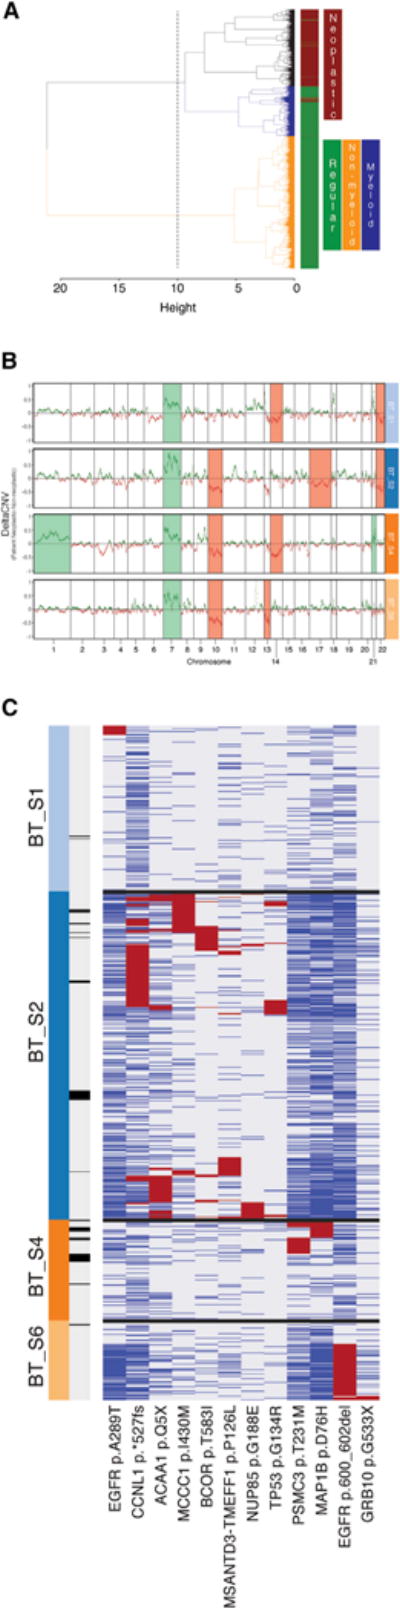
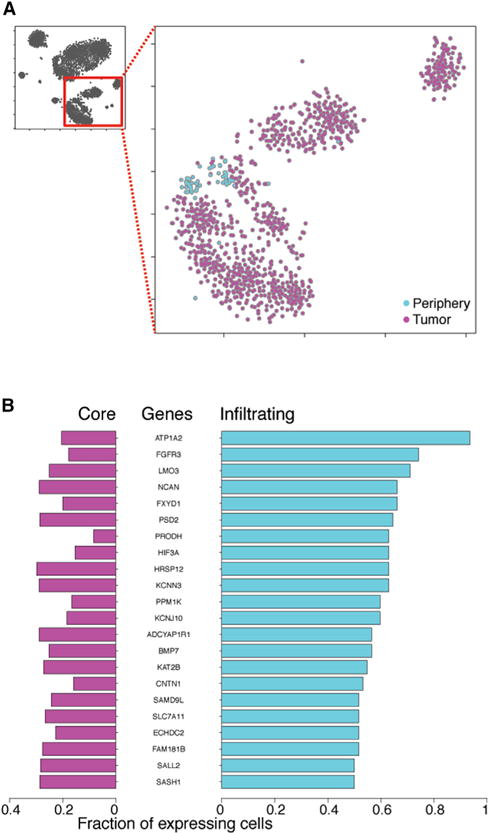
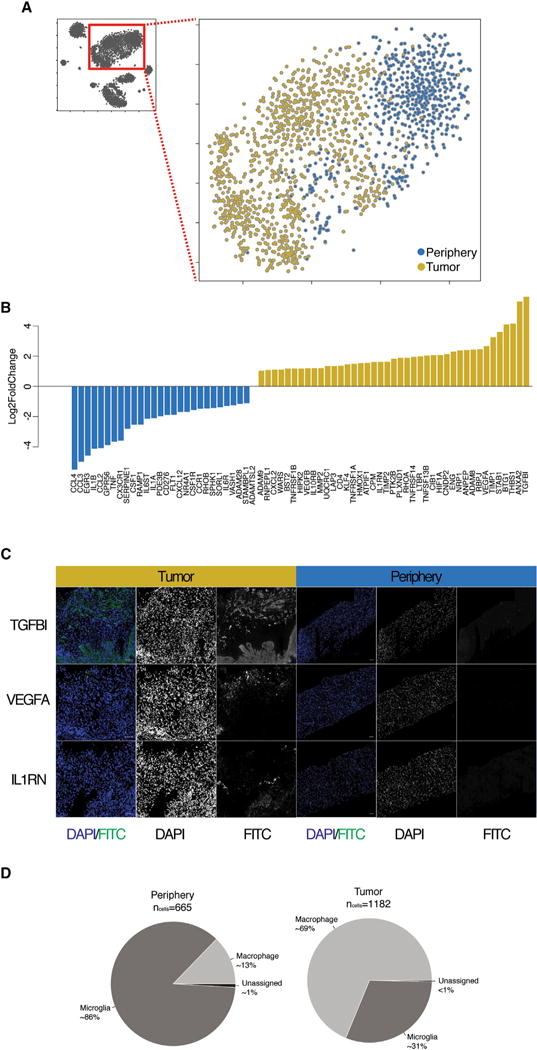
Glioblastoma (GBM) is the most common primary brain cancer in adults and is notoriously difficult to treat because of its diffuse nature. We performed single-cell RNA sequencing (RNA-seq) on 3,589 cells in a cohort of four patients. We obtained cells from the tumor core as well as surrounding peripheral tissue. Our analysis revealed cellular variation in the tumor's genome and transcriptome. We were also able to identify infiltrating neoplastic cells in regions peripheral to the core lesions. Despite the existence of significant heterogeneity among neoplastic cells, we found that infiltrating GBM cells share a consistent gene signature between patients, suggesting a common mechanism of infiltration. Additionally, in investigating the immunological response to the tumors, we found transcriptionally distinct myeloid cell populations residing in the tumor core and the surrounding peritumoral space. Our data provide a detailed dissection of GBM cell types, revealing an abundance of information about tumor formation and migration.

Keywords: GBM; RNA-seq; brain; checkpoint; diffuse; glioblastoma; glioma; heterogeneity; infiltrating; single cell.


Figures

Figure 1
Figure 1. Experimental Layout
(A) Axial T1 with contrast (left side) and T2 (right side) MRI brain in a patient with a right temporal GBM. The tumor core was defined as contrast enhancing (red circle, arrow), and the peritumor was defined as enhancing yet T2 hyperintense (blue arrow). (B) Overview of the experimental procedure.
Figure 2
Figure 2. General Characteristics of Neoplastic Cells
(A) 2D-tSNE representation of all single cells included in the study (n = 3,589). Cell clusters are differentially colored and identified as distinct cell classes. (B) Expression of characteristic cell-type-specific genes overlaid on the 2D-tSNE space. (C) GFAP and EdU staining of HepaCAM-selected cells. (D) Quantification of EdU-positive cells as a percentage of total DAPI nuclei from the tumor core and the surrounding peritumor brain in culture for 7 days. Scale bar, 100 μm. (E) In situ RNA staining of neoplastic and non-neoplastic specific genes in tumor tissue (right) and peritumoral brain (left). Image shown is a composite of smaller images. Scale bar, 500 μm. (F) Quantification of in situ RNA signals shown in Figure 2E. Difference between tumor and peritumoral brain is shown.
Figure 3
Figure 3. Single-Cell CNV and Variant Analysis
(A) Hierarchical clustering of all cells on the basis of their RNA-seq-derived CNV profile. Dendrogram branches are colored to denote different clusters of cells. Color bar demarcates neoplastic (brown) versus non-neoplastic (green) cells. (B) DeltaCNV profiles of each patient’s neoplastic cells and non-neoplastic non-myeloid cells. Specific chromosomes that were found to be over- or underrepresented in each of the patients are highlighted. (C) Exonic non-synonymous variants occurring in greater than 5% of any patient’s neoplastic cells. Cells (columns) might contain a variant (red), not contain the wild-type (blue), or display insufficient read coverage at that position to make a determination (gray). Cells are labeled by patient of origin (top color bar) and infiltrating status (bottom color bar; dark is infiltrating).
Figure 4
Figure 4. Analysis of Infiltrating Tumor Cells
(A) 2D-tSNE representation of all neoplastic cells colored by location (tumor versus periphery). (B) Differentially expressed genes between neoplastic cells originating from the tumor (core) or the periphery (infiltrating). The fraction of tumor core and infiltrating cells expressing any given gene is plotted.
Figure 5
Figure 5. Analysis of Immune Cells
(A) 2D-tSNE representation of all immune cells colored by location (tumor versus periphery). (B) Barplots of log2 fold changes between immune cells from the tumor and periphery for a curated list of genes involved in ECM remodeling, angiogenesis, and immune regulation. (C) IFC staining of TGFBI, VEGFA, and IL1RN in tumor (left) and peripheral tissue (right). Scale bars, 500 μm. (D) Percentage of immune cells from the tumor or periphery classified as macrophages or microglia.

References

    1. Bennett ML, Bennett FC, Liddelow SA, Ajami B, Zamanian JL, Fernhoff NB, Mulinyawe SB, Bohlen CJ, Adil A, Tucker A, et al. New tools for studying microglia in the mouse and human CNS. Proc Natl Acad Sci USA. 2016;113:E1738–E1746. - PMC - PubMed
    1. Binder DC, Davis AA, Wainwright DA. Immunotherapy for cancer in the central nervous system: current and future directions. Oncolmmunology. 2015;5:e1082027. - PMC - PubMed
    1. Bush NAO, Chang SM, Berger MS. Current and future strategies for treatment of glioma. Neurosurg Rev. 2016;40:1–14. - PubMed
    1. Campbell CE, Piper M, Plachez C, Yeh YT, Baizer JS, Osinski JM, Litwack ED, Richards LJ, Gronostajski RM. The transcription factor Nfix is essential for normal brain development. BMC Dev Biol. 2008;8:52. - PMC - PubMed
    1. Cancer Genome Atlas Research Network. Comprehensive genomic characterization defines human glioblastoma genes and core pathways. Nature. 2008;455:1061–1068. - PMC - PubMed