. 2017 Nov 1;12(11):e0187432.
doi: 10.1371/journal.pone.0187432. eCollection 2017.

The cathelicidin protein CRAMP is a potential atherosclerosis self-antigen in ApoE(-/-) mice

Affiliations

The cathelicidin protein CRAMP is a potential atherosclerosis self-antigen in ApoE(-/-) mice

Peter M Mihailovic et al. PLoS One. .

Abstract

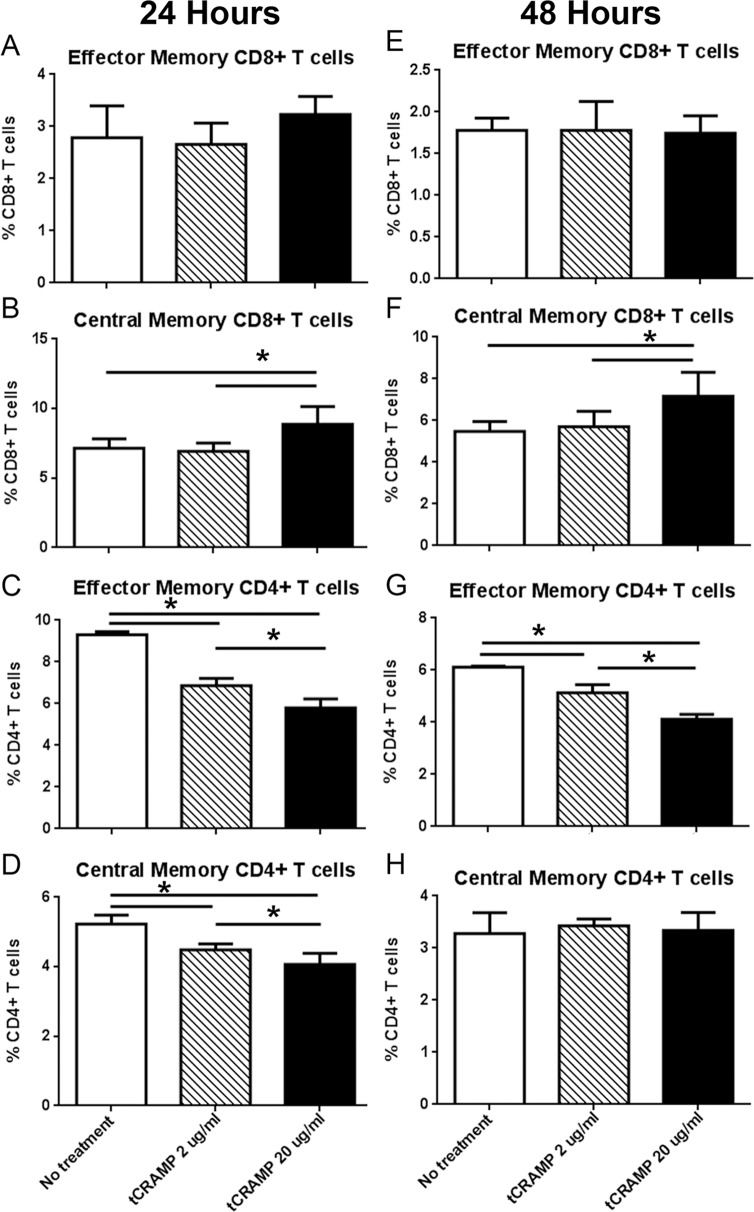
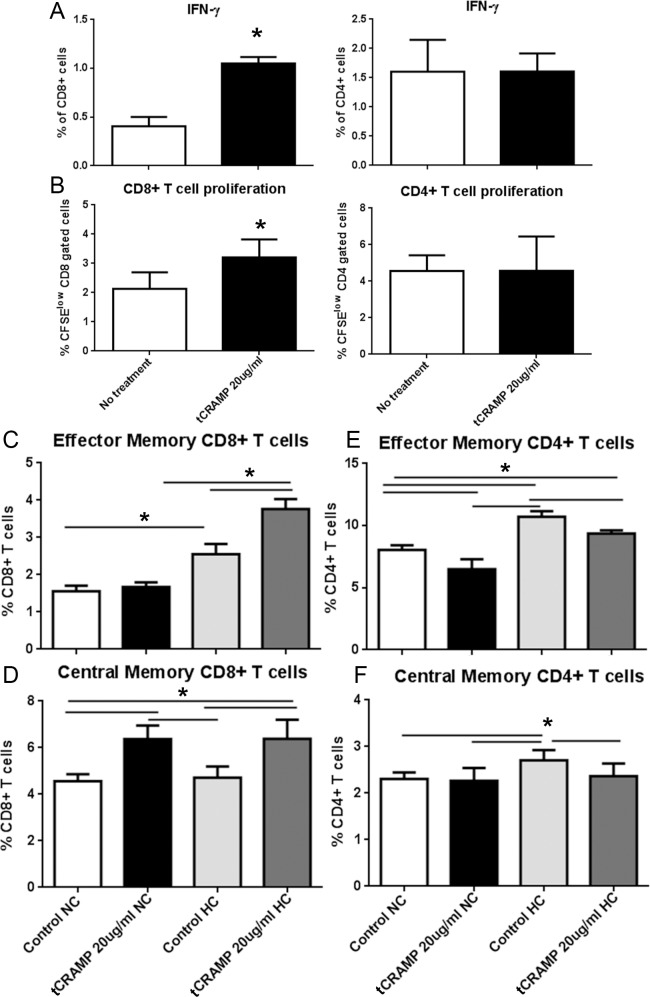
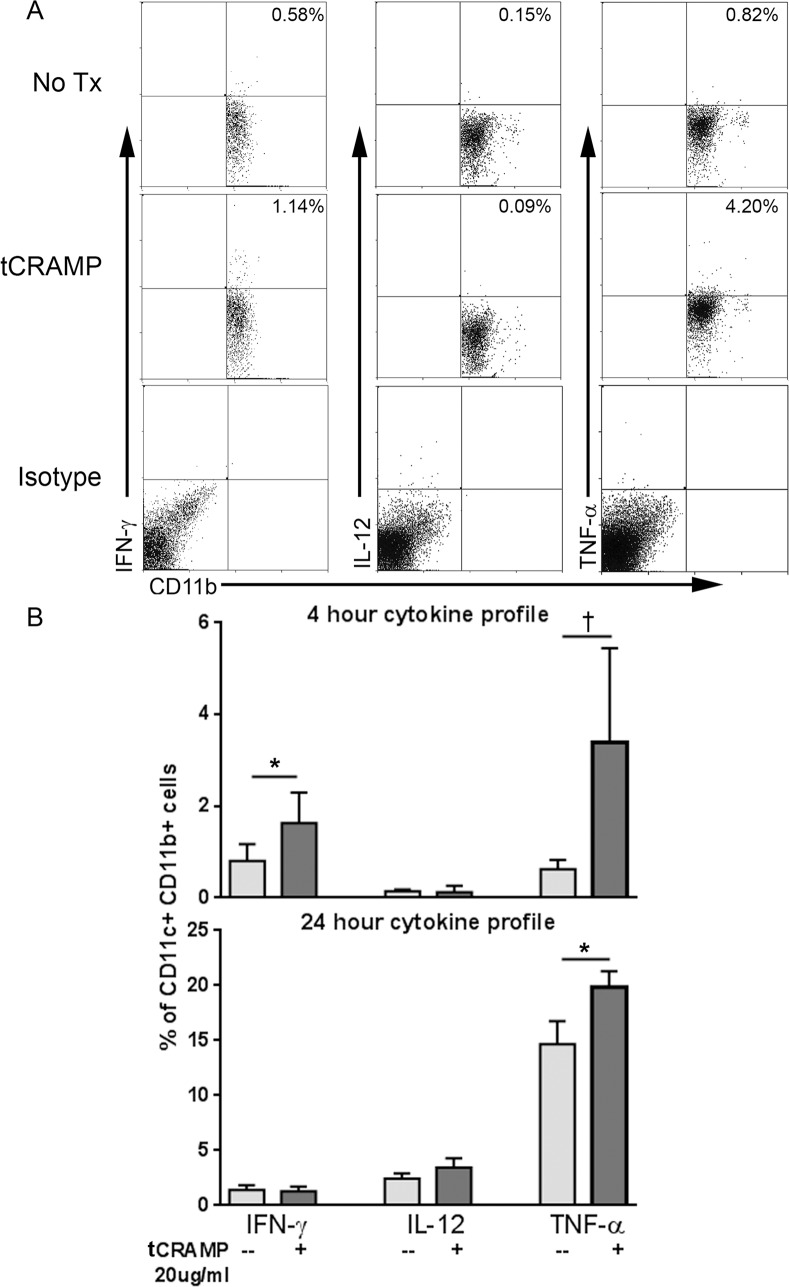
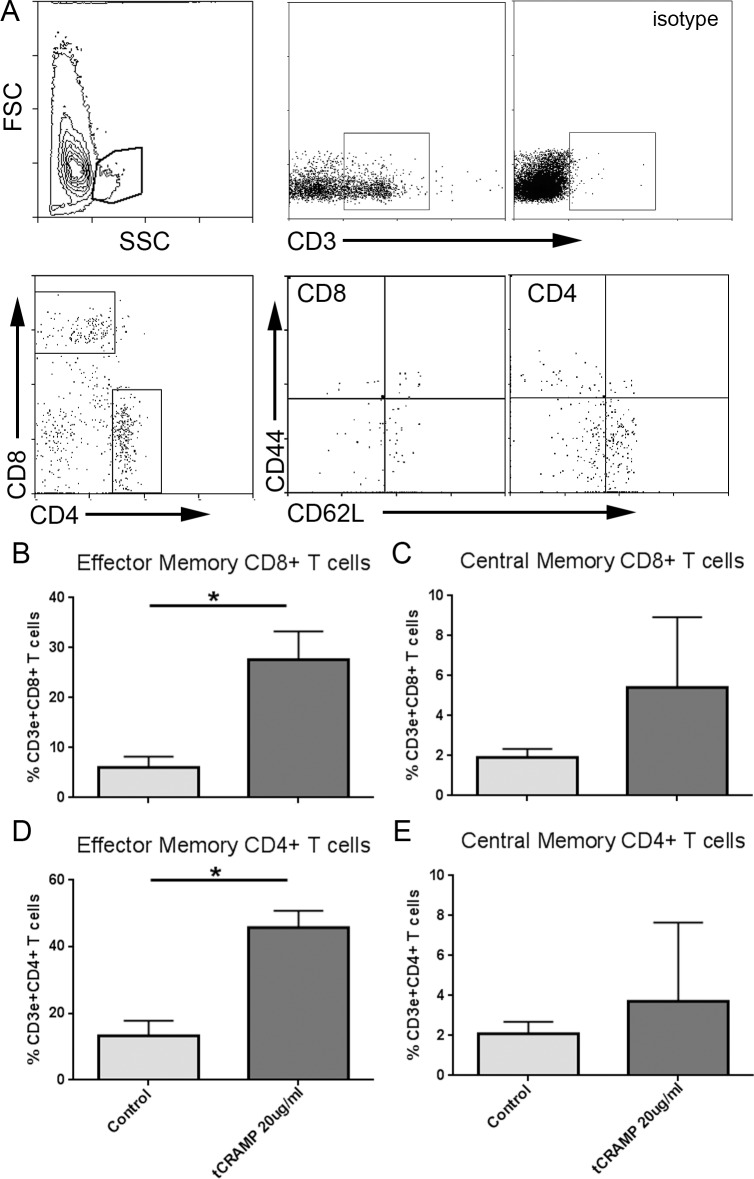
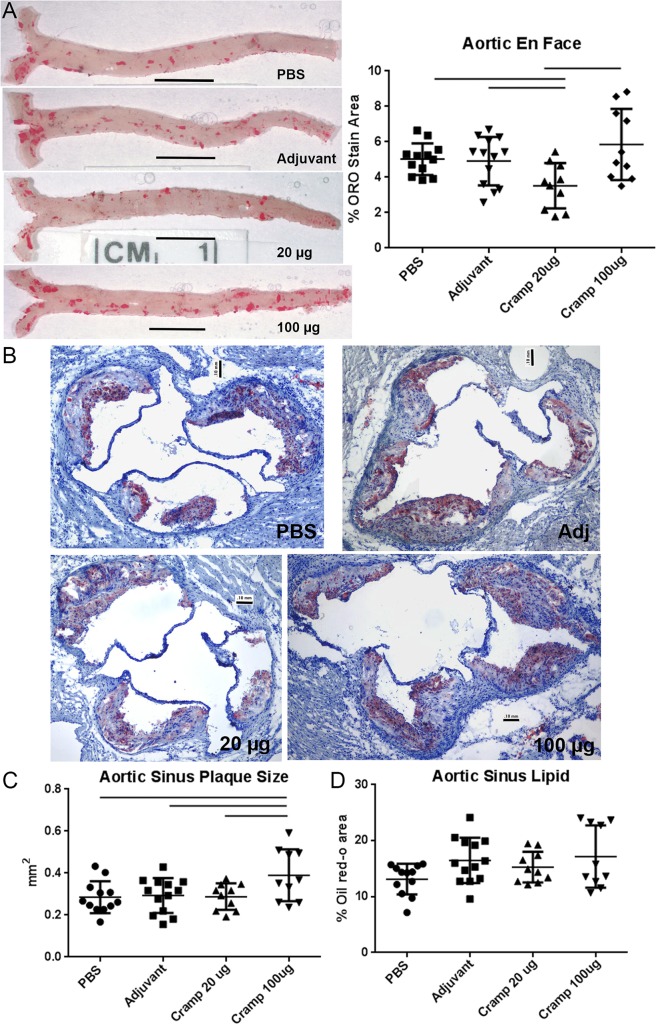
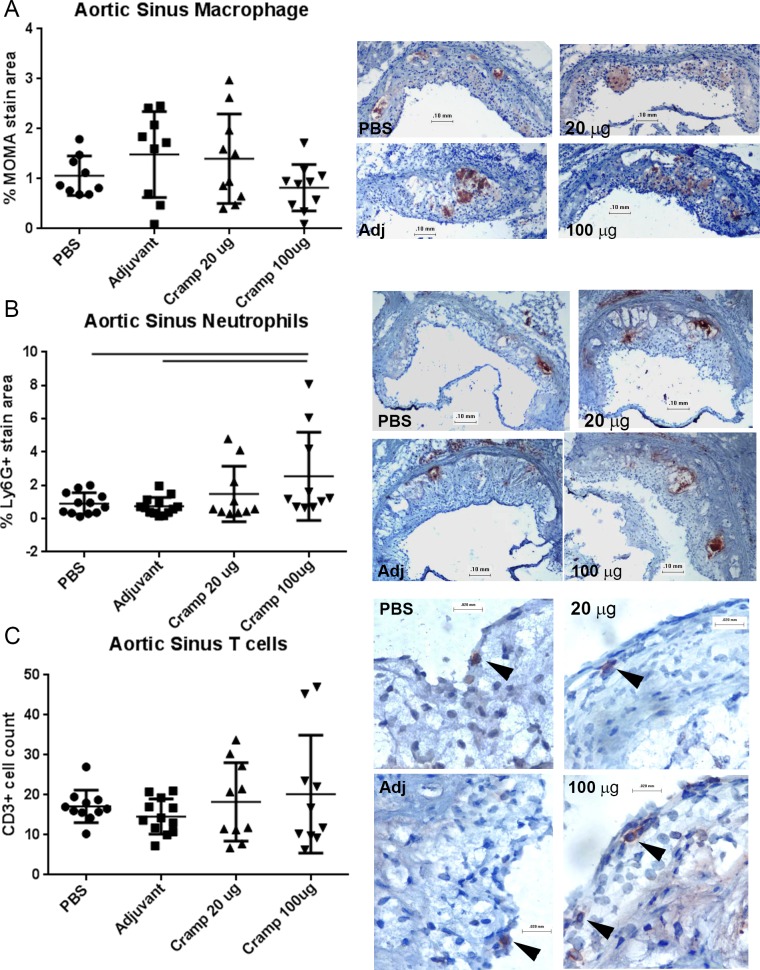
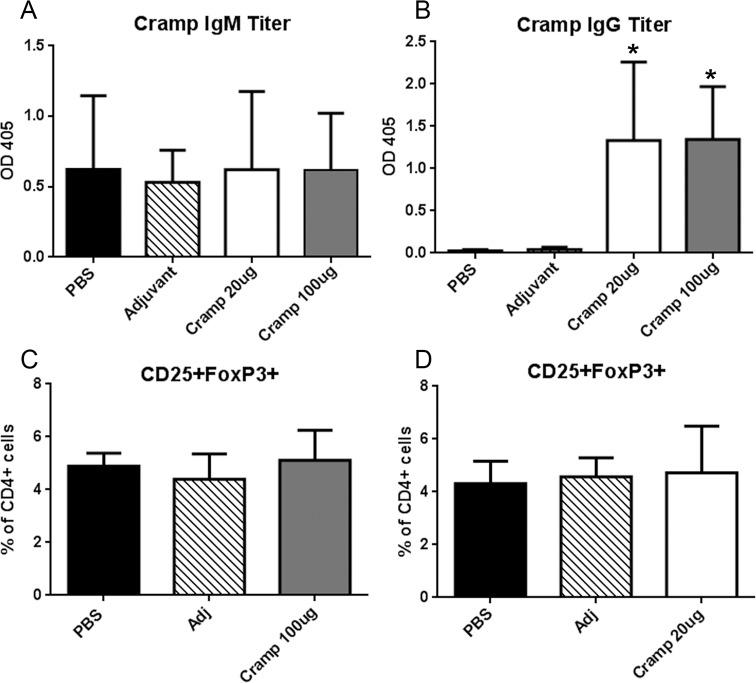
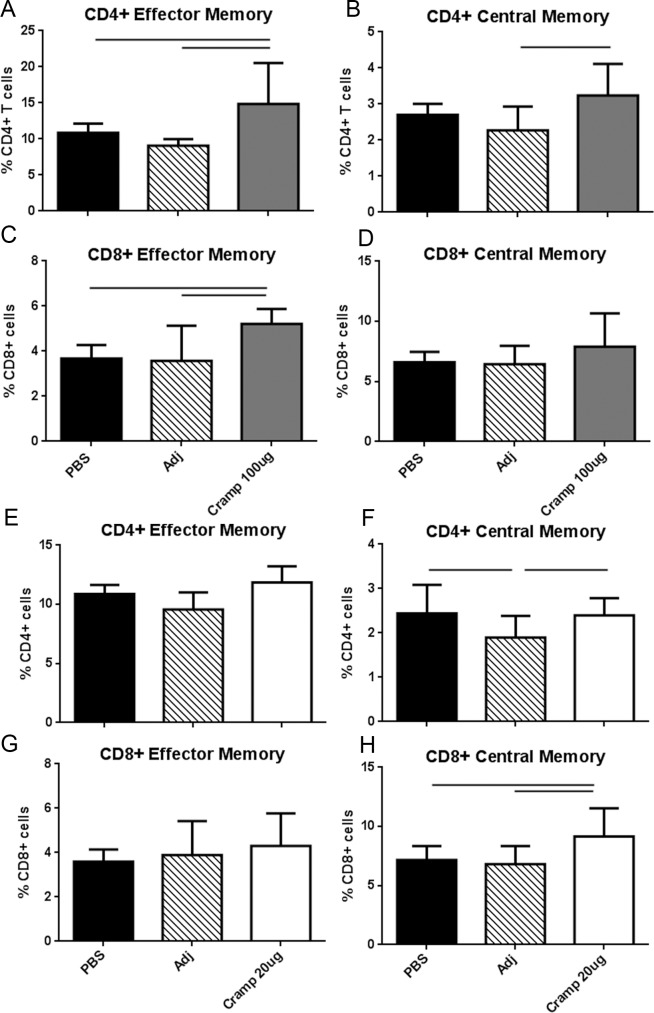
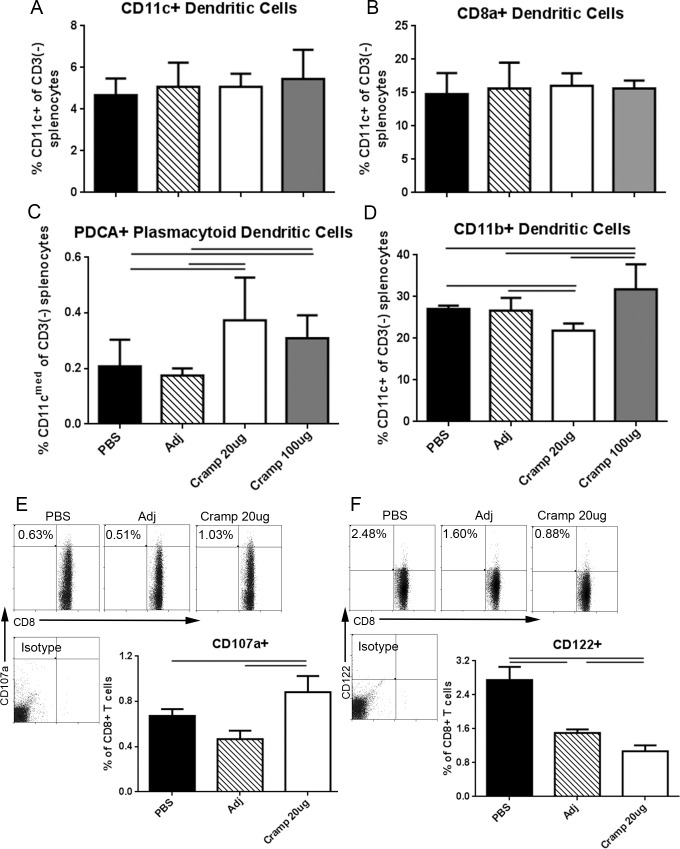
Auto-immunity is believed to contribute to inflammation in atherosclerosis. The antimicrobial peptide LL-37, a fragment of the cathelicidin protein precursor hCAP18, was previously identified as an autoantigen in psoriasis. Given the reported link between psoriasis and coronary artery disease, the biological relevance of the autoantigen to atherosclerosis was tested in vitro using a truncated (t) form of the mouse homolog of hCAP18, CRAMP, on splenocytes from athero-prone ApoE(-/-) mice. Stimulation with tCRAMP resulted in increased CD8+ T cells with Central Memory and Effector Memory phenotypes in ApoE(-/-) mice, differentially activated by feeding with normal chow or high fat diet. Immunization of ApoE(-/-) with different doses of the shortened peptide (Cramp) resulted in differential outcomes with a lower dose reducing atherosclerosis whereas a higher dose exacerbating the disease with increased neutrophil infiltration of the atherosclerotic plaques. Low dose Cramp immunization also resulted in increased splenic CD8+ T cell degranulation and reduced CD11b+CD11c+ conventional dendritic cells (cDCs), whereas high dose increased CD11b+CD11c+ cDCs. Our results identified CRAMP, the mouse homolog of hCAP-18, as a potential self-antigen involved in the immune response to atherosclerosis in the ApoE(-/-) mouse model.


Conflict of interest statement

Competing Interests: The authors have declared that no competing interests exist.

Figures

Fig 1
Fig 1. Response to tCRAMP stimulation of ApoE(-/-) splenocytes.
Splenocytes from naïve 13 week old ApoE(-/-) mice were stimulated with 2 or 20μg/ml truncated(t) CRAMP peptide for 24 hours (A-D) or 48 hours (E-H). Analysis of cell stains was based on the gating scheme depicted in S3 Fig. Bars over graphed columns indicate statistical significance (P<0.05; N = 4 each).
Fig 2
Fig 2. T cell response to tCRAMP and effect of high fat diet.
Splenocytes from 13 week old naïve ApoE(-/-) mice were stimulated with 20μg/ml truncated(t) CRAMP peptide for 48 hours (A) or stained with CFSE and stimulated with CRAMP 4 days (B) then stained for intracellular IFN-γ or analyzed for cell proliferation, respectively. CD8+ T cells are on the left panels and CD4+ T cells are on the right panels. *P<0.05; N = 4 each. Splenocytes from mice fed normal chow (NC) or a high fat diet (HC) for 6 weeks starting at 7 weeks of age were treated with 20μg/ml tCRAMP for 48 hours (C-F). Analysis of cell stains was based on the gating scheme depicted in S3 Fig. Bars over graph columns indicate statistical significance (P<0.05; N = 4 each).
Fig 3
Fig 3. Inflammatory cytokine profile of CD11c+CD11b+ cDCs in mice fed high fat diet.
Splenocytes from naïve mice fed a high fat diet were treated with 20μg/ml tCRAMP for 4 or 24 hours and stained for intracellular cytokines. Isotype staining was used as control. Gating scheme for CD11c+ DCs as depicted in S5 Fig. Representative scatter plots are shown (A). Results were plotted on bar graphs (B). *P<0.05; †P = 0.08. Splenocytes pooled from 2 mice and assayed in triplicates.
Fig 4
Fig 4. Plaque T cells are reactive to tCRAMP simulation.
Aortas from ApoE(-/-) mice at 25 weeks of age were subjected to enzymatic digestion and stimulated for 24 hours with 20μg/ml tCRAMP. Size gate is shown after inclusion of singlets and exclusion of non-viable cells, followed by gating for CD3+ T cells (A). Isotype was used as staining control. Cells were plotted on CD4 vs CD8 and selected for subtype analysis. Results were plotted on bar graphs (B-E). Aortas from 6 mice were pooled and assayed in triplicates. Bars over graph columns indicate statistical significance (P<0.05).
Fig 5
Fig 5. Differential effect of Cramp immunization on atherosclerosis.
The peptide sequence excluding the first 37 amino-acids of the protein (final length is 136 aa, S1 Fig) was synthesized and used for immunization studies. ApoE(-/-) mice fed normal chow were immunized with either 20μg or 100μg of Cramp mixed with adjuvant at 7, 10, and 12 weeks of age then switched to high fat diet at 13 weeks of age. Representative photographs of aortas collected at euthanasia and subjected to en face oil red-o staining are shown for each experimental group (A, left panel), as labeled. Bars = 0.5 cm. Percent aortic plaque area of the aorta obtained by image analysis is plotted for each animal in the respective groups (A, right panel). Bars over graph columns indicate statistical significance; P<0.05. PBS N = 12; Adj N = 13; Cramp 20μg N = 10; Cramp 100μg N = 10. Plaque size and lipid presence were assessed in the aortic sinus of mice using oil red-o staining. Representative photographs are shown for each group as labeled (B). Bar = 0.1mm. Image analysis measurement of plaque size (C) and percent lipid area (D) were plotted. Bar over graph columns indicates statistical significance; P<0.05.
Fig 6
Fig 6. Effect of Cramp immunization on aortic sinus plaque inflammation.
Aortic sinus plaque macrophage (A), neutrophil (B), and T cell (C) infiltration were assessed using immuno-histochemical staining. Representative photographs on the right are shown for each group as labeled. Top and middle photographs bar = 0.1mm; bar for bottom photograph = 0.02mm. Image analysis measurement of percent plaque stain area and cell count were plotted. Bar over graph columns indicates statistical significance; P<0.05. Negative staining controls are found in S6 Fig.
Fig 7
Fig 7. Anti-Cramp Ig titers and FoxP3+ Treg cells in immunized mice.
Serum anti-Cramp IgM titers (A) and anti-Cramp IgG titers (B) were measured and plotted. *P<0.05 vs PBS and Adjuvant. FoxP3+ Treg cells were assessed in ApoE(-/-)FoxP3GFP mice. Splenocytes from Cramp 100μg dosed mice (C) or Cramp 20μg dosed mice (D) were collected one week after the last booster injection and challenged with 20μg/ml tCRAMP for 24 hours and subjected to CD4 and CD25 staining and detection of FoxP3+ Treg cells using GFP fluorescence shown in S3 Fig.
Fig 8
Fig 8. T cell activation in Cramp-immunized mice.
Splenocytes from Cramp 100μg dosed mice (A-D) or Cramp 20μg dosed mice (E-H) were collected one week after the last booster injection and challenged with 20μg/ml tCRAMP for 24 hours and stained for T cell activation markers. Gating is as depicted in S3 Fig. Bar over graph columns indicate statistical significance; P<0.05. Mean of 3 separate experiments with at least 2 mice pooled per group in 3–6 replicates per experiment.
Fig 9
Fig 9. DC subtypes, CD8 cytotoxic degranulation, and CD8+CD122+ Treg cells in splenocytes of immunized mice.
Splenocytes from the different experimental groups were treated with 20μg/ml tCRAMP for 24 hours and stained for markers of DC subtypes (A-D). Gating is as depicted in S5 Fig. Bars over graph columns indicate statistical significance; P<0.05. Mean of 3–5 separate experiments with at least 2 mice pooled per group in 3–4 replicates per experiment. Splenocytes from mice immunized with 20μg Cramp, adjuvant, or PBS were treated with 20μg/ml tCRAMP for 4 hours in the presence of 2μg/ml fluorescently labeled CD107a monoclonal antibody. Cells were also stained for CD8b and CD122, and analyzed for CD107a+ degranulation (E) or CD8+CD122+ Treg cells (F). Analysis excluded CD49b+ cells. Isotype staining was used as control. Results of the analysis were plotted on bar graphs. Bars over graph columns indicate statistical significance; P<0.05.

References

    1. Nilsson J, Hansson GK. Autoimmunity in atherosclerosis: a protective response losing control? J Intern Med. 2008;263(5): 464–478. doi: 10.1111/j.1365-2796.2008.01945.x - DOI - PubMed
    1. Zhou X, Nicoletti A, Elhage R, Hansson GK. Transfer of CD4(+) T cells aggravates atherosclerosis in immunodeficient apolipoprotein E knockout mice. Circulation. 2000;102(24): 2919–2922. - PubMed
    1. Stemme S, Faber B, Holm J, Wiklund O, Witztum JL, Hansson GK. T lymphocytes from human atherosclerotic plaques recognize oxidized low density lipoprotein. Proc Natl Acad Sci U S A. 1995;92(9): 3893–3897. - PMC - PubMed
    1. Almanzar G, Ollinger R, Leuenberger J, Onestingel E, Rantner B, Zehm S, et al. Autoreactive HSP60 epitope-specific T-cells in early human atherosclerotic lesions. J Autoimmun. 2012;39: 441–450. doi: 10.1016/j.jaut.2012.07.006 - DOI - PMC - PubMed
    1. Nilsson J, Bjorkbacka H, Fredrikson GN. Apolipoprotein B100 autoimmunity and atherosclerosis—disease mechanisms and therapeutic potential. Curr Opin Lipidol. 2012;23(5): 422–428. doi: 10.1097/MOL.0b013e328356ec7c - DOI - PubMed