

Hormonal Correlates and Predictors of Nutritional Recovery in Malnourished African Children
- PMID: 29092084
- PMCID: PMC6166213
- DOI: 10.1093/tropej/fmx075
Hormonal Correlates and Predictors of Nutritional Recovery in Malnourished African Children
Abstract
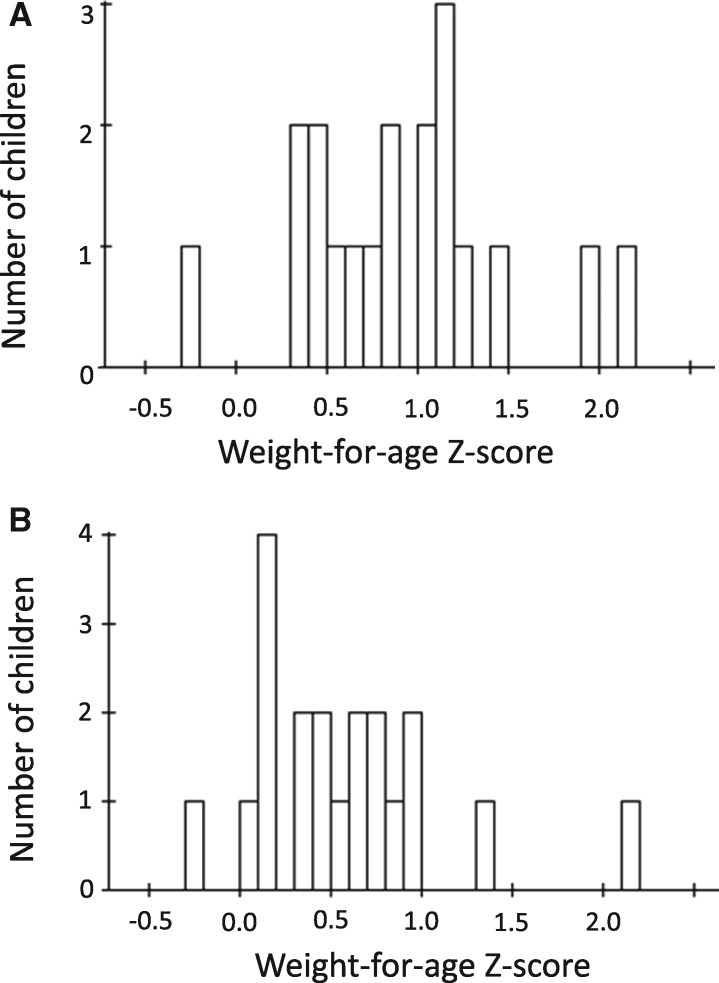
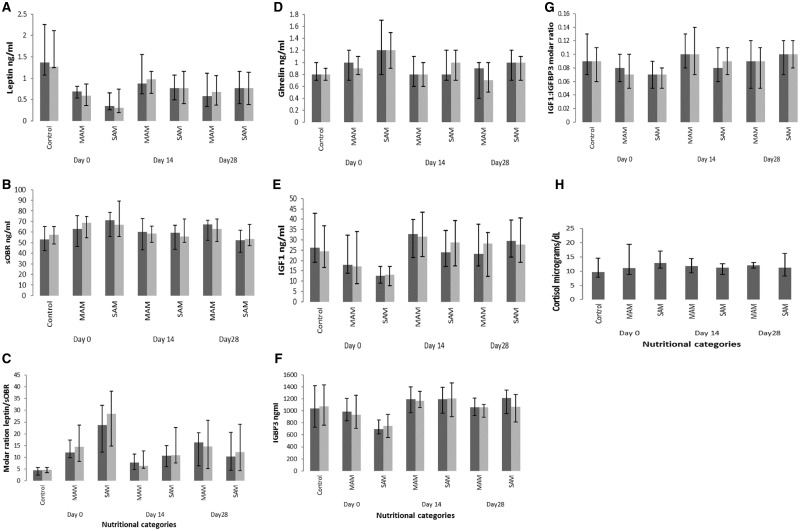
Background: Malnourished children show variable growth responses to nutritional rehabilitation. We aimed to investigate whether these differences could be explained by variations in growth and energy-regulating hormones.
Methods: Quasi-experimental study: Children aged 6-24 months in rural Gambia were recruited to controls if weight-for-height z-score (WHZ) > -2 (n = 22), moderate acute malnutrition if WHZ < -2 and > -3 (n = 18) or severe acute malnutrition if WHZ < -3 (n = 20). Plasma hormone and salivary CRP levels were determined by ELISA.
Results: In univariable analyses, increases in weight-for-age z-score (WAZ) in malnourished children were positively correlated with insulin (F-ratio 7.8, p = 0.006), C-peptide (F-ratio 12.2, p < 0.001) and cortisol (F-ratio 5.0, p = 0.03). In multivariable analysis, only baseline C-peptide (F-ratio 7.6, p = 0.009) predicted the changes in WAZ over 28 days of interventions.
Conclusion: In rural Gambian, malnourished children, although it cannot be used in isolation, baseline C-peptide was a predictor of future response to rehabilitation.
Figures
References
-
- Black RE, Victora CG, Walker SP, et al.Maternal and child undernutrition and overweight in low-income and middle-income countries. Lancet 2013;382:427–51. - PubMed
-
- WHO. Guideline Updates on the Management of Severe Acute Malnutrition in Infants and Children. Geneva, Switzerland: World Health Organisation, 2013. - PubMed
-
- Karlberg J. On the modelling of human growth. Stat Med 1987;6:185–92. - PubMed
-
- Whitehead RG. Protein and energy requirements of young children living in the developing countries to allow for catch-up growth after infections. Am J Clin Nutr 1977;30:1545–7. - PubMed
Publication types
MeSH terms
Substances
Grants and funding
LinkOut - more resources
Full Text Sources
Other Literature Sources
Medical
Research Materials
Miscellaneous
