. 2018 Jan;67(1):85-97.
doi: 10.2337/db17-0367. Epub 2017 Nov 1.

Uncoupling Exercise Bioenergetics From Systemic Metabolic Homeostasis by Conditional Inactivation of Baf60 in Skeletal Muscle

Affiliations

Uncoupling Exercise Bioenergetics From Systemic Metabolic Homeostasis by Conditional Inactivation of Baf60 in Skeletal Muscle

Zhuo-Xian Meng et al. Diabetes. 2018 Jan.

Abstract

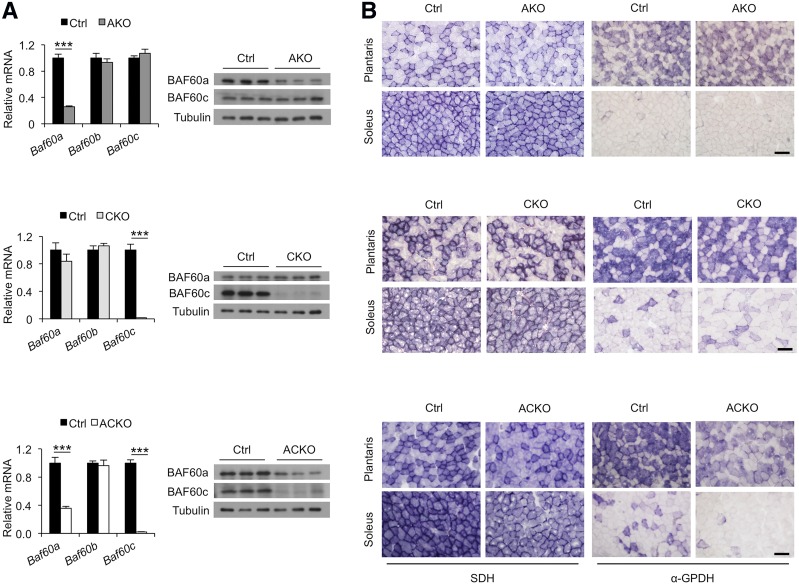
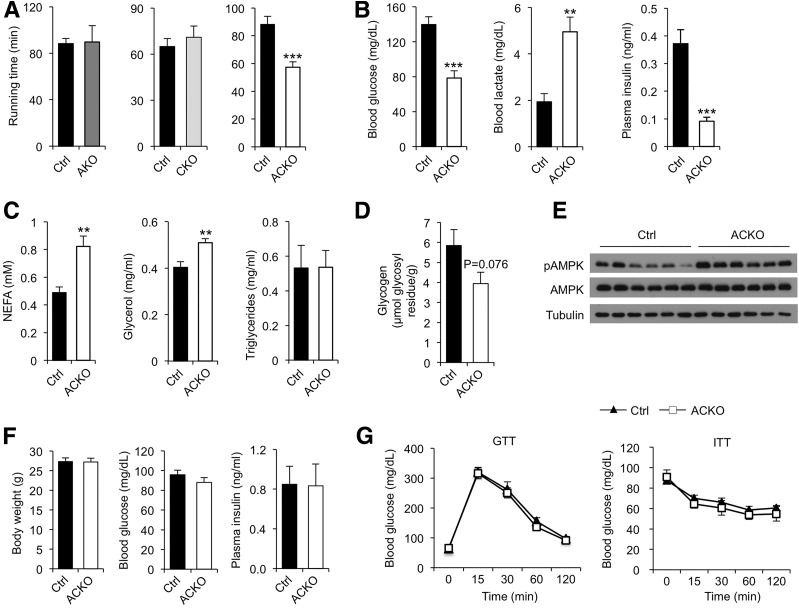
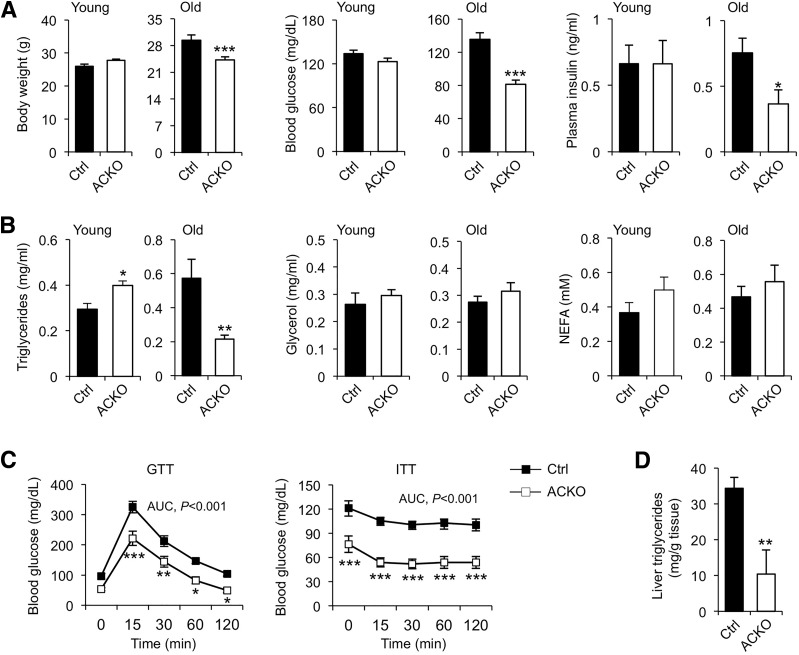
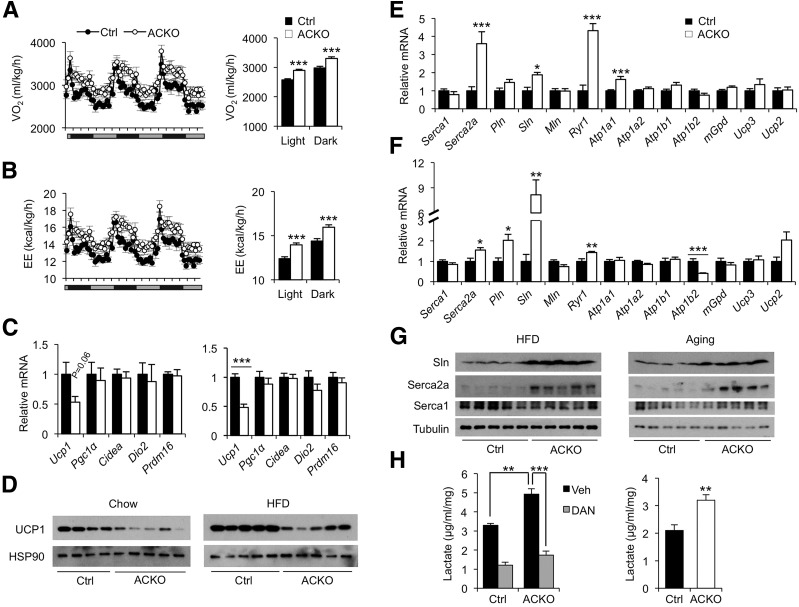
Impaired skeletal muscle energy metabolism is linked to the pathogenesis of insulin resistance and glucose intolerance in type 2 diabetes. The contractile and metabolic properties of myofibers exhibit a high degree of heterogeneity and plasticity. The regulatory circuitry underpinning skeletal muscle energy metabolism is critically linked to exercise endurance and systemic homeostasis. Recent work has identified the Baf60 subunits of the SWI/SNF chromatin-remodeling complex as powerful regulators of the metabolic gene programs. However, their role in integrating myofiber energy metabolism with exercise endurance and metabolic physiology remains largely unknown. In this study, we conditionally inactivated Baf60a, Baf60c, or both in mature skeletal myocytes to delineate their contribution to muscle bioenergetics and metabolic physiology. Our work revealed functional redundancy between Baf60a and Baf60c in maintaining oxidative and glycolytic metabolism in skeletal myofibers and exercise endurance. Unexpectedly, mice lacking these two factors in skeletal muscle were protected from diet-induced and age-associated metabolic disorders. Transcriptional profiling analysis identified the muscle thermogenic gene program and myokine secretion as key pathways that integrate myofiber metabolism with systemic energy balance. As such, Baf60 deficiency in skeletal muscle illustrates a surprising disconnect between exercise endurance and systemic metabolic homeostasis.


Figures

Figure 1
Figure 1
Role of Baf60a and Baf60c in skeletal muscle energy metabolism. A: Baf60a and Baf60c mRNA and protein expression in quadriceps muscles from AKO (n = 3), CKO (n = 6), and ACKO (n = 4–5) mice and their respective littermate controls (Ctrl). Data represent mean ± SEM. ***P < 0.001. B: Representative histochemical staining of SDH (left) and α-GPDH (right) enzymatic activity in plantaris and soleus muscles. Scale bars, 100 μm.
Figure 2
Figure 2
Regulation of skeletal muscle transcriptome by Baf60a and Baf60c. A: Morphology of gastrocnemius (left), quadriceps (middle), and soleus (right) muscles from control (Ctrl) and ACKO mice. B: H&E (top) and Laminin B immunofluorescent (bottom) staining of tibialis anterior (TA) muscle sections. C and D: Weight (C) and glycogen content (D) of gastrocnemius (Gast), TA, and EDL muscles from chow-fed control and ACKO mice (n = 4–5). E: Heat map representation of Baf60-regulated genes in skeletal muscle. F: Enrichment score for the downregulated (cluster II, blue) and upregulated (cluster III, yellow) genes in panel E. G: Venn diagram representation of Baf60-regulated genes. H: qPCR analysis of myofiber type (left), lipid metabolism (middle), and glycolysis (right) gene expression in quadriceps muscles in control and ACKO mice (n = 4–5). Data in C, D, and H represent mean ± SEM. *P < 0.05, **P < 0.01, ***P < 0.001.
Figure 3
Figure 3
Conditional inactivation of Baf60s impairs exercise endurance. A: Running time until exhaustion in control (Ctrl) and conditional knockout mice; AKO (n = 4–6), CKO (n = 4–6), ACKO (n = 7–9). B: Postrunning blood glucose, lactate, and plasma insulin levels in control and ACKO mice (n = 7–9). C: Postrunning plasma NEFA, glycerol, and TAG levels in control and ACKO mice (n = 6). D: Postrunning glycogen content in tibialis anterior muscles (n = 5–6). E: Immunoblots of quadriceps muscle total protein lysates from control and ACKO mice following exercise. F: Body weight (left, n = 5–7), fasting blood glucose (middle, n = 4–8), and ad libitum plasma insulin (right, n = 7–9) levels from chow-fed control and ACKO mice. G: GTT (left, n = 7) and ITT (right, n = 7–12) in mice fed with chow diet. Data in AD, F, and G represent mean ± SEM. **P < 0.01, ***P < 0.001.
Figure 4
Figure 4
ACKO mice are protected from HFD-induced metabolic disorders. A: Body weight of AKO (left, n = 9–10) and CKO (right, n = 9–17) mice and their respective controls (Ctrl) before and after 16 weeks of HFD feeding. B: Body weight curve of control and ACKO mice (n = 10–14) fed with HFD for 16 weeks. C: Tissue weight of control and ACKO mice (n = 10–14) fed with HFD for 16 weeks. D and E: Fasting blood glucose (D) and plasma insulin (E) concentrations in mice fed with HFD for 12 weeks (n = 10–14). F: GTT (left) and ITT (right) in mice fed with HFD for 20 weeks (n = 6). G: Immunoblots of total protein lysates from HFD-fed mice injected with saline or insulin (Ins, 1 unit kg−1) for 10 min. H: H&E staining of tissue sections. Scale bars, 200 μm. I: Liver TAG content in HFD-fed mice (n = 7–9). Data represent mean ± SEM. AUC, area under the curve; Quad, quadriceps muscle. *P < 0.05, **P < 0.01, ***P < 0.001.
Figure 5
Figure 5
ACKO mice exhibit an improved metabolic profile during aging. A: Body weight, ad libitum blood glucose, and plasma insulin levels in young mice (n = 4–5) or old mice (n = 6–7) fed with standard chow diet. B: Plasma lipid levels in young and old mice fed a standard chow diet. C: GTT and ITT assays in old control and ACKO mice (n = 6–9). D: Liver TAG content in old mice following overnight starvation (n = 6–9). Data represent mean ± SEM. AUC, area under the curve. *P < 0.05, **P < 0.01, ***P < 0.001.
Figure 6
Figure 6
Conditional inactivation of Baf60a and Baf60c in skeletal muscle increases metabolic rate in ACKO mice. A and B: Oxygen consumption rate (VO2) (A) and energy expenditure (EE) (B) in control (Ctrl) and ACKO mice fed with HFD for 1 week (n = 8). C: qPCR analysis of BAT gene expression in mice fed with standard chow (left, n = 4–5) or HFD for 12 weeks (right, n = 5–11). D: Immunoblots of BAT total protein lysates from mice as described in C. E: qPCR analysis of quadriceps gene expression in HFD-fed mice (n = 6–7). F: qPCR analysis of quadriceps gene expression in chow-fed old mice (n = 6–7). G: Immunoblots of total muscle protein lysates from the HFD-fed (left) and aging (right) cohorts. H: Left, lactate production in ex vivo cultured EDL muscle treated with vehicle (Veh) or dantrolene (DAN) (100 μmol/L) for 3 h. Right, DAN-inhibitable lactate production rate calculated from data on the left. Data in AC, E, F, and H represent mean ± SEM. *P < 0.05, **P < 0.01, ***P < 0.001.
Figure 7
Figure 7
Baf60 deficiency enhances the expression and secretion of IGF2. A: Heat map representation of Baf60-regulated genes encoding secreted factors. B: qPCR analysis of gene expression in quadriceps muscle from AKO (n = 3), CKO (n = 6), ACKO (n = 4–5) mice and their littermate controls (Ctrl) on standard chow diet. C: IGF2 secretion in ex vivo cultured soleus (left) or plantaris (right) muscles. D: Plasma IGF2 concentration in chow-fed control and ACKO mice (n = 4–5). E: qPCR analysis of quadriceps gene expression in HFD-fed mice (left, n = 5–11) and plasma IGF2 concentrations in HFD-fed mice (right, n = 7–9). F: qPCR analysis of quadriceps gene expression (left) and plasma IGF2 levels (right) in old control and ACKO mice (n = 6–7). G: ChIP assays on control and ACKO muscle nuclei using antibodies against histone 3 acetylation (AcH3) and H3K9 demethylation (H3K9me2). Location of primers on the proximal regions of three IGF2 promoters is shown. H: Schematic model demonstrating the regulation of exercise preformation and systemic energy homeostasis by Baf60a and Baf60c. Data in BG represent mean ± SEM. *P < 0.05, **P < 0.01, ***P < 0.001.

References

    1. Schiaffino S. Fibre types in skeletal muscle: a personal account. Acta Physiol (Oxf) 2010;199:451–463 - PubMed
    1. Bassel-Duby R, Olson EN. Signaling pathways in skeletal muscle remodeling. Annu Rev Biochem 2006;75:19–37 - PubMed
    1. Berchtold MW, Brinkmeier H, Müntener M. Calcium ion in skeletal muscle: its crucial role for muscle function, plasticity, and disease. Physiol Rev 2000;80:1215–1265 - PubMed
    1. Kupr B, Schnyder S, Handschin C. Role of nuclear receptors in exercise-induced muscle adaptations. Cold Spring Harb Perspect Med 2017;7:a029835. - PMC - PubMed
    1. Egan B, Zierath JR. Exercise metabolism and the molecular regulation of skeletal muscle adaptation. Cell Metab 2013;17:162–184 - PubMed

Publication types

MeSH terms