

A Galaxy Implementation of Next-Generation Clustered Heatmaps for Interactive Exploration of Molecular Profiling Data
- PMID: 29092932
- PMCID: PMC5715806
- DOI: 10.1158/0008-5472.CAN-17-0318
A Galaxy Implementation of Next-Generation Clustered Heatmaps for Interactive Exploration of Molecular Profiling Data
Abstract
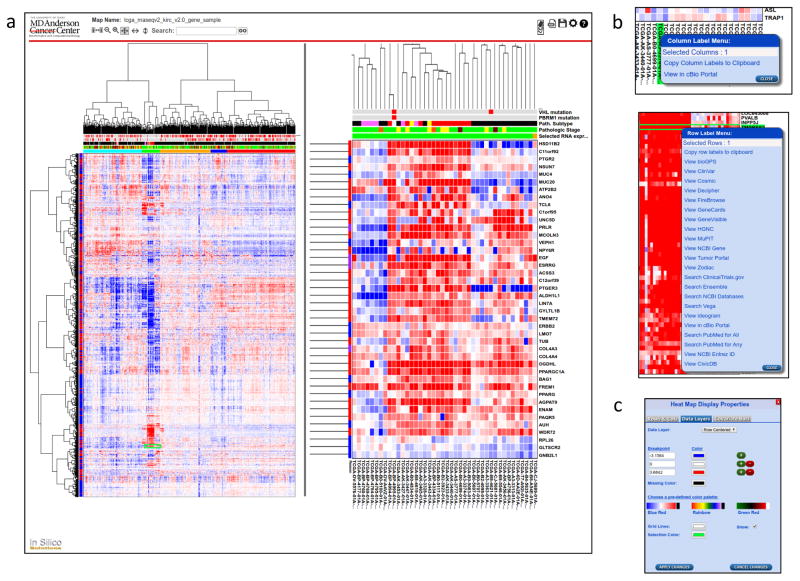
Clustered heatmaps are the most frequently used graphics for visualization of molecular profiling data in biology. However, they are generally rendered as static, or only modestly interactive, images. We have now used recent advances in web technologies to produce interactive "next-generation" clustered heatmaps (NG-CHM) that enable extreme zooming and navigation without loss of resolution. NG-CHMs also provide link-outs to additional information sources and include other features that facilitate deep exploration of the biology behind the image. Here, we describe an implementation of the NG-CHM system in the Galaxy bioinformatics platform. We illustrate the algorithm and available computational tool using RNA-seq data from The Cancer Genome Atlas program's Kidney Clear Cell Carcinoma project. Cancer Res; 77(21); e23-26. ©2017 AACR.
©2017 American Association for Cancer Research.
Figures
References
-
- Weinstein JN, Myers T, Buolamwini J, Raghavan K, van Osdol W, Licht J, et al. Predictive statistics and artificial intelligence in the U.S. National Cancer Institute’s Drug Discovery Program for Cancer and AIDS. Stem Cells. 1994;12:13–22. - PubMed
-
- Weinstein JN, Myers TG, O’Connor PM, Friend SH, Fornace AJ, Jr, Kohn KW, et al. An information-intensive approach to the molecular pharmacology of cancer. Science. 1997;275:343–9. - PubMed
-
- Myers TG, Anderson NL, Waltham M, Li G, Buolamwini JK, Scudiero DA, et al. A protein expression database for the molecular pharmacology of cancer. Electrophoresis. 1997;18:647–53. - PubMed
-
- Ross DT, Scherf U, Eisen MB, Perou CM, Rees C, Spellman P, et al. Systematic variation in gene expression patterns in human cancer cell lines. Nature Genetics. 2000;24:227–35. - PubMed
Publication types
MeSH terms
Substances
Grants and funding
LinkOut - more resources
Full Text Sources
Other Literature Sources
