. 2017 Nov 1;77(21):e111-e114.
doi: 10.1158/0008-5472.CAN-17-0580.

TumorMap: Exploring the Molecular Similarities of Cancer Samples in an Interactive Portal

Affiliations

TumorMap: Exploring the Molecular Similarities of Cancer Samples in an Interactive Portal

Yulia Newton et al. Cancer Res. .

Abstract

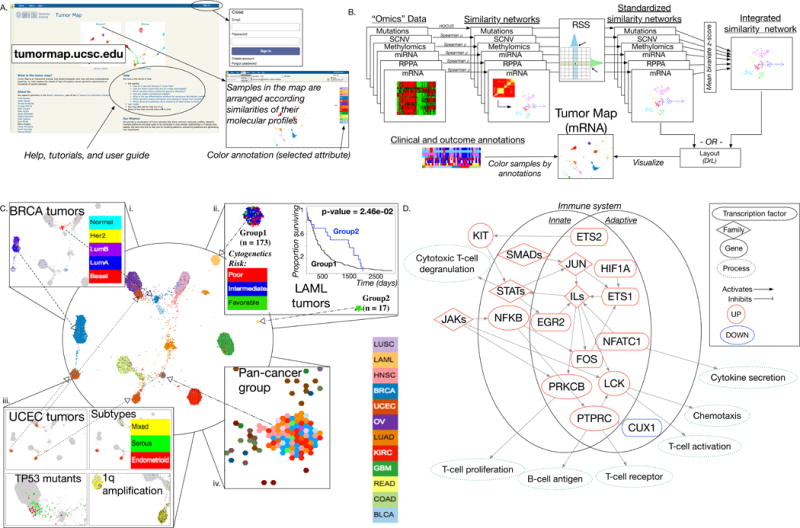
Vast amounts of molecular data are being collected on tumor samples, which provide unique opportunities for discovering trends within and between cancer subtypes. Such cross-cancer analyses require computational methods that enable intuitive and interactive browsing of thousands of samples based on their molecular similarity. We created a portal called TumorMap to assist in exploration and statistical interrogation of high-dimensional complex "omics" data in an interactive and easily interpretable way. In the TumorMap, samples are arranged on a hexagonal grid based on their similarity to one another in the original genomic space and are rendered with Google's Map technology. While the important feature of this public portal is the ability for the users to build maps from their own data, we pre-built genomic maps from several previously published projects. We demonstrate the utility of this portal by presenting results obtained from The Cancer Genome Atlas project data. Cancer Res; 77(21); e111-4. ©2017 AACR.


Conflict of interest statement

Disclosure of Potential Conflicts of Interest

A.M. Novak is a consultant at DNAnexus. No potential conflicts of interest were disclosed by the other authors.

Figures

Figure 1
Figure 1
TumorMap framework and application to the analysis of the TCGA Pan-Cancer-12 Dataset. A, The TumorMap is a publicly available web portal. B, Outline of the TumorMap construction workflow. Data from individual molecular platforms (“Omics” Data) are provided as input from which pairwise similarities between samples are calculated to produce “Similarity networks”; these networks are standardized using the Reciprocal Significance of Similarities (RSS; see Supplementary Methods) to create a coherent space of standardized similarity networks. Map layouts are created with the OpenOrd algorithm using coherent sample networks. Integrated multiplatform maps are created from several coherent networks, combined before input to OpenOrd layout procedure. Shown is an mRNA-based gene expression map; colors represent tissue of origin. Attributes such as clinical, molecular, phenotype, or outcome metadata, annotate samples using colors and color gradients based on groupings that can be defined by the user. C, TumorMap rendering of the Pan-Cancer-12 Dataset, an integrated cross-cancer TumorMap based on six molecular data platforms. Several previously reported groups of interest are shown including: (i) BRCA tumors cluster into two major groups, with basal samples grouping with squamous tumors; (ii) LAML tumors separate into two major groups, with one group significantly enriched for favorable cytogenetic risk; (iii) separation of endometrioid UCEC tumors into two major groups, one of which is characterized by a 1q chromosome amplification event. A novel group was also detected; (iv) an integrated pan-cancer cluster, defined by tumors from nine different tissues of origin, exhibits a strong immune signature. D, Pathway diagram of immune signaling-related genes with higher inferred activity among samples belonging to the integrated pan-cancer cluster (shown in C) compared with samples outside of it; networks include genes from both the innate and adaptive immune systems.

References

    1. Nielsen CB, Cantor M, Dubchak I, Gordon D, Wang T. Visualizing genomes: techniques and challenges. Nat Methods. 2010;7:S5–15. - PubMed
    1. Kim SK. A gene expression map for Caenorhabditis elegans. Science. 2001;293:2087–92. - PubMed
    1. MacArthur BD, Lachmann A, Lemischka IR, Ma’ayan A. GATE: software for the analysis and visualization of high-dimensional time series expression data. Bioinformatics. 2010;26:143–4. - PMC - PubMed
    1. Bolouri H, Zhao LP, Holland EC. Big data visualization identifies the multidimensional molecular landscape of human gliomas. Proc Natl Acad Sci U S A. 2016;113:5394–9. - PMC - PubMed
    1. Lee S-I. A generalized significance testing method for global measures of spatial association: an extension of the Mantel test. Environ Plan A. 2004;36:1687–703.

Publication types