. 2017 Dec 15;130(24):4155-4167.
doi: 10.1242/jcs.211102. Epub 2017 Nov 1.

CREB3L1-mediated functional and structural adaptation of the secretory pathway in hormone-stimulated thyroid cells

Affiliations

CREB3L1-mediated functional and structural adaptation of the secretory pathway in hormone-stimulated thyroid cells

Iris A García et al. J Cell Sci. .

Abstract

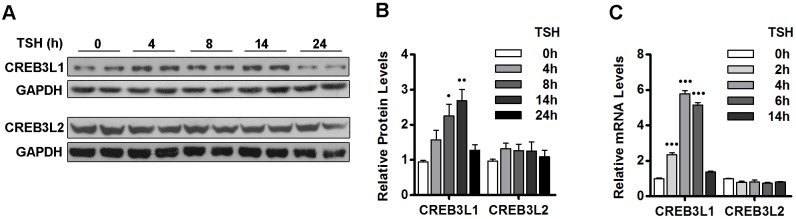
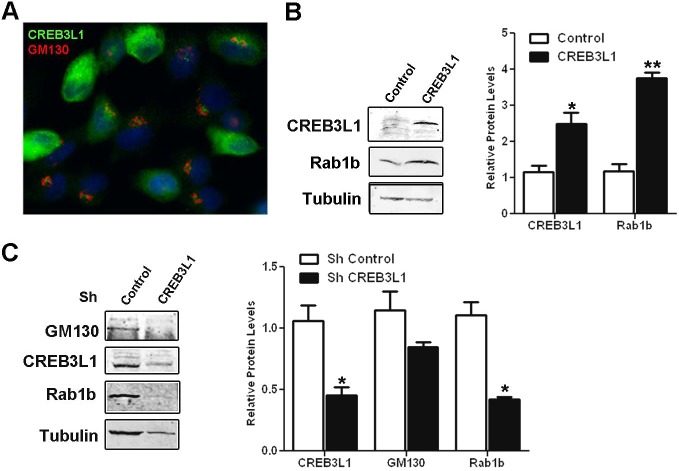
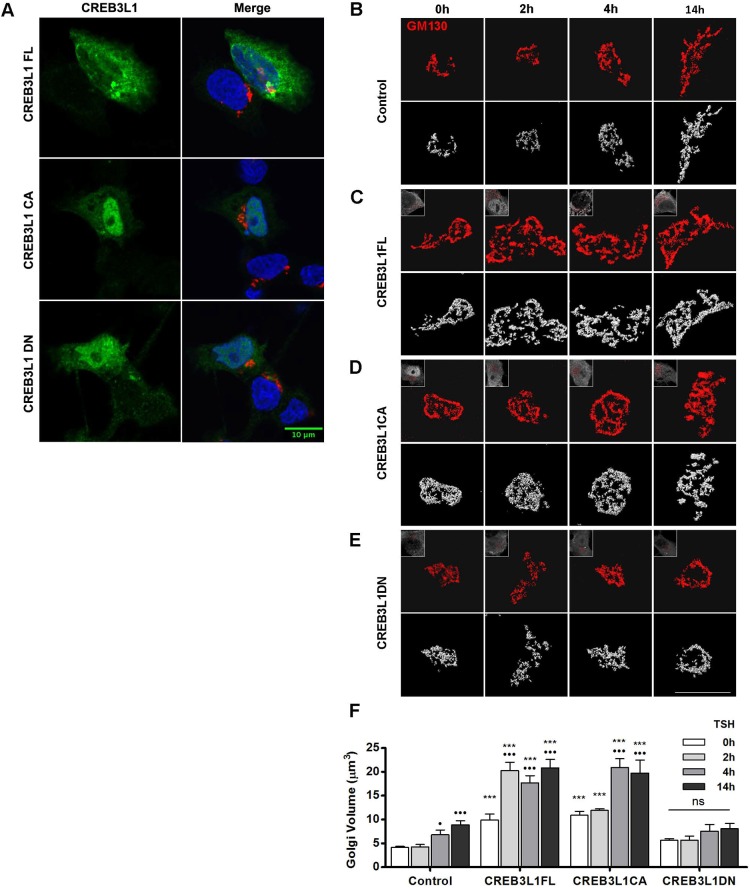
Many secretory cells increase the synthesis and secretion of cargo proteins in response to specific stimuli. How cells couple increased cargo load with a coordinate rise in secretory capacity to ensure efficient transport is not well understood. We used thyroid cells stimulated with thyrotropin (TSH) to demonstrate a coordinate increase in the production of thyroid-specific cargo proteins and ER-Golgi transport factors, and a parallel expansion of the Golgi complex. TSH also increased expression of the CREB3L1 transcription factor, which alone caused amplified transport factor levels and Golgi enlargement. Furthermore, CREB3L1 potentiated the TSH-induced increase in Golgi volume. A dominant-negative CREB3L1 construct hampered the ability of TSH to induce Golgi expansion, implying that this transcription factor contributes to Golgi expansion. Our findings support a model in which CREB3L1 acts as a downstream effector of TSH to regulate the expression of cargo proteins, and simultaneously increases the synthesis of transport factors and the expansion of the Golgi to synchronize the rise in cargo load with the amplified capacity of the secretory pathway.

Keywords: CREB3L1; FRTL-5; Golgi; Membrane traffic; Secretory pathway; TSH.


Conflict of interest statement

Competing interestsThe authors declare no competing or financial interests.

Figures

Fig. 1.
Fig. 1.
Transport factors are upregulated in response to TSH stimulation. (A) Immunofluorescence staining of the indicated transport factors performed on FRTL-5 cells grown under basal (−TSH) conditions or cells treated with TSH (+TSH, 1 mIU/ml, 24 h). NIS was used as positive control for induction. Images are representative of three independent experiments. Scale bar: 10 μm. (B) Western blot analysis of lysates from FRTL-5 cells incubated under basal (−TSH) or stimulated (+TSH, 1 mlU/ml, 24 h) conditions. NIS and GAPDH were used as controls for TSH induction and loading, respectively. (C) Densitometric quantification of proteins shown in B normalized to GAPDH. Values represent fold change relative to protein levels under basal conditions (see Materials and Methods). Bar graph represents mean±s.e.m. of at least three independent experiments (P<0.05; ••P<0.01). (D) Quantification of transport factors mRNA by qRT-PCR from total RNA obtained from FRTL-5 cells grown under basal (−TSH) or stimulated (+TSH, 1 mlU/ml, 14 h) conditions. NIS was used as positive control of TSH induction. Results were normalized to the levels of β-actin and expressed according to the 2−ΔΔCt method relative to the expression level in basal conditions (set as 1). Results are mean±s.e.m. of at least three independent experiments performed in triplicate (•••P<0.001).
Fig. 2.
Fig. 2.
Cargo proteins and transport factors display similar kinetics of expression in response to TSH stimulation. (A) Western blot of lysates from FRTL-5 cells stimulated with TSH (1 mIU/ml) for the indicated times. NIS was used as positive control for TSH induction, and GAPDH as a loading control. (B) Densitometric quantification of proteins in A normalized to GAPDH. Values represent fold change relative to protein levels at 0 h (see Materials and Methods). Results are mean±s.e.m. of at least three independent experiments. nd, not detectable (P<0.05; ••P<0.01; •••P<0.001). (C) Quantification of mRNA levels by qRT-PCR with total RNA obtained from FRTL-5 cells stimulated with TSH (1 mIU/ml) for the indicated times. Results were normalized to β-actin and expressed according to the 2−ΔΔCt method relative to the expression level at 0 h (set as 1). Results are mean±s.e.m. of three independent experiments performed in triplicate (P<0.05; ••P<0.01; •••P<0.001).
Fig. 3.
Fig. 3.
TSH stimulation leads to increased Golgi size and volume. (A,C) Deconvolved images obtained from immunofluorescence analysis performed on FRTL-5 cells with antibodies against GM130 (A) and GalNAcT2 (C) at the indicated time points after TSH stimulation. (B,D) Three-dimensional reconstruction of the images shown in A and C, respectively. Scale bar: 10 μm. (E,F) Quantification of Golgi volume normalized to cell size. Cell size was estimated by flow cytometry and the average size of the cell population at 0 h was set as 1. Results are mean±s.e.m. of two independent experiments with 14–17 cells analyzed per condition (•••P<0.001). (G–I) Electron micrographs of FRTL-5 cells incubated under basal (−TSH) conditions (G) or after TSH stimulation (+TSH, 1 mlU/ml) for 24 h (H,I). Images are representative of two independent experiments. N, nucleus; M, mitochondria; G, Golgi. Scale bars: 300 nm. (J) Quantification of number of cisternae within a single stack and stack length for each condition (−TSH or +TSH, 30 stacks were counted in different cells, •••P<0.001, t-test).
Fig. 4.
Fig. 4.
The cAMP-dependent signaling pathway is responsible for the increases in protein and mRNA levels of transport factors. (A) Western blot of lysates from FRTL-5 cells grown under basal conditions (−FSK/−TSH, control) or treated either with FSK (+FSK, 10 μM) or TSH (+TSH, 1 mlU/ml) for 24 h. NIS and GAPDH were used as controls for TSH induction and loading, respectively. (B) Densitometric quantification of proteins in A normalized to the levels of GAPDH. Values indicate the fold change relative to protein levels in untreated cells. Results are mean±s.e.m. of three independent experiments (P<0.05; ••P<0.01; •••P<0.001). (C) The CREB3L1 consensus motif identified upstream of 36 genes selected as described in the Results (listed in Table 1) as determined by Pscan.
Fig. 5.
Fig. 5.
TSH stimulates CREB3L1 expression. (A) Western blot with antibodies against the N-terminal region of CREB3L1 or CREB3L2 in lysates from FRTL-5 cells stimulated with TSH (1 mIU/ml) for the indicated times. GAPDH was used as the loading control. (B) Densitometric quantification of proteins in A normalized to the levels of GAPDH. Values are the fold change relative to levels in cells at 0 h. Results are mean±s.e.m. of three independent experiments (P<0.05; ••P<0.01). (C) Quantification of CREB3L1 and CREB3L2 mRNA levels by qRT-PCR performed with total RNA from FRTL-5 cells stimulated with TSH (1 mlU/ml) for the indicated times. Results are normalized to the levels of β-actin, expressed according to the 2−ΔΔCt method relative to levels at 0 h (set as 1) and are shown as mean±s.e.m. of three independent experiments performed in triplicate (•••P<0.001).
Fig. 6.
Fig. 6.
CREB3L1 regulates Rab1b and GM130 expression. (A) Immunofluorescence analysis with antibodies against CREB3L1 (green) and GM130 (red) of FRTL-5 cells co-transfected with CREB3L1 and the puromycin-resistance conferring pLKO.1 plasmid after selection with puromycin. Nuclei are labeled with Hoechst 33258. (B) Left, western blot of lysates from puromycin-resistant FRTL-5 cells transfected with only pLKO.1 (Control) or co-transfected with pLKO.1 and CREB3L1FL. Tubulin was used as a loading control. Right: densitometric quantification of proteins normalized to the levels of tubulin. (C) Left: western blot of lysates from FRTL-5 cells overexpressing CREB3L1 (cells shown in A) that were transfected with an shRNA containing either a control cassette (control) or CREB3L1-silencing cassette (CREB3L1). Tubulin was used as loading control. Right: densitometric quantification of proteins normalized to the levels of tubulin. Results are mean±s.e.m. of three independent experiments (*P<0.05; **P<0.01).
Fig. 7.
Fig. 7.
CREB3L1 induces Golgi expansion and potentiates the TSH-mediated Golgi amplification. (A) Immunofluorescence of FRTL-5 cells transfected with the indicated CREB3L1 construct labeled with antibodies against CREB3L1 (green) and GM130 (red). Nuclei are labeled with Hoechst 33258. FRTL-5 cells were either mock transfected (B; control), or transfected with a full-length CREB3L1 (C; CREB3L1FL), a constitutively active CREB3L1 construct (D; CREB3L1CA), or a dominant-negative CREB3L1 construct (E; CREB3L1DN). After 36 h, cells were stimulated with TSH (1 mIU/ml) for the indicated times and then processed for immunofluorescence analysis with antibodies against CREB3L1 (to identify the transfected cells) and GM130 (to visualize the Golgi). Upper panels, deconvolved images; lower panels, three-dimensional reconstructions of deconvolved images; inset, CREB3L1 expression. Scale bars: 10 μm. (F) Golgi volumes were quantified for each condition at each time point. Results are mean±s.e.m. (P<0.05; •••P<0.001 versus value at time 0 h for each experimental condition; *P<0.05; ***P<0.001 versus control condition at the same time point); ns, not significant. Spatial deconvolution, three-dimensional reconstruction and quantification were performed by using Huygens Essential Software.

Similar articles

Cited by

References

    1. Abrams E. W. and Andrew D. J. (2005). CrebA regulates secretory activity in the Drosophila salivary gland and epidermis. Development 132, 2743-2758. 10.1242/dev.01863 - DOI - PubMed
    1. Alvarez C., Garcia-Mata R., Brandon E. and Sztul E. (2003). COPI recruitment is modulated by a Rab1b-dependent mechanism. Mol. Biol. Cell 14, 2116-2127. 10.1091/mbc.E02-09-0625 - DOI - PMC - PubMed
    1. Bailey D. and O'Hare P. (2007). Transmembrane bZIP transcription factors in ER stress signaling and the unfolded protein response. Antioxid Redox Signal. 9, 2305-2321. 10.1089/ars.2007.1796 - DOI - PubMed
    1. Barbosa S., Fasanella G., Carreira S., Llarena M., Fox R., Barreca C., Andrew D. and O'Hare P. (2013). An orchestrated program regulating secretory pathway genes and cargos by the transmembrane transcription factor CREB-H. Traffic 14, 382-398. 10.1111/tra.12038 - DOI - PMC - PubMed
    1. Bonfanti L., Mironov A. A. Jr, Martínez-Menárguez J. A., Martella O., Fusella A., Baldassarre M., Buccione R., Geuze H. J., Mironov A. A. and Luini A. (1998). Procollagen traverses the Golgi stack without leaving the lumen of cisternae: evidence for cisternal maturation. Cell 95, 993-1003. 10.1016/S0092-8674(00)81723-7 - DOI - PubMed

MeSH terms

Substances

LinkOut - more resources