Meta-Analysis
. 2018 Jan;29(1):335-348.
doi: 10.1681/ASN.2017030267. Epub 2017 Nov 1.

Genome-Wide Meta-Analysis Unravels Interactions between Magnesium Homeostasis and Metabolic Phenotypes

Affiliations
Meta-Analysis

Genome-Wide Meta-Analysis Unravels Interactions between Magnesium Homeostasis and Metabolic Phenotypes

Tanguy Corre et al. J Am Soc Nephrol. 2018 Jan.

Abstract

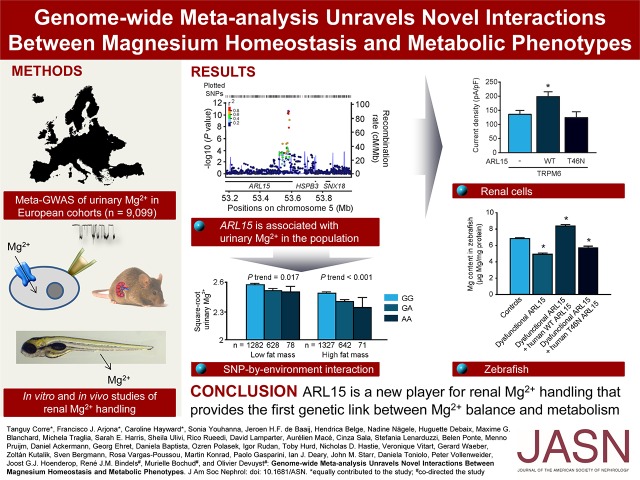
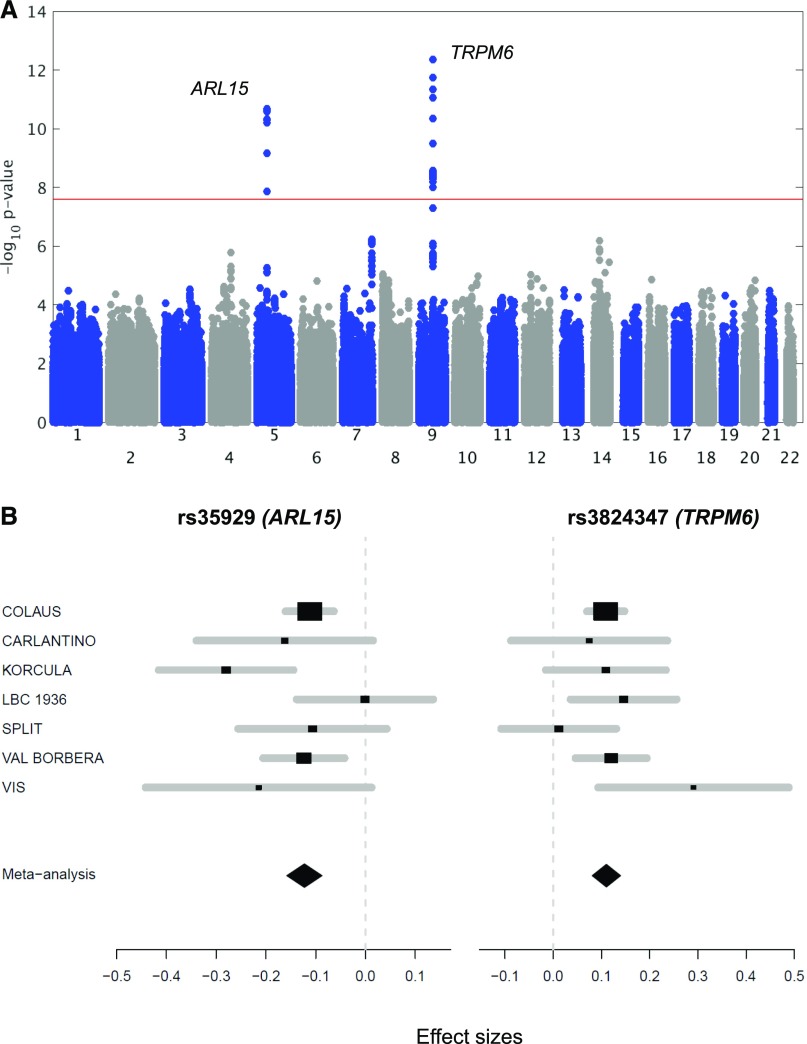
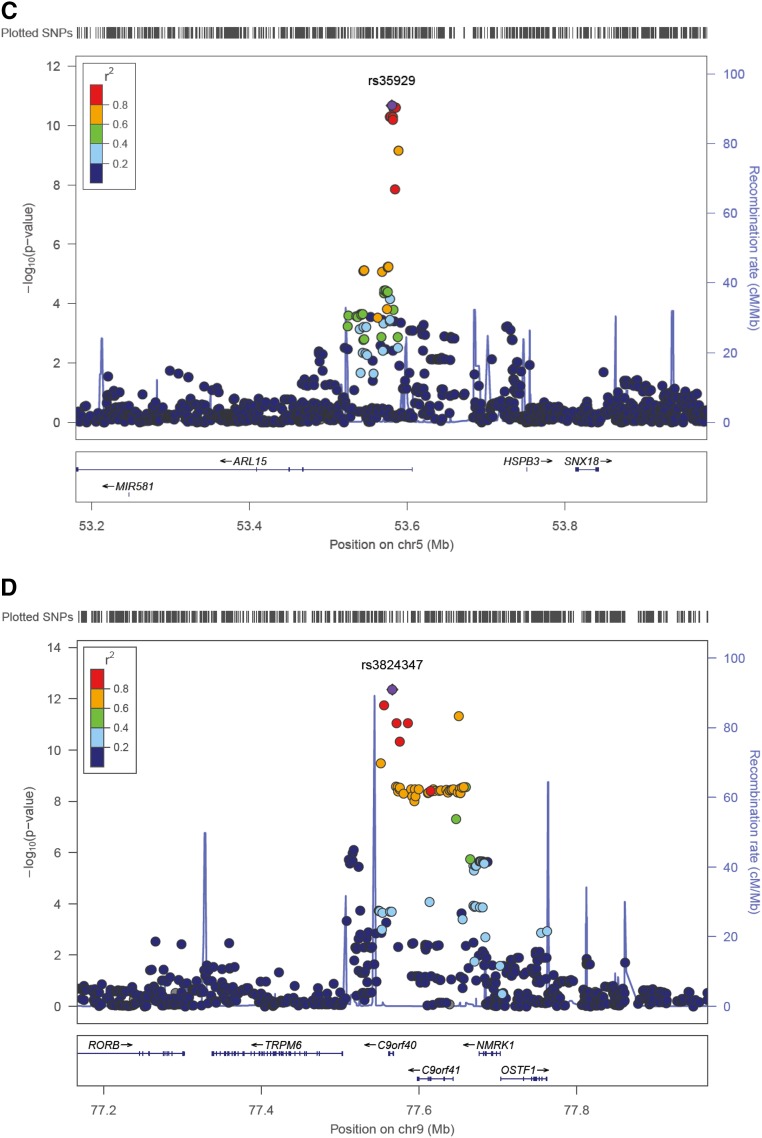
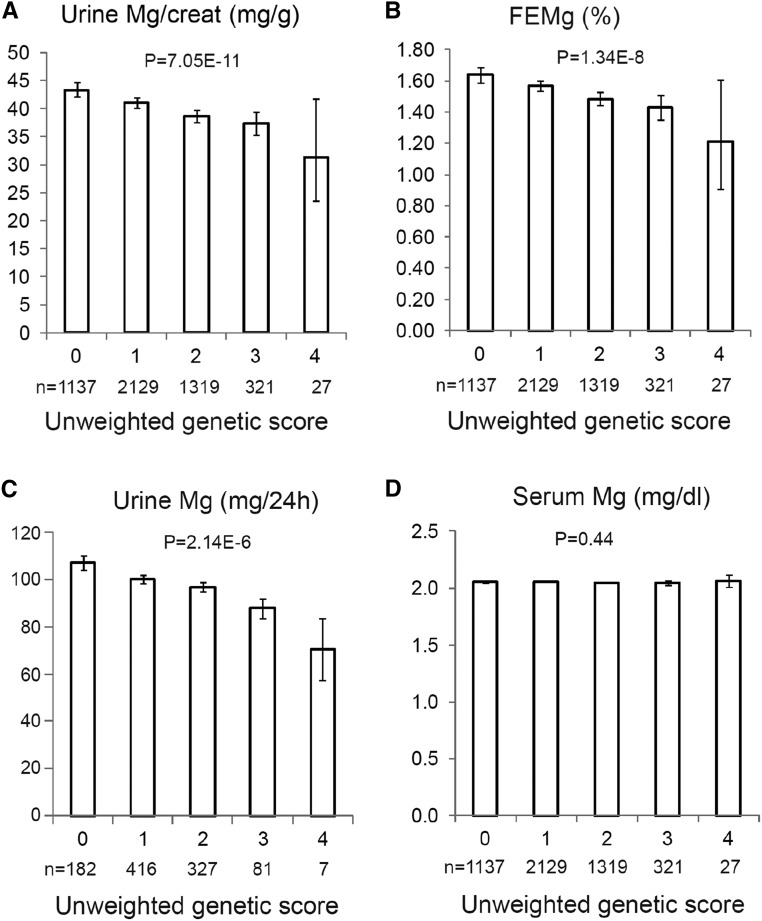
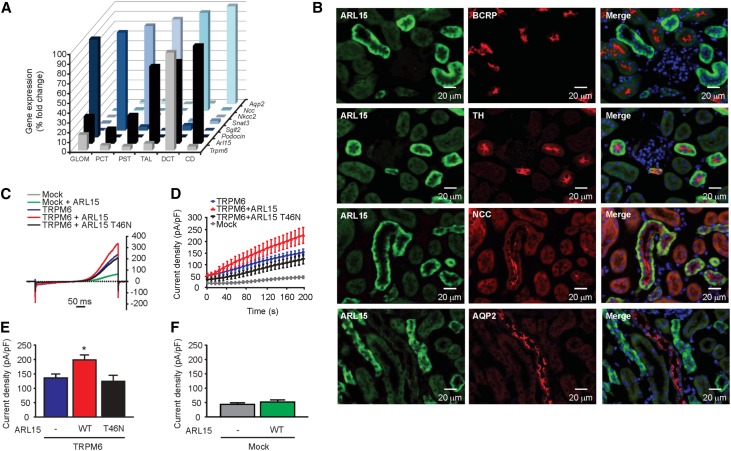
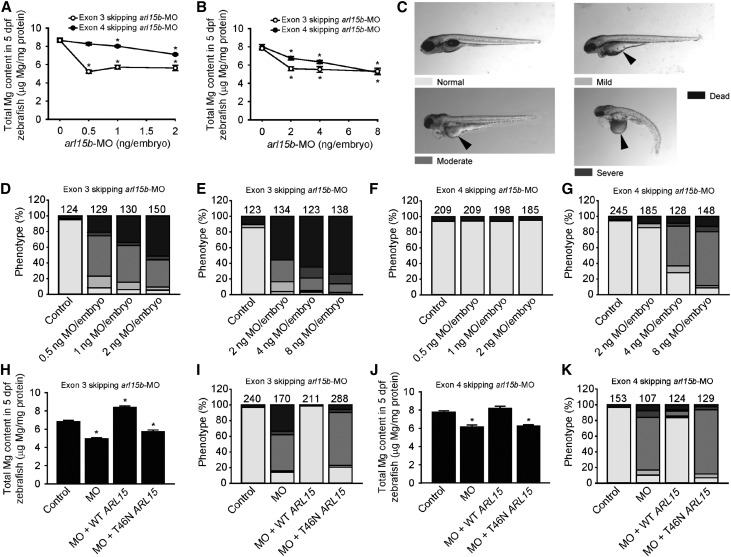
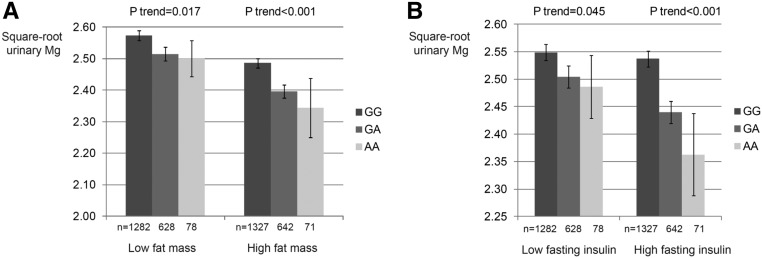
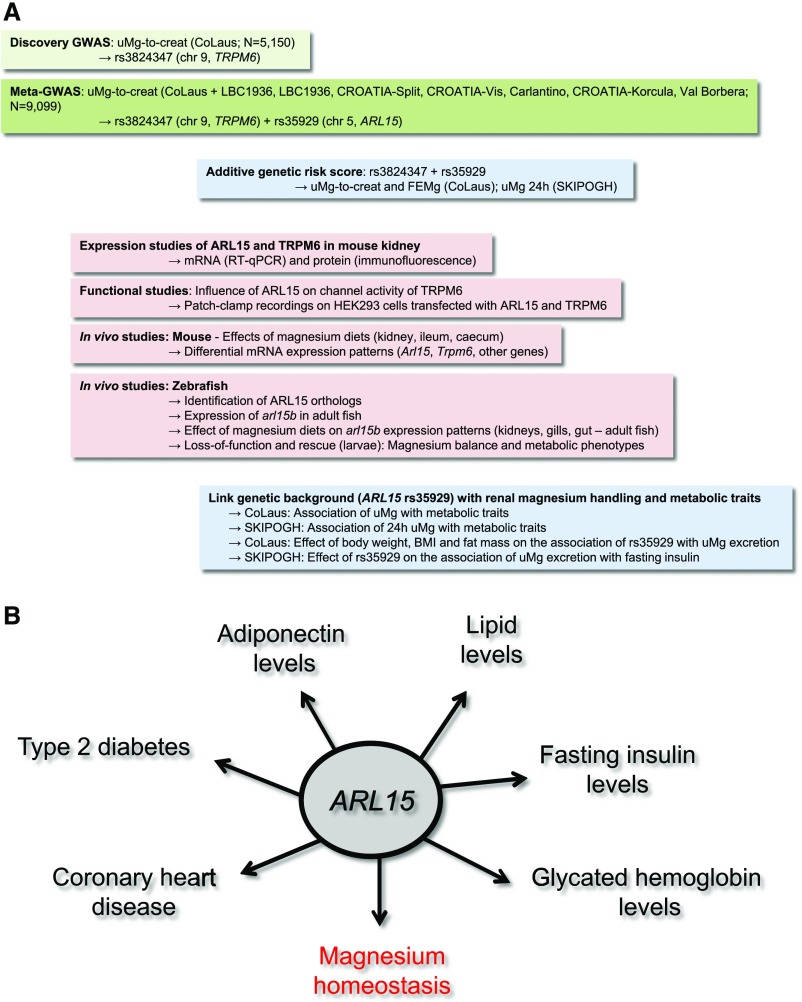
Magnesium (Mg2+) homeostasis is critical for metabolism. However, the genetic determinants of the renal handling of Mg2+, which is crucial for Mg2+ homeostasis, and the potential influence on metabolic traits in the general population are unknown. We obtained plasma and urine parameters from 9099 individuals from seven cohorts, and conducted a genome-wide meta-analysis of Mg2+ homeostasis. We identified two loci associated with urinary magnesium (uMg), rs3824347 (P=4.4×10⁻¹³) near TRPM6, which encodes an epithelial Mg2+ channel, and rs35929 (P=2.1×10⁻¹¹), a variant of ARL15, which encodes a GTP-binding protein. Together, these loci account for 2.3% of the variation in 24-hour uMg excretion. In human kidney cells, ARL15 regulated TRPM6-mediated currents. In zebrafish, dietary Mg2+ regulated the expression of the highly conserved ARL15 ortholog arl15b, and arl15b knockdown resulted in renal Mg2+ wasting and metabolic disturbances. Finally, ARL15 rs35929 modified the association of uMg with fasting insulin and fat mass in a general population. In conclusion, this combined observational and experimental approach uncovered a gene-environment interaction linking Mg2+ deficiency to insulin resistance and obesity.

Keywords: Gene-environment interaction; Genetic determinants; Magnesium homeostasis; Metabolic syndrome; Tubular transport; zebrafish.


Figures

None
Graphical abstract
Figure 1.
Figure 1.
A genome-wide meta-analysis for urinary Mg2+-to-creatinine ratio reveals two signals. (A) Manhattan plot showing −log10(P values) for all SNPs in the genome-wide meta-analysis for normalized urinary Mg2+-to-creatinine ratio in Europeans (n=9099), ordered by chromosomal position. The values correspond to the association of normalized urinary Mg2+-to-creatinine ratio, including age and sex as covariates in the model as well as study-specific covariates if needed. The gene closest to the SNP with the lowest P value is listed at each locus. Two loci reached genome-wide significance (P<5×10⁻⁸), indicated by the red horizontal line, at combined analysis (TRPM6, rs3824347 and ARL15, rs35929). (B) Forest plot for rs35929 (ARL15) and rs3824347 (TRPM6) showing effect sizes and 95% confidence intervals across studies as well as the summary meta-analysis results. (C) Regional association plot at the rs3824347 (TRPM6) locus. Regional association plot showing −log10 (P values) for the association of SNPs at the locus of interest ordered by their chromosomal position with normalized urinary Mg2+-to-creatinine ratio. The -log10 (P value) for each SNP is colored according to the correlation of the corresponding SNP, with the SNP showing the lowest P value (index SNP) within the locus using different colors for selected levels of LD (chi-squared). Correlation structures correspond to HapMap 2 CEU. The blue line represents the recombination according to the scale shown on the right-side y-axis. (D) Regional association plot at the rs35929 (ARL15) locus.
Figure 1.
Figure 1.
A genome-wide meta-analysis for urinary Mg2+-to-creatinine ratio reveals two signals. (A) Manhattan plot showing −log10(P values) for all SNPs in the genome-wide meta-analysis for normalized urinary Mg2+-to-creatinine ratio in Europeans (n=9099), ordered by chromosomal position. The values correspond to the association of normalized urinary Mg2+-to-creatinine ratio, including age and sex as covariates in the model as well as study-specific covariates if needed. The gene closest to the SNP with the lowest P value is listed at each locus. Two loci reached genome-wide significance (P<5×10⁻⁸), indicated by the red horizontal line, at combined analysis (TRPM6, rs3824347 and ARL15, rs35929). (B) Forest plot for rs35929 (ARL15) and rs3824347 (TRPM6) showing effect sizes and 95% confidence intervals across studies as well as the summary meta-analysis results. (C) Regional association plot at the rs3824347 (TRPM6) locus. Regional association plot showing −log10 (P values) for the association of SNPs at the locus of interest ordered by their chromosomal position with normalized urinary Mg2+-to-creatinine ratio. The -log10 (P value) for each SNP is colored according to the correlation of the corresponding SNP, with the SNP showing the lowest P value (index SNP) within the locus using different colors for selected levels of LD (chi-squared). Correlation structures correspond to HapMap 2 CEU. The blue line represents the recombination according to the scale shown on the right-side y-axis. (D) Regional association plot at the rs35929 (ARL15) locus.
Figure 2.
Figure 2.
A genetic score including rs35929 and rs3824347 associates with uMg traits. (A–D) Associations of uMg excretion and fractional excretion with an unweighted genetic risk score including rs35929 (ARL15 locus) and rs3824347 (TRPM6 locus). Data are geometric means and whiskers are 95% confidence intervals for Mg2+-related phenotypes in the CoLaus (A, B, D) and SKIPOGH (C) studies. The x-axes represent the unweighted genetic score generated from rs35929 and rs3824347, using as effect allele the one associated with lower urinary Mg2+-to-creatinine ratio, i.e., the A allele for rs35929 and the G allele for rs3824347. P values are from nonparametric trend tests across genetic score. The numbers in each genetic score category are listed in all panels. The y-axis represents urinary Mg2+-to-creatinine ratio (milligrams per gram) (A), FEMg (%) (B), uMg excretion (milligrams per 24 hour) (C), and serum Mg2+ (milligrams per deciliter) (D).
Figure 3.
Figure 3.
ARL15 localizes in renal DCT regulating TRPM6 channel activity. (A) Gene expression analyses of Trpm6, Arl15, Podocin, Sglt2, Snat3, Nkcc2, Ncc, and Aqp2 in microdissected mouse nephron segments showed coexpression of Arl15 and Trpm6 in DCT. (B) Double immunofluorescence staining of mouse kidney cortex sections for ARL15 (in green) and BCRP (red); TH (red); NCC (red); or AQP2 (red) as markers of the proximal tubule, TAL, DCT, or collecting duct, respectively. For detection, the Alexa Fluor dye was used. (C) Typical current-voltage curves obtained from transfected HEK293 cells 200 seconds after break-in. Outwardly rectifying currents are observed in response to a 500 ms voltage ramp (from −100 to +100 mV) applied 200 seconds after break-in. (D) The average time development of the current density measured at +80 mV is shown (n≥10). The mock plus ARL15 condition is not shown for clarity reasons. (E) WT ARL15 (red, WT, n=47) but not the T46N ARL15 mutant (black, T46N, n=18) increased the whole-cell current density of TRPM6. Asterisk indicates significant difference with respect to the cells transfected with TRPM6 only (blue, “-,” n=44). One-way ANOVA followed by Tukey multiple comparisons post-test; P<0.05. (F) Transfection of HEK293 cells with WT ARL15 did not evoke a significant increase in whole-cell current density when compared with mock-transfected cells (n≥10, unpaired t test).
Figure 4.
Figure 4.
ARL15 dysfunction results in renal Mg2+ wasting and metabolic disturbances. (A and B) Knockdown of arl15b by 0.5–2 (A) and 2–8 (B) ng per embryo of the two arl15b-MOs used (exon skipping 3 and 4 arl15b-MOs) resulted in a dose-dependent decrease of the total Mg2+ content of zebrafish arl15b morphants, reflecting renal Mg2+ wasting. The zero dose represents injection with control-MO (2 [A] and 8 [B] ng MO per embryo). (C) Morphologic phenotypes distinguished in zebrafish larvae (5 days postfertilization) after treatment with arl15b-MO or control-MO (25× magnification). A complete description of each phenotype is detailed in the Supplemental Material. Metabolic defects (poor metabolization of the yolk) are indicated by arrowheads. (D–G) Distribution of morphologic phenotypes in zebrafish larvae injected with 0.5–2 (D, F) and 2–8 (E, G) ng per embryo of exon skipping 3 (D, E) arl15b-MO, exon skipping 4 (F, G) arl15b-MO, or control-MO (2 [D, F] and 8 [E, G] ng MO per embryo). (H–K) Rescue of renal Mg2+ wasting (H, J) and of metabolism defects (I, K) in morphant zebrafish by coinjection of exon skipping 3 arl15b-MO (0.5 ng MO per embryo [H, I]) or exon skipping 4 arl15b-MO (8 ng MO per embryo [J, K]) with cRNA encoding human WT ARL15 (50 pg cRNA per embryo). Coinjection with cRNA encoding human T46N ARL15 mutant (50 pg cRNA per embryo) did not rescue renal Mg2+ wasting or the defects in metabolism. (D–G, I, K) Numbers on top of the bars indicate the number of animals in each experiment. (A, B, H, J) Data are presented as mean±SEM (n=10, except for [B], where n=6–10). (A, B, H, J) Asterisks indicate significant differences respect to the control condition (one-way ANOVA followed by Tukey multiple comparisons post-test; P<0.05).
Figure 5.
Figure 5.
Genotypes at rs35929 influence the link between uMg and metabolism related phenotypes. (A) Effect modification of fat mass on the association of uMg concentration with rs35929 (ARL15) genotypes. Data represent adjusted square-root-transformed uMg levels by rs35929 genotypes and fat mass strata in CoLaus. The model was adjusted for age, sex, height, lean mass, CKD-EPI, urinary creatinine (square root), serum Mg2+, serum and urinary Ca2+ (square root), and menopausal status. P interaction =0.02. Fat mass strata are cut by sex-specific medians (n=4729). (B) Effect modification of fasting insulin on the association of uMg levels with rs35929 (ARL15) genotypes. Data represent adjusted square-root-transformed uMg levels by rs35929 genotypes and fasting insulin strata in CoLaus. The model was adjusted for age, sex, height, lean mass, CKD-EPI, urinary creatinine (square root), serum Mg2+, serum and urinary Ca2+ (square root), and menopausal status. P interaction =0.01. Fasting insulin strata are cut by sex-specific medians (n=4729).
Figure 6.
Figure 6.
ARL15 was identified as a key player for metabolism and renal homeostasis. The figure shows the multistep approach (A) used to investigate the genetic determinants of the renal handling of Mg2+ and their influence on metabolic traits in the general population (B).

References

    1. Feeney KA, Hansen LL, Putker M, Olivares-Yañez C, Day J, Eades LJ, Larrondo LF, Hoyle NP, O’Neill JS, van Ooijen G: Daily magnesium fluxes regulate cellular timekeeping and energy balance. Nature 532: 375–379, 2016 - PMC - PubMed
    1. de Baaij JHF, Hoenderop JGJ, Bindels RJM: Magnesium in man: Implications for health and disease. Physiol Rev 95: 1–46, 2015 - PubMed
    1. Dong JY, Xun P, He K, Qin LQ: Magnesium intake and risk of type 2 diabetes: Meta-analysis of prospective cohort studies. Diabetes Care 34: 2116–2122, 2011 - PMC - PubMed
    1. Hruby A, Meigs JB, O’Donnell CJ, Jacques PF, McKeown NM: Higher magnesium intake reduces risk of impaired glucose and insulin metabolism and progression from prediabetes to diabetes in middle-aged americans. Diabetes Care 37: 419–427, 2014 - PMC - PubMed
    1. Lopez-Ridaura R, Willett WC, Rimm EB, Liu S, Stampfer MJ, Manson JE, Hu FB: Magnesium intake and risk of type 2 diabetes in men and women. Diabetes Care 27: 134–140, 2004 - PubMed

Publication types

MeSH terms

LinkOut - more resources