Comparative Study
. 2017 Dec 15;199(12):3943-3951.
doi: 10.4049/jimmunol.1700211. Epub 2017 Nov 1.

Lung-Infiltrating Foxp3+ Regulatory T Cells Are Quantitatively and Qualitatively Different during Eosinophilic and Neutrophilic Allergic Airway Inflammation but Essential To Control the Inflammation

Affiliations
Comparative Study

Lung-Infiltrating Foxp3+ Regulatory T Cells Are Quantitatively and Qualitatively Different during Eosinophilic and Neutrophilic Allergic Airway Inflammation but Essential To Control the Inflammation

Eunjung Jang et al. J Immunol. .

Abstract

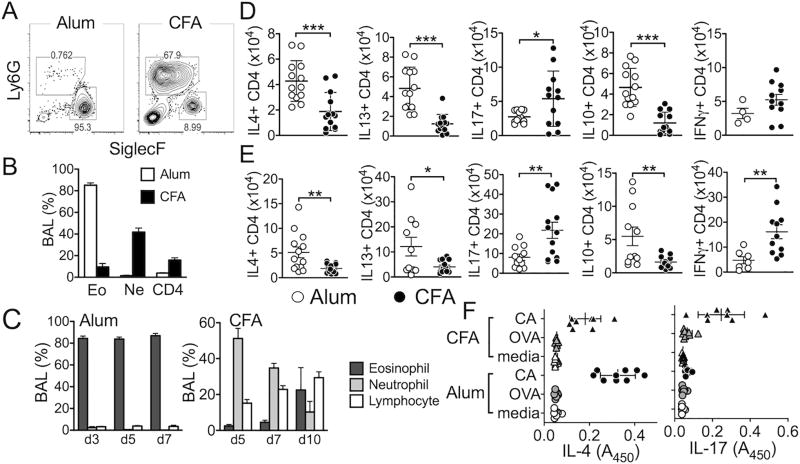
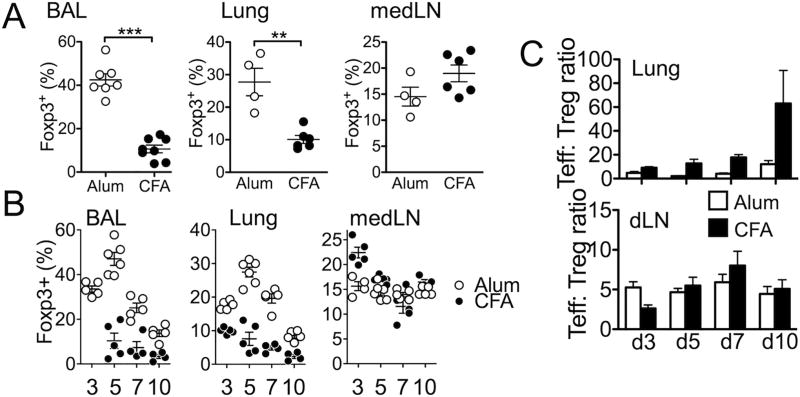
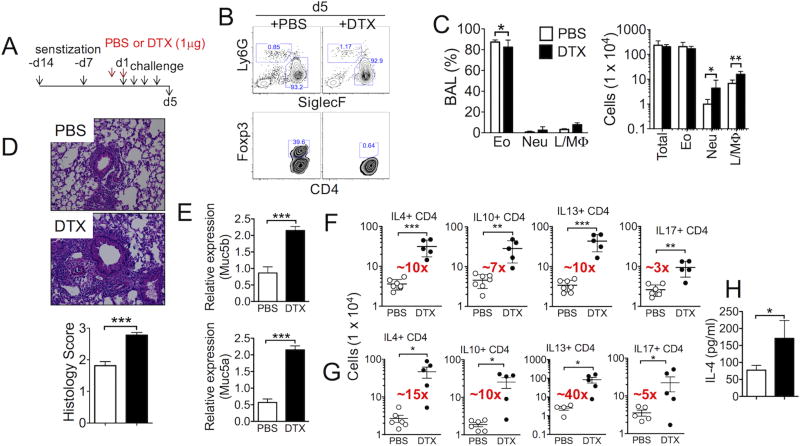
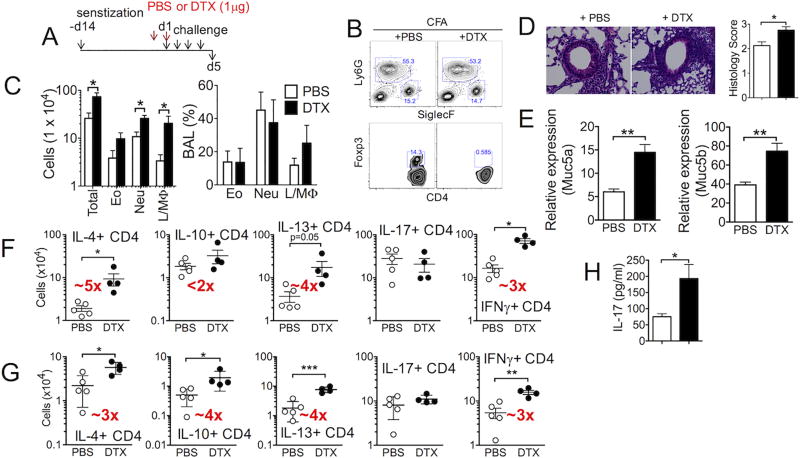
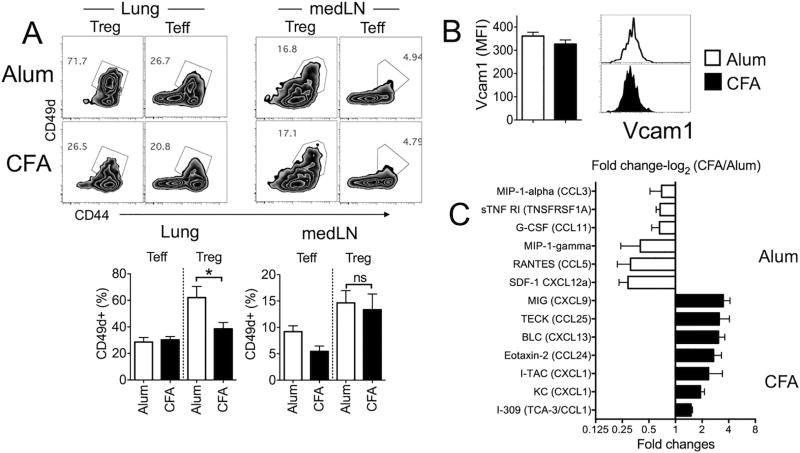
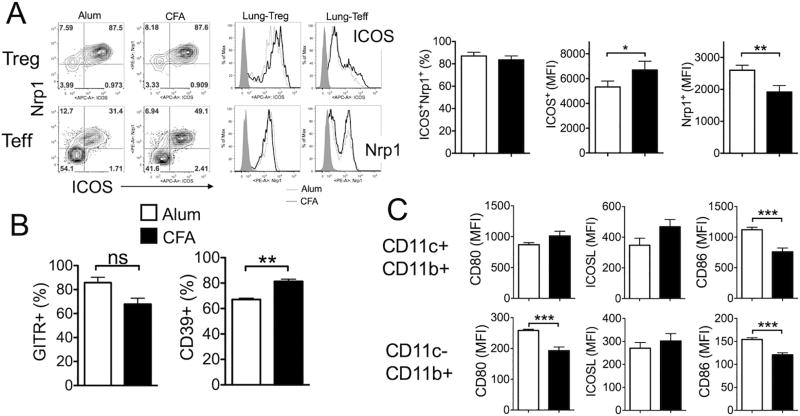
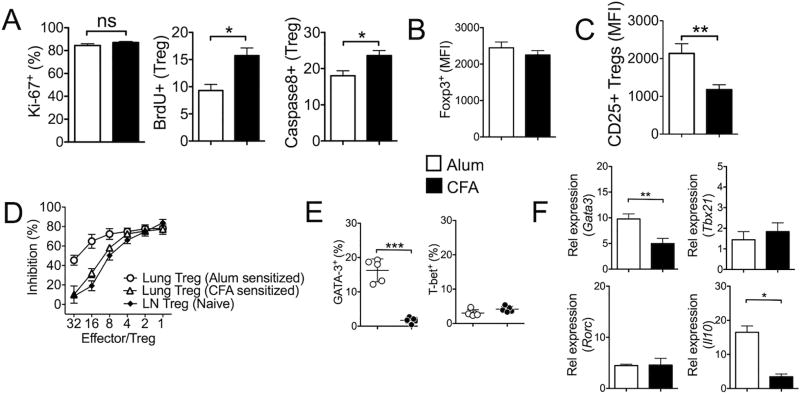
Understanding functions of Foxp3+ regulatory T cells (Tregs) during allergic airway inflammation remains incomplete. In this study, we report that, during cockroach Ag-induced allergic airway inflammation, Foxp3+ Tregs are rapidly mobilized into the inflamed lung tissues. However, the level of Treg accumulation in the lung was different depending on the type of inflammation. During eosinophilic airway inflammation, ∼30% of lung-infiltrating CD4 T cells express Foxp3, indicative of Tregs. On the contrary, only ∼10% of infiltrating CD4 T cells express Foxp3 during neutrophilic airway inflammation. Despite the different accumulation, the lung inflammation and inflammatory T cell responses were aggravated following Treg depletion, regardless of the type of inflammation, suggesting regulatory roles for Tregs. Interestingly, however, the extent to which inflammatory responses are aggravated by Treg depletion was significantly greater during eosinophilic airway inflammation. Indeed, lung-infiltrating Tregs exhibit phenotypic and functional features associated with potent suppression. Our results demonstrate that Tregs are essential regulators of inflammation, regardless of the type of inflammation, although the mechanisms used by Tregs to control inflammation may be shaped by environmental cues available to them.


Figures

Figure 1
Figure 1. The model system of eosinophilic and neutrophilic airway inflammation
B6 mice were either injected i.p. with CA/Alum or s.c. with CA/CFA as described in Supplementary Fig S1. Two weeks later mice were intranasally challenged for 4 consecutive days with CA in PBS. Mice were sacrificed 24 hours after the last challenge. (A) Cells from BAL were stained for Ly6G and Siglec F expression. (B) Differential cell count of BAL cells was performed using FACS. (C) Mice were sacrificed at different time points as shown in Supplementary Fig S1. BAL cells were then stained for eosinophils, neutrophils, and CD4 T cells. (D and E) Draining mediastinal LN (D) and Lung (E) cells were collected and ex vivo stimulated to measure intracellular cytokine expression. (F) Draining LN cells were ex vivo stimulated with CA or OVA protein for 3 days. Cytokine secretion was determined by ELISA. Each symbol represents individually tested mice. The data shown are the mean ± s.d. of three independent experiments. *, p<0.05; **, p<0.01; ***, p<0.001.
Figure 2
Figure 2. Foxp3+ Treg cell accumulation during eosinophilic and neutrophlic airway inflammation
Foxp3.GFP mice were induced for eosinophilic and neutrophilic inflammation as described in Figure 1. (A) After 24 hours of the last antigen challenge mice were sacrificed. Foxp3 expression of the total CD4 T cells in the indicated tissues was determined by flow analysis. (B) Mice were sacrificed at different time points. Indicated tissues were collected and examined for Foxp3 expression by flow analysis. (C) The ratio of Foxp3− and Foxp3+ cells was calculated from the indicated tissues. The data shown represent the mean ± s.d. of two independent experiments. Each symbol represents individually tested mouse. *, p<0.05; **, p<0.01; ***, p<0.001.
Figure 3
Figure 3. Depletion of Treg cells during allergen challenge exacerbates Alum-induced eosinophilic airway inflammation
(A) Experimental scheme. Mice were sensitized with CA antigens in Alum and intranasally challenged. PBS or diphtheria toxin (DTX) was injected one day before and on the day of first antigen challenge. (B) BAL cells were examined for eosinophils, neutrophils, and Foxp3 expression in CD4 T cells. (C) The proportion and absolute numbers of each inflammatory cell type were determined. (D) H&E staining of the lung tissues. Pathology score was determined as described in the Methods. (E) Muc5a and Muc5b mRNA expression in the lung tissue was determined by qPCR. (F and G) Lung and draining LN cells were ex vivo stimulated to measure intracellular cytokine expression. The total numbers of cytokine producing CD4 T cells in the lung (F) and draining LN (G) were enumerated by flow analysis. (H) IL-4 secretion in the BAL fluid was determined by ELISA. The data shown represent the mean ± s.d. of more than two independent experiments. Each symbol represents individually tested mouse. The experiments were repeated twice and similar results were observed. *, p<0.05; **, p<0.01; ***, p<0.001.
Figure 4
Figure 4. Depletion of Treg cells during allergen challenge exacerbates CFA-induced neutrophilic airway inflammation
(A) Experimental scheme. Mice were sensitized and challenged as described in Supplementary Fig S1. PBS or diphtheria toxin was injected one day before and on the day of first antigen challenge. (B) BAL cell profiles at sacrifice. (C) Total BAL cell numbers were analyzed. (D) H&E staining of the lung tissues. Pathology score was determined as described in the Methods. (E) Muc5a and Muc5b mRNA expression in the lung tissue was determined by qPCR. (F and G) Lung (F) and draining LN (G) cells were ex vivo stimulated to measure intracellular cytokine expression. The total numbers of cytokine producing CD4 T cells were enumerated by flow analysis. (H) IL-17 secretion in the BAL fluid was determined by ELISA. The data shown represent the mean ± s.d. of more than two independent experiments. Each symbol represents individually tested mouse. The experiments were repeated twice and similar results were observed. *, p<0.05; **, p<0.01; ***, p<0.001.
Figure 5
Figure 5. Treg cell expression of adhesion molecule and chemokine expression in the lung
(A) CD49d expression of Treg cells and conventional CD4 T cells in the listed tissues was determined by flow analysis. (B) Vcam1 expression of CD45− CD31+ lung endothelial cells was measured. The data shown represent the mean ± s.d. of three independent experiments. (C) Lung tissues were collected and tissue homogenates were subjected to protein array analysis as described in Methods section. The data shown are the mean ± s.d. of two independent experiments.
Figure 6
Figure 6. Surface phenotypes of infiltrating Foxp3+ Treg cells during eosinophilic and neutrophilic airway inflammation
(A) Lung infiltrating Treg cells from Alum- and CFA-sensitized animals were analyzed for the surface expression of ICOS and Nrp1. (B) CD39 and GITR expression on Foxp3+ Treg cells in the lung were also examined. (C) Lung cells from Alum- and CFA-sensitized mice were stained for CD11c, CD11b, CD80, ICOSL, and CD86. The data shown represent the mean fluorescence intensity (MFI) of the indicated surface molecules in CD11c+ CD11b+ or CD11c− CD11b+ cells. The data shown represent the mean ± s.d. of more than two independent experiments. *, p<0.05; **, p<0.01; ***, p<0.001; ns, not-significant.
Figure 7
Figure 7. Treg cells from Alum-sensitized mice display more suppressive phenotypes
(A) Lung infiltrating Foxp3+ Treg cells from Alum- and CFA-sensitized mice were examined for Ki67 expression. Mice were injected with BrdU 24 hours prior to sacrifice. BrdU incorporation of Treg cells was determined by FACS. Active caspase 8 expression was also measured. (B) The level of Foxp3 expression was measured by GFP expression between the groups. (C) Treg cells were stained for surface CD25 expression. (D) Foxp3+ Treg cells were FACS sorted from the lung tissues of Alum- and CFA-sensitized animals. Treg cell suppression assay was performed using CFSE labeled naïve CD4 T cells as described in the Methods. Foxp3+ Treg cells isolated from lymph nodes of naïve animals were used as controls. % inhibition was calculated based on the CFSE dilution of responder CD4 T cells without Treg cells in the culture. (E) Gata3 and T-bet expression was determined by intracellular FACS analysis. (F) Treg cells were FACS sorted and the expression of the indicated genes was determined by real time PCR analysis. The data shown represent the mean ± s.d. of more than two independent experiments. *, p<0.05; **, p<0.01; ns, not-significant.

References

    1. Tournoy KG, Provoost S, Van Hove C, Joos G. The role of immune tolerance in asthma pathogenesis. Curr Allergy Asthma Rep. 2006;6:437–443. - PubMed
    1. Holgate ST. Innate and adaptive immune responses in asthma. Nat Med. 2012;18:673–683. - PubMed
    1. Holtzman MJ. Asthma as a chronic disease of the innate and adaptive immune systems responding to viruses and allergens. J Clin Invest. 2012;122:2741–2748. - PMC - PubMed
    1. Zhao Y, Yang J, Gao YD, Guo W. Th17 immunity in patients with allergic asthma. Int Arch Allergy Immunol. 2010;151:297–307. - PubMed
    1. Cosmi L, Liotta F, Maggi E, Romagnani S, Annunziato F. Th17 cells: new players in asthma pathogenesis. Allergy. 2011;66:989–998. - PubMed

Publication types

MeSH terms