. 2018 Jan 2;92(2):e01718-17.
doi: 10.1128/JVI.01718-17. Print 2018 Jan 15.

Polyploidy and Mitotic Cell Death Are Two Distinct HIV-1 Vpr-Driven Outcomes in Renal Tubule Epithelial Cells

Affiliations

Polyploidy and Mitotic Cell Death Are Two Distinct HIV-1 Vpr-Driven Outcomes in Renal Tubule Epithelial Cells

Emily H Payne et al. J Virol. .

Abstract

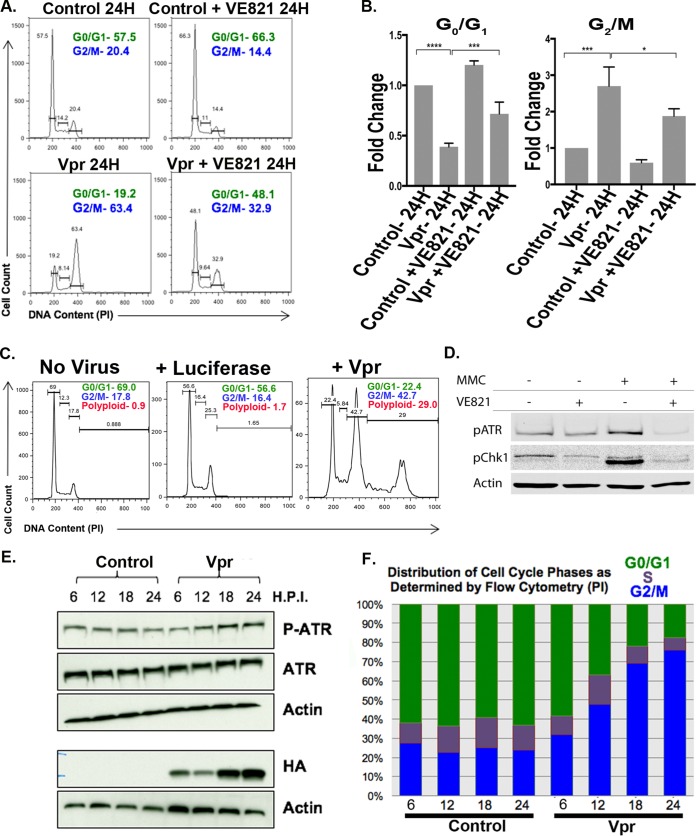
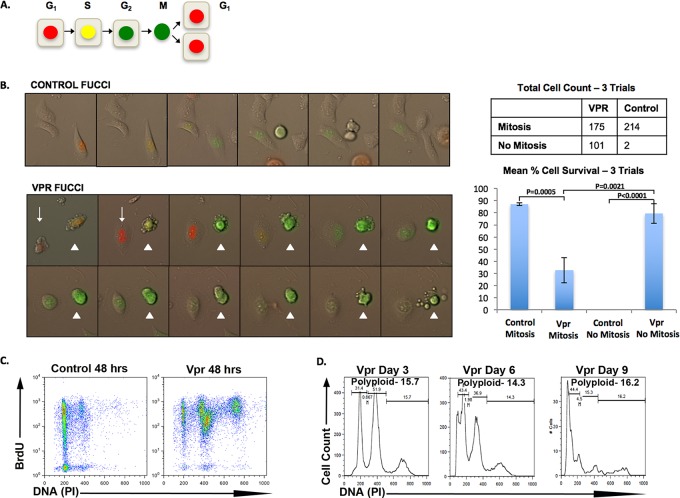
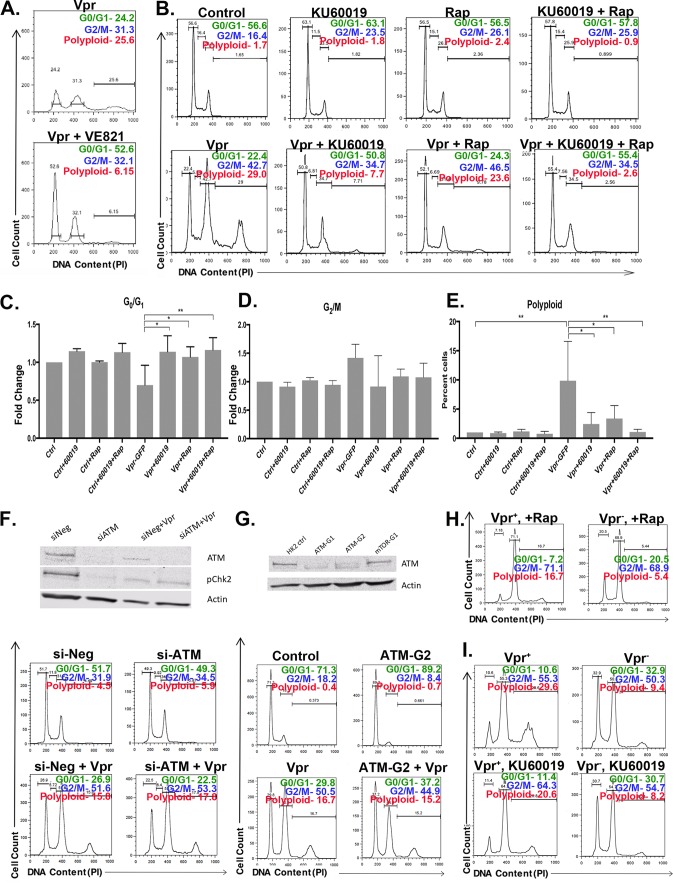
Prior studies have found that HIV, through the Vpr protein, promotes genome reduplication (polyploidy) in infection-surviving epithelial cells within renal tissue. However, the temporal progression and molecular regulation through which Vpr promotes polyploidy have remained unclear. Here we define a sequential progression to Vpr-mediated polyploidy in human renal tubule epithelial cells (RTECs). We found that as in many cell types, Vpr first initiates G2 cell cycle arrest in RTECs. We then identified a previously unreported cascade of Vpr-dependent events that lead to renal cell survival and polyploidy. Specifically, we found that a fraction of G2-arrested RTECs reenter the cell cycle. Following this cell cycle reentry, two distinct outcomes occur. Cells that enter complete mitosis undergo mitotic cell death due to extra centrosomes and aberrant division. Conversely, cells that abort mitosis undergo endoreplication to become polyploid. We further show that multiple small-molecule inhibitors of the phosphatidylinositol 3-kinase-related kinase (PIKK) family, including those that target ATR, ATM, and mTOR, indirectly prevent Vpr-mediated polyploidy by preventing G2 arrest. In contrast, an inhibitor that targets DNA-dependent protein kinase (DNA-PK) specifically blocks the Vpr-mediated transition from G2 arrest to polyploidy. These findings outline a temporal, molecularly regulated path to polyploidy in HIV-positive renal cells.IMPORTANCE Current cure-focused efforts in HIV research aim to elucidate the mechanisms of long-term persistence of HIV in compartments. The kidney is recognized as one such compartment, since viral DNA and mRNA persist in the renal tissues of HIV-positive patients. Further, renal disease is a long-term comorbidity in the setting of HIV. Thus, understanding the regulation and impact of HIV infection on renal cell biology will provide important insights into this unique HIV compartment. Our work identifies mechanisms that distinguish between HIV-positive cell survival and death in a known HIV compartment, as well as pharmacological agents that alter these outcomes.

Keywords: G2 arrest; HIV and kidney; HIV reservoir; PIKK family; Vpr; polyploidy.


Figures

FIG 1
FIG 1
ATR-dependent G2/M arrest in RTECs. (A) Flow cytometric cell cycle analysis of RTEC line HK2 24 h following transduction with TY2-Vpr-GFP with or without the ATR inhibitor VE821. The x axis shows DNA content, as measured by propidium iodide (PI) staining, and the y axis indicates the relative cell number. The percentages of cells within the G0/G1 and G2/M gates are given in each panel. (B) Quantitation of three replicates of the experiment for which results are shown in panel A. The mean value is plotted for each condition (expressed as fold change), and error bars indicate standard deviations. Asterisks indicate significance by one-way ANOVA: *, P < 0.001; **, P < 0.0002; ***, P < 0.0001. (C) Flow cytometric analysis of uninfected HK2 cells (left) or HK2 cells infected with a lentiviral vector expressing luciferase (center) or Vpr (right). The percentages of cell cycle/ploidy classes are given. (D) VE821 potently inhibits ATR activity in HK2 cells. HK2 cells were either left untreated or treated with mitomycin C (MMC), which induces ATR activity. Active ATR levels were monitored by Western blotting with both a phospho-ATR antibody and an antibody to the phosphorylated (active) form of Chk1 (see Materials and Methods). Actin served as a loading control. (E) Time course of ATR phosphorylation in HK2 cells expressing Vpr from HR-HA-Vpr-GFP (HA-Vpr) as measured by Western blotting. H.P.I., hours postinduction. (F) Corresponding cell cycle phase analysis (by flow cytometry) for the same populations of cells for which results are shown in panel E.
FIG 2
FIG 2
A subset of HIV-1 Vpr+ renal tubule epithelial cells escape ATR-dependent G2 arrest to become polyploid. (A) Flow cytometric analysis of HK2 cells showing the emergence of polyploidy in TY2-Vpr-GFP+ RTECs over time. The same data are averaged for three replicates and are plotted below. (B) (Top left and center) Flow cytometric analysis of HK2 cells 48 h following transduction with TY2-Vpr-GFP (VPR 48H) or TY2-Q65R-GFP (Vpr Q65R 48H) or following treatment with doxorubicin (Doxo) or cisplatin. (Top right) Flow cytometric analysis of HK2 cells 48 h after transduction with Vpr (integrase-positive) or Vpr In- (integrase-deficient) viruses. (Bottom) HK2 cells were harvested 3 days after infection with a lentivirus expressing either HA-tagged wild-type (WT) Vpr or HA-tagged Vpr with a Q65R mutation. Cells were prepared for Western blotting as described in Materials and Methods and were probed with an anti-HA antibody. Actin served as a loading control. −, no-infection control. The HA/actin ratios for WT and Q65R Vpr are plotted, with the average of three replicates for Q65R Vpr shown. n.s., not significant. The mean DNA contents, averaged (± standard deviations) from three separate replicates of the doxorubicin and cisplatin experiments, are also plotted in a bar graph. (C) Flow cytometric analysis of HK2 cells infected with NL4-3.HSA.Vpr+ or Vpr viruses pseudotyped with the VSV-G envelope. Infections were performed for 3 days. (D) SUP-T1 T cells were either left uninfected or infected with a TY2-Luc-GFP (control) or TY2-Vpr-GFP virus. Cells were harvested at 3 days postinfection and their DNA contents measured by flow cytometry.
FIG 3
FIG 3
Vpr+ RTECs undergo aberrant mitosis following a prolonged G2 phase. (A) (Left) Schematic indicating how DNA content (measured by propidium iodide [PI] staining) and mitosis (measured by anti-phospho-histone H3 [pH3]) can distinguish between the G0/G1, G2, and M phases. (Center) Flow cytometry plot at 0 min after thymidine release. The percentage of each discernible cell cycle stage is given. (Right) Flow chart showing the steps performed for thymidine synchronization of HK2 cells. (B) Time course of DNA content or percentage of mitotic cells over time in synchronized HK2 control cells and HK2 cells transduced with HR-HA-VprΔGFP. (Left) Graphical representation of flow cytometry analysis of the percentage of cells with 4C DNA content at each time point. (Right) Percentage of mitotic (pH3+) cells within that 4C population at each time point. (C) Immunofluorescence microscopy of mitosis in synchronized HK2 cells 18 h after transduction with HR-HA-VprΔGFP. A total of 22.1% of mitotic Vpr+ cells, had spindle defects, including multipolar spindles (Vpr1, Vpr2), in contrast to only 6.0% of control cells (627 control cells and 461 Vpr cells [P, <0.00001 by the chi-square test]).
FIG 4
FIG 4
Bypassing mitosis favors survival and polyploidy in Vpr+ RTECs. (A) Schematic representation of FUCCI cell cycle indicators. (B) (Top left) Live-cell imaging of HK2 cells transduced with FUCCI vectors. Shown is a representative cell undergoing mitosis and splitting into daughter cells. (Bottom left) Live-cell imaging of HK2 cells cotransduced with HR-HA-VprΔGFP and FUCCI vectors. Cells were counted and were characterized as either mitotic (arrowhead) or not mitotic (arrow). The table at the top right indicates total cell counts for three separate trials. The graph below the table indicates average survival rates for cells that undergo mitosis versus cells that do not complete mitosis in control and Vpr+ cells in 3 separate trials. Error bars represent 95% confidence intervals. (C) Flow cytometry analysis of BrdU incorporation (y axis) and DNA content (PI) (x axis) in control HK2 cells (Control 48 hrs) and HK2 cells transduced with HR-HA-VprΔGFP (Vpr 48 hrs). (D) Flow cytometric analysis showing that polyploidy persists in HK2 cells transduced with TY2-Vpr-GFP over time. The x axis shows DNA content, and the y axis indicates the relative cell number.
FIG 5
FIG 5
PIKK inhibitors block multiple steps in the Vpr-mediated progression to polyploidy. (A) Flow cytometric cell cycle analysis of HK2 cells 48 h following transduction with TY2-Vpr-GFP with or without VE821. The x axis shows the DNA content, and the y axis indicates the relative cell number. The relative numbers of cells within the G0/G1, G2/M, and polyploid gates are indicated in each panel. (B) Flow cytometric analysis as in panel A for cells treated with luciferase (control), KU60019, rapamycin (Rap), or KU60019 and rapamycin together. Vpr expression is as in panel A where indicated. (C to E) Quantitation of three replicates of the experiment for which results are shown in panel B. The mean value is plotted for each condition (expressed as the fold change or percentage of cells as indicated), and error bars indicate standard deviations. Asterisks indicate significance by one-way ANOVA (*, P < 0.001; **, P < 0.0002; ***, P < 0.0001). (F) siRNA treatment targeting ATM. (Top) Western blot of HK2 cells treated with a negative control (si-Neg) or ATM (si-ATM) siRNA, with or without Vpr expression. Cells were probed for ATM, phospho-Chk2, and actin as a loading control. (Bottom) Flow cytometric analysis of the DNA contents of cells treated with the indicated siRNA and expressing or not expressing Vpr, as indicated. The relative number of cells is plotted, and the percentage of cells in a given class of DNA content is indicated in each panel. (G) CRISPR/Cas9-mediated ATM deletion in HK2 cells. (Top) Western blot of HK2 cells (ctrl), two different ATM guide RNAs (ATM-G1 and ATM-G2), and an mTOR guide RNA (mTOR-G1). Cells were probed for ATM or for actin as a loading control. (Bottom) Flow cytometric analysis of HK2 or ATM-G2 (ATM-deleted) cell lines upon infection with TY2-Vpr-GFP. (H and I) Flow cytometric analysis of HK2 cells, infected with an NL4-3.HSA.Vpr+ or Vpr virus pseudotyped with the VSV-G envelope and then treated with rapamycin (H) or KU60019 (I). Infections were performed for 3 days, and the drug was added 1 h after infection. For control data, see Fig. 2C.
FIG 6
FIG 6
DNA-PK inhibitors eliminate polyploidy without affecting G2/M arrest. (A) HK2 cells were either left uninfected or infected with TY2-Vpr-GFP. Four hours postinfection, NU7441 (a DNA-PK inhibitor) was added to the medium. Cells were harvested 2 days postinfection and their DNA contents measured by flow cytometry. (B to D) Quantitation of the results for three replicates of the experiment for which results are shown in panel A. (E) Flow cytometric analysis of HK2 cells that were first infected with an NL4-3.HSA.Vpr+ or Vpr virus pseudotyped with the VSV-G envelope and then treated with NU7441. Infections were performed for 2 days, and the drug was added 1 h after infection.
FIG 7
FIG 7
Model for escape from G2 arrest and polyploidy progression in Vpr+ RTECs. In renal cells, expression of HIV-1 Vpr induces G2 arrest. Cells that escape G2 arrest either undergo aberrant mitosis followed by mitotic cell death or endoreplicate to become polyploid. Inhibitors known to target PIKK family members block distinct steps of the progression to polyploidy in renal cells.

References

    1. Rosenberg AZ, Naicker S, Winkler CA, Kopp JB. 2015. HIV-associated nephropathies: epidemiology, pathology, mechanisms and treatment. Nat Rev Nephrol 11:150–160. doi:10.1038/nrneph.2015.9. - DOI - PubMed
    1. Mallipattu SK, Salem F, Wyatt CM. 2014. The changing epidemiology of HIV-related chronic kidney disease in the era of antiretroviral therapy. Kidney Int 86:259–265. doi:10.1038/ki.2014.44. - DOI - PubMed
    1. Bruggeman LA, Ross MD, Tanji N, Cara A, Dikman S, Gordon RE, Burns GC, D'Agati VD, Winston JA, Klotman ME, Klotman PE. 2000. Renal epithelium is a previously unrecognized site of HIV-1 infection. J Am Soc Nephrol 11:2079–2087. - PubMed
    1. Cohen AH, Sun NC, Shapshak P, Imagawa DT. 1989. Demonstration of human immunodeficiency virus in renal epithelium in HIV-associated nephropathy. Mod Pathol 2:125–128. - PubMed
    1. Marras D, Bruggeman LA, Gao F, Tanji N, Mansukhani MM, Cara A, Ross MD, Gusella GL, Benson G, D'Agati VD, Hahn BH, Klotman ME, Klotman PE. 2002. Replication and compartmentalization of HIV-1 in kidney epithelium of patients with HIV-associated nephropathy. Nat Med 8:522–526. doi:10.1038/nm0502-522. - DOI - PubMed

Publication types

MeSH terms

Substances

LinkOut - more resources