. 2017 Nov 14;114(46):E9942-E9951.
doi: 10.1073/pnas.1707658114. Epub 2017 Nov 1.

The immunopeptidomic landscape of ovarian carcinomas

Affiliations

The immunopeptidomic landscape of ovarian carcinomas

Heiko Schuster et al. Proc Natl Acad Sci U S A. .

Abstract

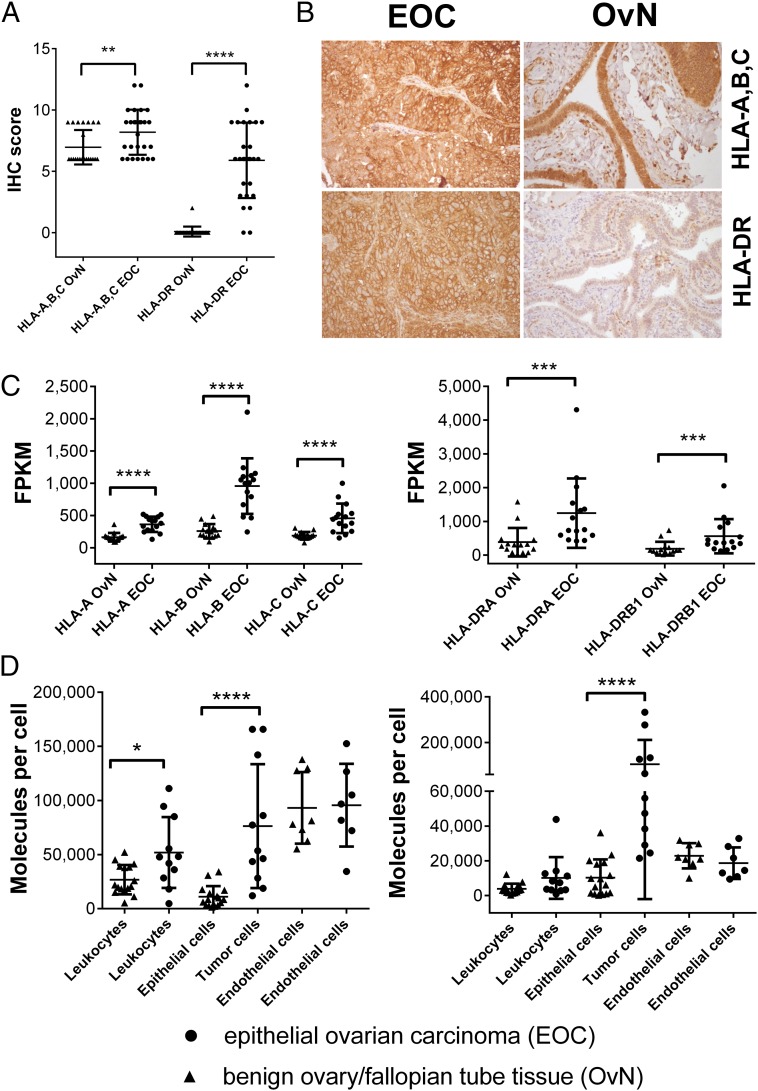
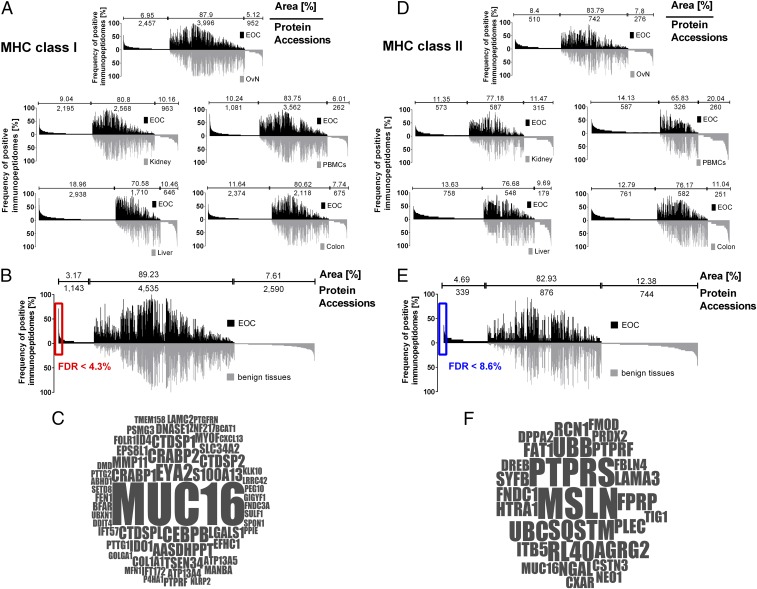
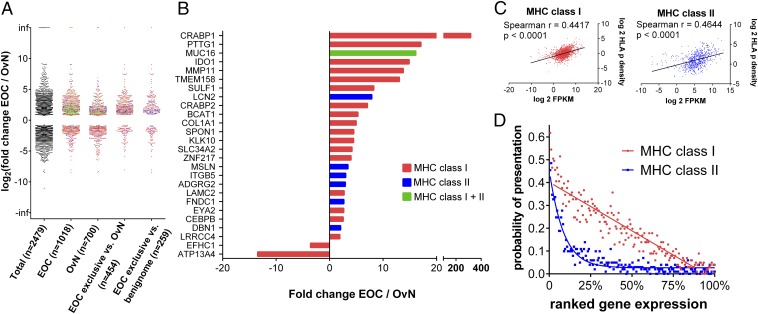
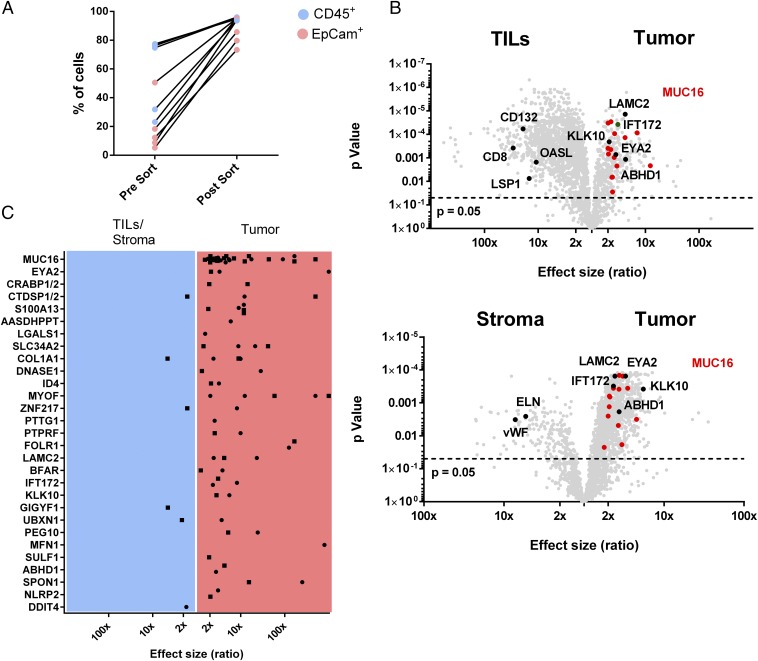
Immunotherapies, particularly checkpoint inhibitors, have set off a revolution in cancer therapy by releasing the power of the immune system. However, only little is known about the antigens that are essentially presented on cancer cells, capable of exposing them to immune cells. Large-scale HLA ligandome analysis has enabled us to exhaustively characterize the immunopeptidomic landscape of epithelial ovarian cancers (EOCs). Additional comparative profiling with the immunopeptidome of a variety of benign sources has unveiled a multitude of ovarian cancer antigens (MUC16, MSLN, LGALS1, IDO1, KLK10) to be presented by HLA class I and class II molecules exclusively on ovarian cancer cells. Most strikingly, ligands derived from mucin 16 and mesothelin, a molecular axis of prognostic importance in EOC, are prominent in a majority of patients. Differential gene-expression analysis has allowed us to confirm the relevance of these targets for EOC and further provided important insights into the relationship between gene transcript levels and HLA ligand presentation.

Keywords: immunopeptidome; immunotherapy; mesothelin; mucin 16; ovarian cancer.


Conflict of interest statement

Conflict of interest statement: H.-G.R. is a shareholder of Immatics Biotechnologies, Tübingen, and CureVac GmbH, Tübingen. H.S. and D.J.K. are employees of Immatics Biotechnologies GmbH. The authors declare that Immatics did not provide neither financial nor scientific support in any direct relation to this manuscript or the underlying studies, and was not involved in data collection, analysis, or decision to publish.

Figures

Fig. 1.
Fig. 1.
EOCs show an increased MHC class I and II expression. (A) IHC assessment of HLA-A, -B, -C (Ab clone H2A) and HLA-DR (Ab clone L243) expression on EOC (n = 27), as well as fallopian tube samples OvN (n = 24). (B) Representative photomicorgraphs of EOC and benign fallopian tubes after IHC stainings at 200× magnification. (C) Gene-expression analysis of HLA class I and HLA-DR genes. RNA-Seq was used to characterize gene expression, determined as FPKM values. Expression levels for HLA-DP/HLA-DQ genes can be found in Fig. S1. (D) HLA class I (Left, Ab clone W6/32) and HLA-DR (Right, Ab clone L243) expression on different cell types within EOC and benign ovarian/fallopian tissue after enzymatic dissociation. Individual cell populations were characterized by distinct cell surface markers (leukocyte compartments: CD45+, tumor cells/epithelial cell compartments: CD45EpCAM+, endothelial cell compartments: CD45CD31+). Quantification of cell-type–specific surface expression was performed using a bead-based standard (QIFIKIT) (see SI Methods). Each data point represents the mean of triplicate experiments performed for each sample. For an overview on the gating strategy and the outlined process, see Fig. S2. Raw values for median fluorescence intensity and calculated copy numbers per cell can be found in Dataset S2. Throughout the figure, nonparametric Mann–Whitney test was used to test for significance (*P < 0.05; **P < 0.01, ***P < 0.001, ****P < 0.0001) due to rejected normality test (D’Agostino and Pearson). Data points represent individual samples unless stated otherwise. Horizontal lines indicate mean values ± SD.
Fig. 2.
Fig. 2.
Immunopeptidome analysis of EOC and comparative profiling to various benign tissues. (A) Comparative profiling and overlap analyses of HLA class I ligand source proteins of EOC (n = 42) in comparison with benign ovary/fallopian tube tissue (n = 23), benign kidney tissue (n = 20), healthy donor PBMCs (n = 30), benign liver tissue (n = 15), and benign colorectal tissue (n = 20). Profiling is based on the frequency of positive immunopeptidomes (i.e., HLA-restricted representation of ligand source proteins within the different cohorts), as indicated on the y axis. The number of ligand source proteins that are unique to either EOC or benign tissues, as well as the number of shared source proteins, is indicated above each graph, together with the respective area under the curve in percentage of total area (i.e., number of ligand source proteins × frequency of presentation of each source protein). To cope with differences in the depth of sample analyses (i.e., number of identified peptides per sample in EOC vs. benign tissues) peptide identifications for EOC were ranked according to abundance (i.e., area of the peptide ID) and artificially truncated to the median number of peptide identifications of respective benign tissues. (B) Comparative profiling and overlap analysis of HLA class I ligand source proteins of EOC in comparison with the entirety of benign tissues, deliberately excluding benign ovarian/fallopian tube tissue during comparative profiling to avoid loss of differentiation antigens possibly shared among tumor and benign ovarian tissues. Differences in the depth of sample analysis were addressed by ranking and artificially truncating the EOC dataset to the median number of peptide identification of benign tissues. Number of protein accessions and area (%) are presented accordingly. The significance threshold for exclusively presented proteins (FDR) was calculated by comparing the number of EOC exclusively presented HLA ligand source proteins at different presentation frequencies in the investigated cohort to a virtual cohort generated by in silico-based random weighted sampling from the entirety of protein identifications of both original cohorts. The in silico-generated randomized immunopeptidomes are of the same size and number of proteins as the real cohorts, but their origin (i.e., whether they are presented on EOC or benign tissues) is ignored for this analysis. Randomization of HLA ligand source proteins, cohort assembly, and assessment of exclusively presented HLA ligand source proteins was repeated 1,000 times. The mean value of resulting exclusively presented antigens, which randomly associate with either cohort, is then compared with the number of exclusively presented antigens in the original cohort at different presentation frequencies. A minimal threshold for HLA class I ligand source proteins exclusively presented on EOC of >10% (≥5 samples) presentation frequency was chosen with a corresponding FDR of 0.043 (4.3%). Gene names of respective source proteins are presented in a word cloud in C. The size of the font correlates with the presentation frequency in the EOC cohort. (D) Comparative profiling and overlap analyses of HLA class II ligand source proteins of epithelial ovarian cancer (EOC, n = 30) in comparison with benign ovary/fallopian tube tissue (n = 19), benign kidney tissue (n = 15), healthy donor PBMCs (n = 15), benign liver tissue (n = 10), and benign colorectal tissue (n = 15). Differences in the depth of sample analysis are adjusted using the same approach as in A and B. (E) Comparative profiling and overlap analysis of HLA class II ligand source proteins of EOC in comparison with the entirety of benign tissues deliberately excluding benign ovarian tissue samples during comparative profiling to avoid losing differentiation antigens possibly shared among tumor and benign ovarian tissues. Differences in the depth of sample analysis were adjusted (A and B). A minimal threshold exclusively on EOC-presented HLA class II ligand source proteins of >10% (≥4 samples) presentation frequency was chosen with a corresponding FDR of 0.086 (8.6%). Gene names of respective source proteins are presented in a word cloud in F. The size of the font correlates with the presentation frequency in the EOC cohort.
Fig. 3.
Fig. 3.
Differential analysis of gene expression of ovarian cancer (EOC) vs. benign fallopian tube samples (OvN) by RNA-Seq and correlation to the immunopeptidome. (A) Distribution of significantly differentially expressed genes (adjusted P < 0.05) from a gene-expression analysis of 15 ovarian cancer (EOC) and 15 benign fallopian tube samples (OvN). Among the differentially expressed genes, a total of 2,479 could be mapped to a single UniProtKB/Swiss-Prot accession of the human proteome, which has been previously used as a data source for immunopeptidome analysis and HLA ligand identification. Additional distributions show differentially expressed genes reflected in the immunopeptidome of ovarian cancer (EOC), benign tubal and ovarian tissue (OvN), and subsets of the immunopeptidome after comparative profiling (i.e., EOC exclusive genes after comparative profiling of the EOC dataset to tubo-ovarian tissues or a respective set of benign tissues). Differentially expressed genes that give rise only to MHC class I or MHC class II genes are colored in red (class I) or blue (class II), whereas genes that give rise to both classes of MHC ligands are colored in green. (B) Differentially expressed genes among TOP EOC exclusively presented antigens (i.e., TOP56 class I and TOP28 class II antigens of EOC immunopeptidome after comparative profiling to the set of benign tissues). (C) Correlation of gene expression (FPKM values) and immunopeptidomic presentation (expressed as HLA-peptide density; see SI Methods for further information) for OvCa 111. Nonparametric two-tailed Spearman rank correlation was employed to test for the degree of correlation. (D) Probability of MHC presentation in relation to gene expression. Gene-expression values (FPKM values) of OvCa 111 were ranked from high to low and divided into bins of 100 genes. For each bin, the number of genes that are presented on the immunopeptidomic level (MHC class I in red and MHC class II in blue) was determined and plotted accordingly as probability of presentation (i.e., a probability of 0.4 means that 40 of 100 genes were presented on the immunopeptidome level). Linear and sigmoidal trendlines have been added for visualization purposes.
Fig. 4.
Fig. 4.
Cellular origin of EOC-presented antigens. (A) Percentage of CD45+ tumor infiltrating leukocytes (TILs) and CD45EpCAM+ tumor cells before and after enrichment via MACS. (B) Volcano plots of the relative abundance of HLA ligands in the class I immunopeptidome of enriched cell populations of OvCa 84, analyzed by label-free quantitation. Panels show TIL (CD45+) vs. tumor cells (CD45EpCAM+; Upper) and stroma cells (CD45EpCAM) vs. tumor cells (Lower). The horizontal dashed line indicates significance threshold after adjustment for multiple testing (P < 0.05). TOP56 EOC exclusive ligands MHC class I antigens [MUC16 (red), IFT172, EYA2, LAMC2, KLK10, and ABHD1] as well as ligands derived from established leukocyte-associated antigens (CD132, CD8, LSP1, OASL) and stroma cell-associated antigens (ELN, vWF) are highlighted. (C) Cumulative results from label free quantitation of five tumors (OvCa 84, OvCa 73, OvCa 70, OvCa 60, OvCa 57) after MACS enrichment. Dots show peptides significantly enriched on stroma or tumor cells whereas squares indicate peptides significantly enriched on TILs or tumor cells. Enrichment and P values for all EOC exclusive class I antigens identified in the five EOCs analyzed can be found in Dataset S2.

References

    1. Siegel RL, Miller KD, Jemal A. Cancer statistics, 2016. CA Cancer J Clin. 2016;66:7–30. - PubMed
    1. Coleman RL, Monk BJ, Sood AK, Herzog TJ. Latest research and treatment of advanced-stage epithelial ovarian cancer. Nat Rev Clin Oncol. 2013;10:211–224. - PMC - PubMed
    1. Herzog TJ, Pothuri B. Ovarian cancer: A focus on management of recurrent disease. Nat Clin Pract Oncol. 2006;3:604–611. - PubMed
    1. Mirza MR, et al. ENGOT-OV16/NOVA Investigators Niraparib maintenance therapy in platinum-sensitive, recurrent ovarian cancer. N Engl J Med. 2016;375:2154–2164. - PubMed
    1. Kandalaft LE, Powell DJ, Jr, Singh N, Coukos G. Immunotherapy for ovarian cancer: What’s next? J Clin Oncol. 2011;29:925–933. - PMC - PubMed

Publication types

MeSH terms