. 2017 Nov;29(11):2753-2765.
doi: 10.1105/tpc.17.00367. Epub 2017 Nov 1.

Canalization of Tomato Fruit Metabolism

Affiliations

Canalization of Tomato Fruit Metabolism

Saleh Alseekh et al. Plant Cell. 2017 Nov.

Abstract

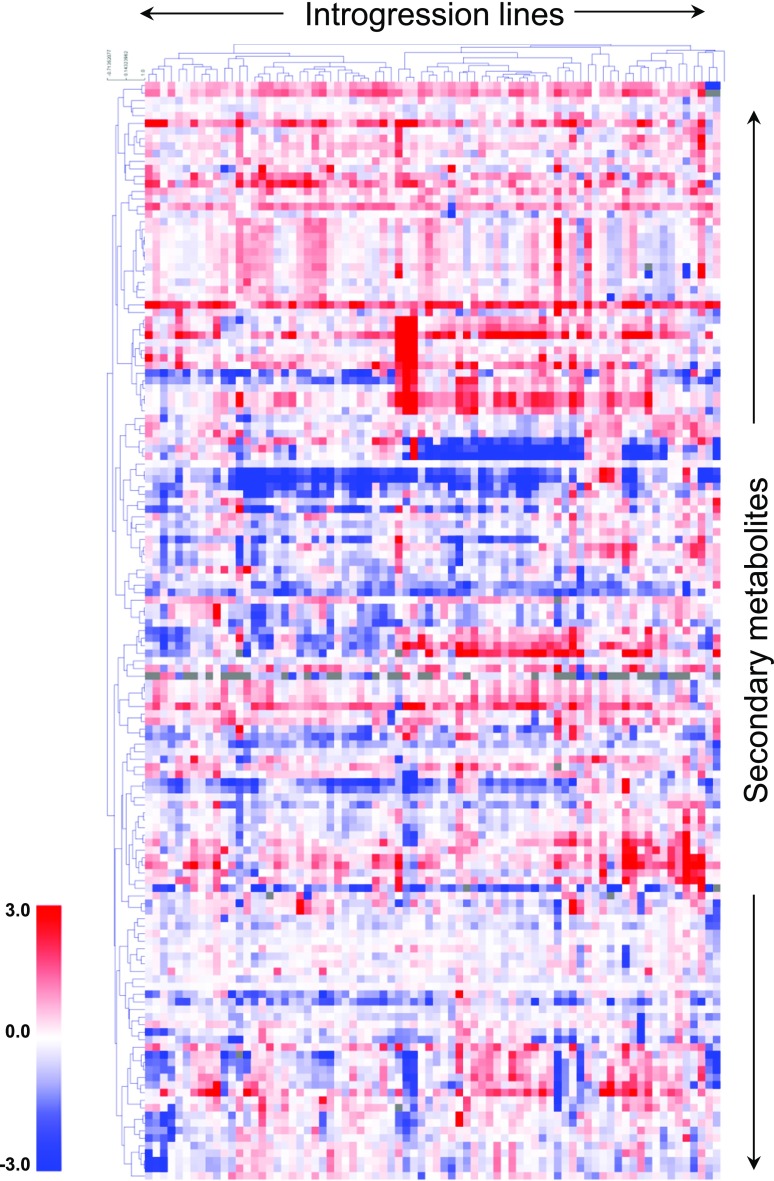
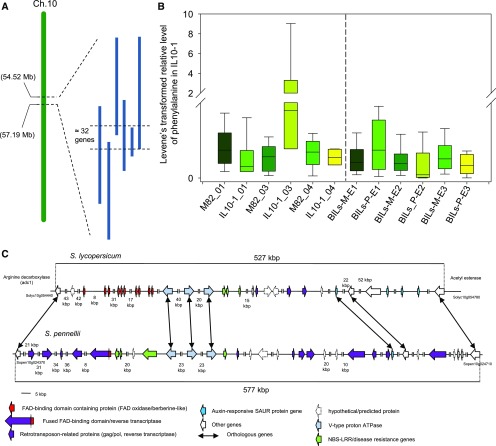
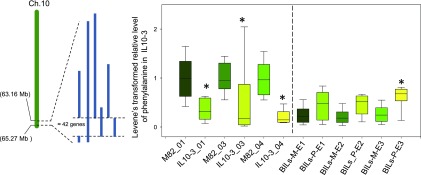
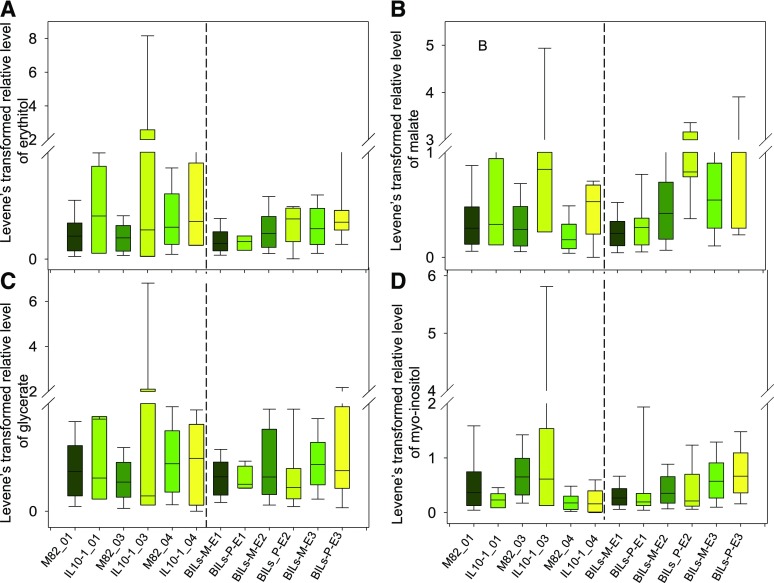
To explore the genetic robustness (canalization) of metabolism, we examined the levels of fruit metabolites in multiple harvests of a tomato introgression line (IL) population. The IL partitions the whole genome of the wild species Solanum pennellii in the background of the cultivated tomato (Solanum lycopersicum). We identified several metabolite quantitative trait loci that reduce variability for both primary and secondary metabolites, which we named canalization metabolite quantitative trait loci (cmQTL). We validated nine cmQTL using an independent population of backcross inbred lines, derived from the same parents, which allows increased resolution in mapping the QTL previously identified in the ILs. These cmQTL showed little overlap with QTL for the metabolite levels themselves. Moreover, the intervals they mapped to harbored few metabolism-associated genes, suggesting that the canalization of metabolism is largely controlled by regulatory genes.


Figures

Figure 1.
Figure 1.
Hierarchical Clustering Heat Map of the Secondary Metabolite Profiles of Three Independent Studies of the Pericarp Metabolite Content of the ILs Compared with the Parental Control S. lycopersicum (cv M82). Data represent measurements of fruit material harvested in field trials performed in 2001, 2003, and 2004 and are presented as the log2 average of fold changes across the three seasons compared with M82. Red and blue regions indicate that the metabolite content is increased or decreased, respectively, after introgression of S. pennellii segments. A fully annotated heat map is provided in Supplemental Figure 1, and the complete data set is presented in Supplemental Data Set 1.
Figure 2.
Figure 2.
Putative cmQTL. Chromosome mapping of putative canalized primary metabolite QTL based on the genetic map of the S. pennellii introgression lines (http://www.sgn.cornell.edu). The figure shows 84 major cmQTL primary metabolites using the reaction norm of the trait (RxNV) approach. cmQTL highlighted in blue are significant at a level of α = 0.05 after Bonferroni correction for multiple hypotheses testing. For more detailed analysis, see Supplemental Data Sets 11 and 12.
Figure 3.
Figure 3.
Variability of Canalized Metabolites. Interaction plots of canalized metabolites after Levene’s transformation and Bonferroni correction for multiple hypotheses testing. Data represent the relative abundance of metabolites from M82 and ILs after Levene’s transformation from three independent harvest seasons (2001, 2003, and 2004). Data are represented as mean ± sd (n > 6).
Figure 4.
Figure 4.
Validation of Putative cmQTL Using the BIL Population. (A) Schematic representation of chromosome 10 and BILs that have the S. pennellii genomic segments (represented as blue bars). (B) Box plots of relative abundance of metabolites after Levene’s transformation for the validated cmQTL on IL10-1. The left panel represents the analyzed overlapping BIL genotypes. The right panel shows relative metabolite content in the IL and M82 genotypes from three environments. Data are represented as box plots and display the full range of variation from minimum to maximum (n > 6). (C) Schematic representation of the genomic interval harboring the cmQTL for Phe on IL10-1 (corrected P value = 4.01E-6, nominal P value = 5.8E-10). The corresponding region in S. pennellii is characterized by multiple presence-absence variants. E, environment followed by the harvest year; 01, from year 2001; 03, from year 2003; 04, from year 2004; BILs-M-E1, backcross inbred lines that have the M82 genomic segments in this region and grew in environment (harvest) 1; BILs_P E1, backcross inbred lines that have S. pennellii segments in this region and grew in environment (harvest) 1.
Figure 5.
Figure 5.
Validation of Putative cmQTL for Glc-6-P, Fru-6-P, and Maltose Using the BIL Population. Box plots of relative abundance of Glc-6-P, Fru-6-P, and maltose after Levene’s transformation (left panel) and validation using BILs (right panel). On the y axis, the left panel represents the relative abundance of metabolites after Levene’s transformation; data from three independent harvest seasons (2001, 2003, and 2004). The right panel represents the analyzed overlapping BIL genotypes from three independent environments. Data are represented as box plots and display the full range of variation from minimum to maximum (n > 6). E, environment followed by the harvest year; 01, from year 2001; 03, from year 2003; 04, from year 2004; BILs-M-E1, backcross inbred lines that have the M82 genomic segments in this region and grew in environment (harvest) 1; BILs_P E1, backcross inbred lines that have S. pennellii segments in this region and grew in environment (harvest) 1.
Figure 6.
Figure 6.
Validation of Putative cmQTL for Phenylalanine in IL10-3 Using the BIL Population. Box plots of relative abundance of phenylalanine in IL10-3 after Levene’s transformation (left panel) and the validation using BILs (right panel). On the y axis, the left panel represents the relative abundance of metabolites after Levene’s transformation. Data from three independent harvest seasons (2001, 2003, and 2004) are shown. The right panel represents the analyzed overlapping BIL genotypes from three independent environments. Data are represented as box plots and display the full range of variation from minimum to maximum (n > 6). E, environment followed by the harvest year; 01, from year 2001; 03, from year 2003; 04, from year 2004; BILs-M-E1, backcross inbred lines that have the M82 genomic segments in this region and grew in environment (harvest) 1; BILs_P E1, backcross inbred lines that have S. pennellii segments in this region and grew in environment (harvest) 1.
Figure 7.
Figure 7.
Validation of Putative cmQTL Using the BIL Population. Box plots of relative abundance of erythritol (A), malate (B), glycerate (C), and myo-inositol (D) after Levene’s transformation (left panel) and their validation using BILs (right panel). The y axis in the left panel represents the relative abundance of metabolites after Levene’s transformation. Data from three independent harvest seasons (2001, 2003, and 2004) are shown. The right panel represents the analyzed overlapping BIL genotypes from three independent environments. Data are represented as box plots and display the full range of variation from minimum to maximum (n > 6). E, environment followed by the harvest year; 01, from year 2001; 03, from year 2003; 04, from year 2004; BILs-M-E1, backcross inbred lines that have the M82 genomic segments in this region and grew in environment (harvest) 1; BILs_P E1, backcross inbred lines that have S. pennellii segments in this region and grew in environment (harvest) 1.

References

    1. Alon U., Surette M.G., Barkai N., Leibler S. (1999). Robustness in bacterial chemotaxis. Nature 397: 168–171. - PubMed
    1. Alseekh S., et al. (2015). Identification and mode of inheritance of quantitative trait loci for secondary metabolite abundance in tomato. Plant Cell 27: 485–512. - PMC - PubMed
    1. Becker H.C., Leon J. (1988). Stability analysis in plant-breeding. Plant Breed. 101: 1–23.
    1. Bolger A., et al. (2014). The genome of the stress-tolerant wild tomato species Solanum pennellii. Nat. Genet. 46: 1034–1038. - PMC - PubMed
    1. Capel C., Yuste-Lisbona F.J., López-Casado G., Angosto T., Cuartero J., Lozano R., Capel J. (2017a). Multi-environment QTL mapping reveals genetic architecture of fruit cracking in a tomato RIL Solanum lycopersicum × S. pimpinellifolium population. Theor. Appl. Genet. 130: 213–222. - PubMed

LinkOut - more resources