. 2017 Nov 2;2(21):e96034.
doi: 10.1172/jci.insight.96034.

Macrophage-derived oncostatin M contributes to human and mouse neurogenic heterotopic ossifications

Affiliations

Macrophage-derived oncostatin M contributes to human and mouse neurogenic heterotopic ossifications

Frédéric Torossian et al. JCI Insight. .

Abstract

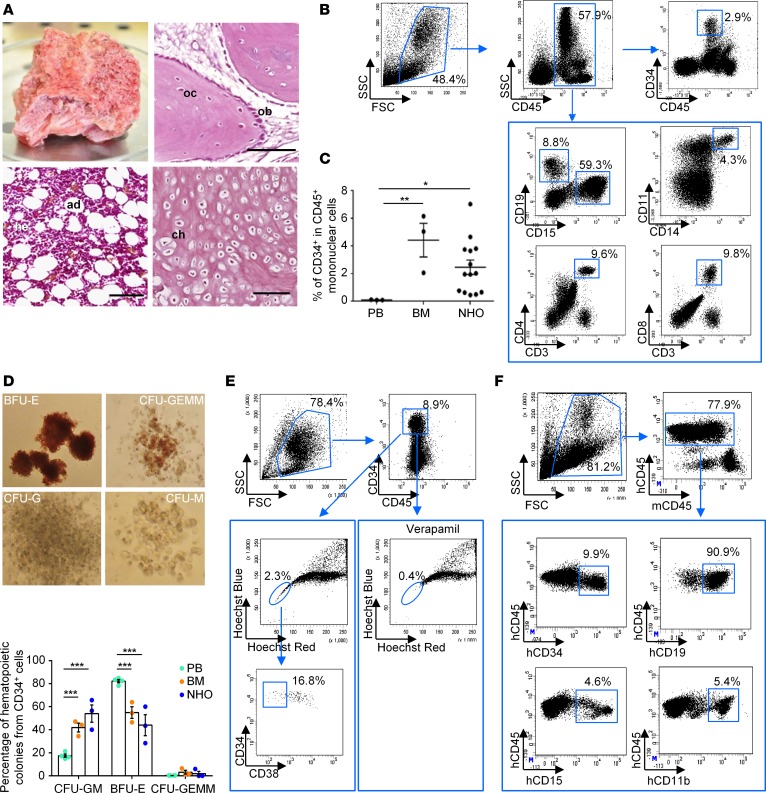
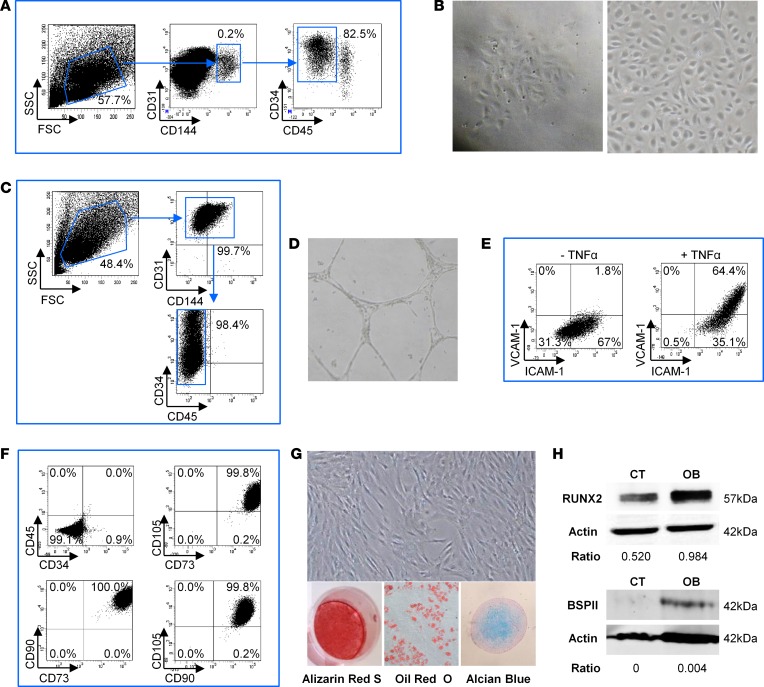
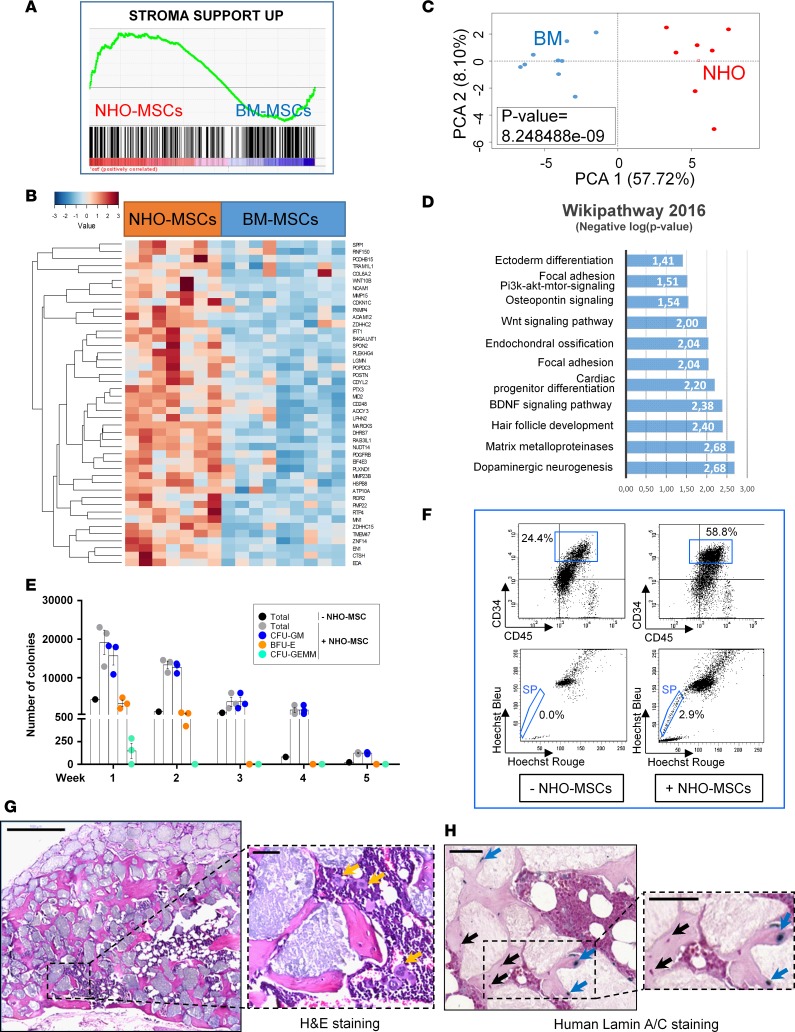
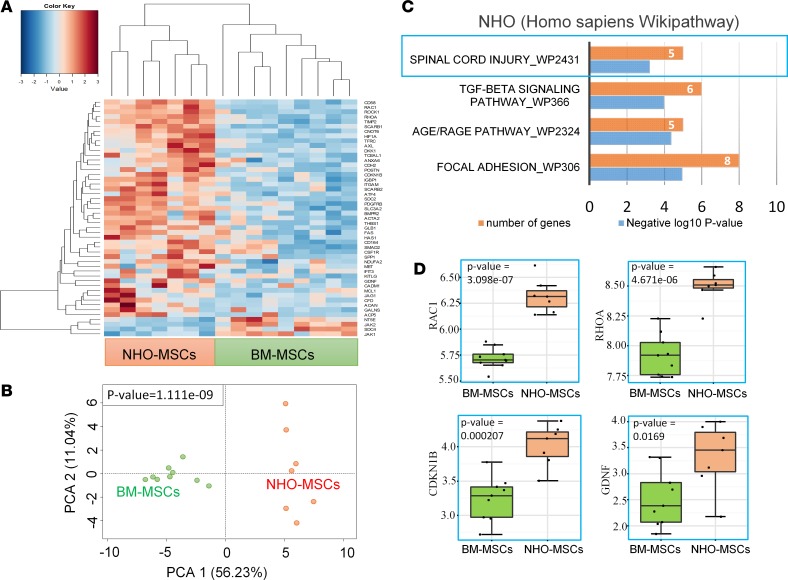
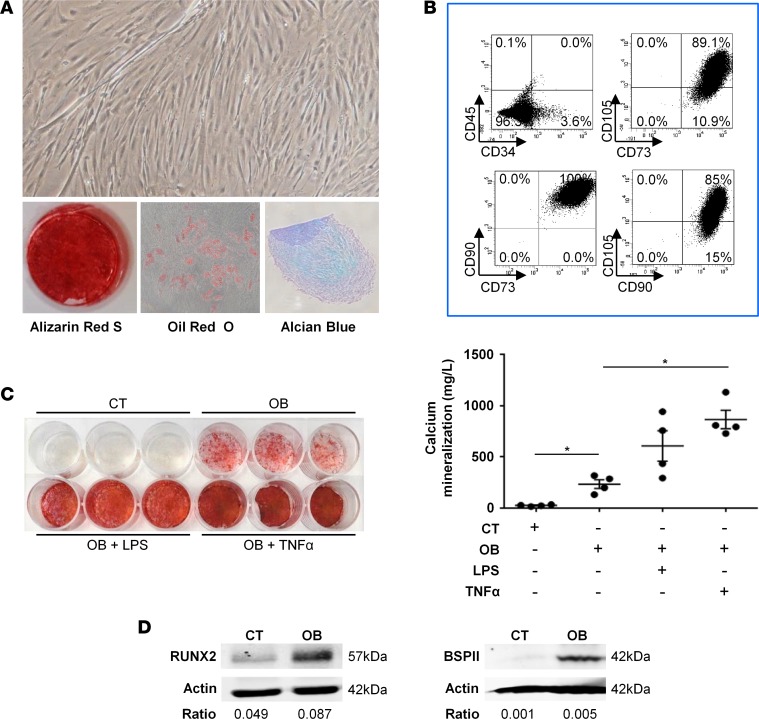
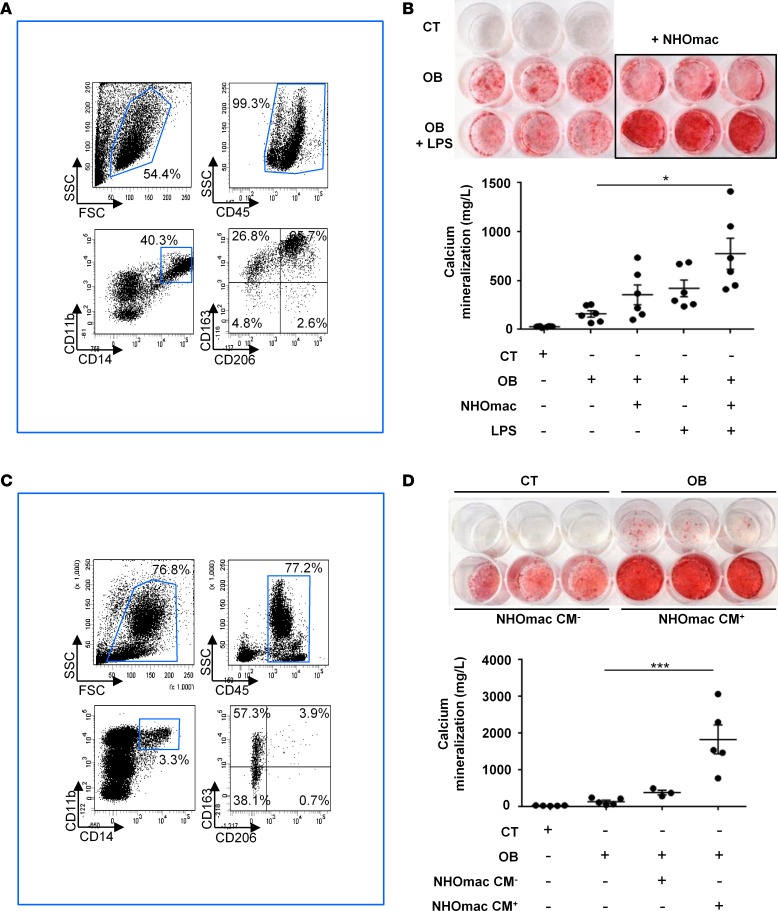
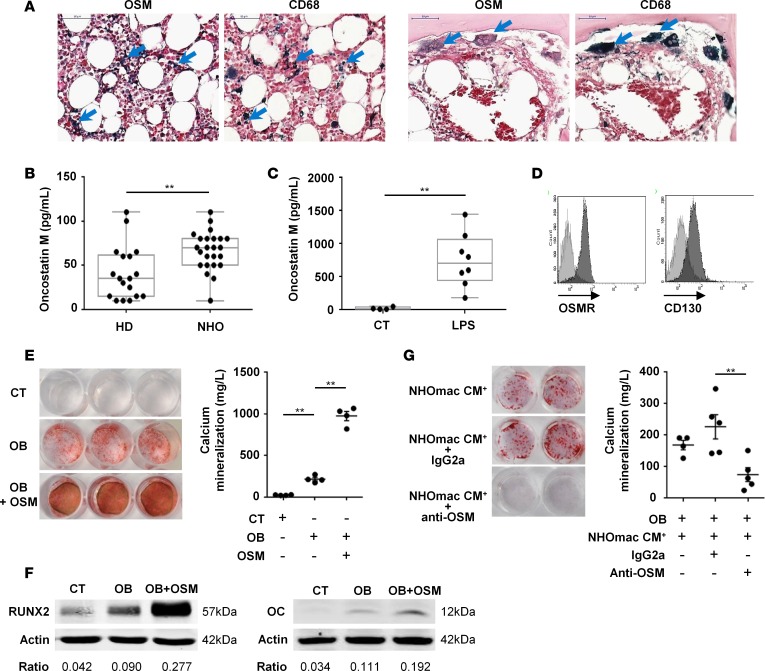
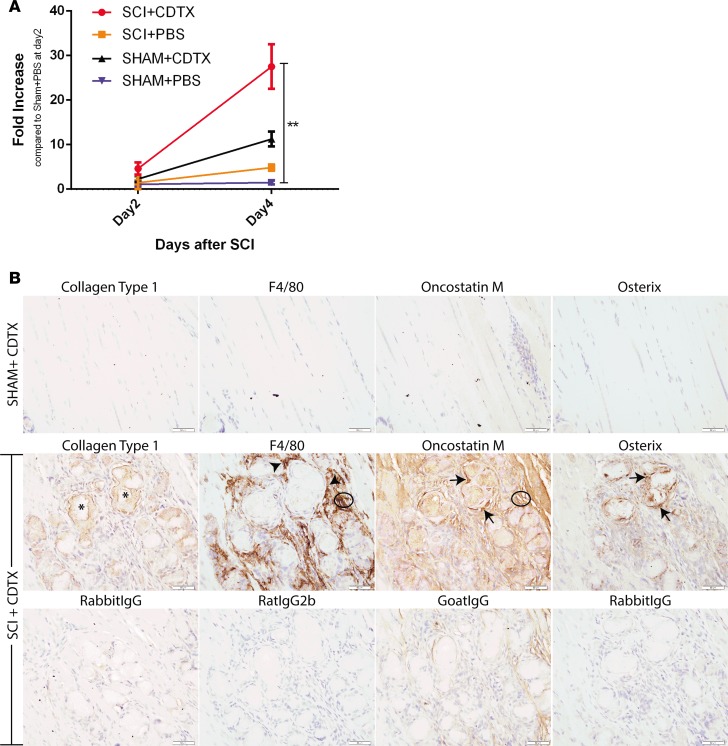
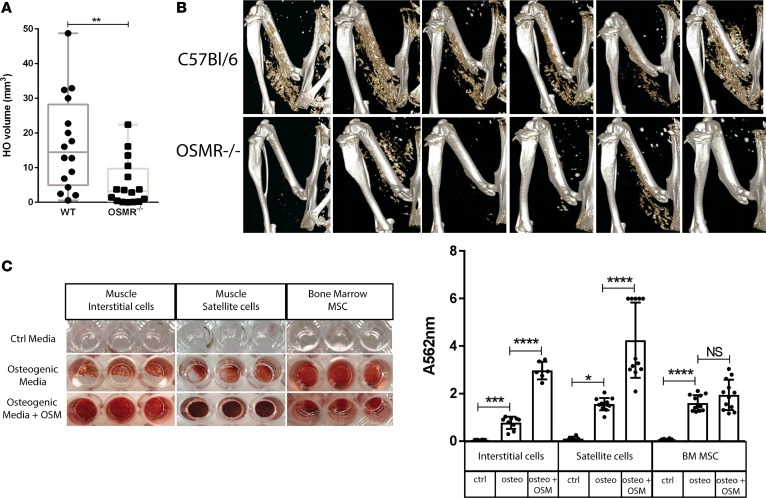
Neurogenic heterotopic ossification (NHO) is the formation of ectopic bone generally in muscles surrounding joints following spinal cord or brain injury. We investigated the mechanisms of NHO formation in 64 patients and a mouse model of spinal cord injury-induced NHO. We show that marrow from human NHOs contains hematopoietic stem cell (HSC) niches, in which mesenchymal stromal cells (MSCs) and endothelial cells provide an environment supporting HSC maintenance, proliferation, and differentiation. The transcriptomic signature of MSCs from NHOs shows a neuronal imprinting associated with a molecular network required for HSC support. We demonstrate that oncostatin M (OSM) produced by activated macrophages promotes osteoblastic differentiation and mineralization of human muscle-derived stromal cells surrounding NHOs. The key role of OSM was confirmed using an experimental model of NHO in mice defective for the OSM receptor (OSMR). Our results provide strong evidence that macrophages contribute to NHO formation through the osteogenic action of OSM on muscle cells within an inflammatory context and suggest that OSM/OSMR could be a suitable therapeutic target. Altogether, the evidence of HSCs in ectopic bones growing at the expense of soft tissue in spinal cord/brain-injured patients indicates that inflammation and muscle contribute to HSC regulation by the brain-bone-blood triad.


Conflict of interest statement

Conflict of interest: The authors have declared that no conflict of interest exists.

Figures

Figure 1
Figure 1. Human NHOs contain functional hematopoietic stem cells.
(A) Fragment of human neurogenic heterotopic ossification (NHO) with hematopoietic activity resected from a patient with stroke. Osteoblasts (ob), osteocytes (oc), hematopoietic cells (he), adipocytes (ad), and chondrocytes (ch) on sections of human NHO biopsies stained with H&E. Scale bar: 100 μm. (B) Flow cytometry characterization on human mononuclear leukocytes from one hematopoietic NHO representative of the 5–14 analyzed. (C) Percentage of CD34+ cells within the CD45+ mononuclear leukocyte fraction from peripheral blood (PB) and bone marrow (BM) from healthy donors and from NHOs. Each dot represents a different donor/patient. Bars represent mean ± SEM (n = 3–14). Kruskal-Wallis test followed by Dunn’s post-hoc tests were used for the statistical analysis (*P ≤ 0.05, **P ≤ 0.01). (D) CD34+ cells from PB, BM, and NHOs were isolated using immunomagnetic cell separation and plated in colony assay with human cytokines. Images show representative colonies from erythroid (BFU-E), granulocyte/erythroid/macrophage/megakaryocyte (CFU-GEMM), granulocytic (CFU-G), and macrophage (CFU-M) progenitors. Data show relative frequencies of granulocyte/macrophage (CFU-GM), BFU-E, and CFU-GEMM progenitors after 14 days of culture (n = 3–4 patients/donors per tissue). Results are expressed as mean ± SEM. Two-way ANOVA followed by Tukey’s post-hoc tests were used (***P ≤ 0.001). (E) NHOs contain side population (SP) CD34+ cells. Lineage-negative cells from NHOs were isolated using immunomagnetic cell separation. SP cells (blue circles) were analyzed by flow cytometer with or without 50 μM verapamil for expression CD34 and CD38 markers (n = 3). (F) CD34+ cells from human NHOs reconstitute human hematopoiesis in immunodeficient mice. CD34+ cells from human NHOs were transplanted intravenously into NSG mice. After 2 months, BM from NSG mice was analyzed by flow cytometry for expression human CD45, CD34, B lymphoid CD19, and myeloid CD11b and CD15 markers (n = 6).
Figure 2
Figure 2. Human NHOs contain endothelial and mesenchymal niche forming cells.
(A) Sorting of human neurogenic heterotopic ossification (NHO) marrow endothelial cells. After CD31+ immunomagnetic cell enrichment (n = 2), endothelial cells were sorted using the CD31+CD144+CD34+CD45 phenotype. (B) Sorted CD31+CD144+CD34+CD45 NHO cells formed colonies and grew in a cobblestone monolayer characteristic of endothelial cell morphology. (C) After a month in culture, the phenotype of human NHO endothelial cells was verified by a flow cytometer after labeling for CD31, CD144, CD34, and CD45. (D) Human NHO endothelial cells were able to form a tube network when cultured in Matrigel. (E) VCAM-1 and ICAM-1 expression is increased on human NHO endothelial cells after simulation with TNF-α (10 ng/ml). (F) Adherent cells isolated from human NHO were analyzed for classical mesenchymal markers by flow cytometry (n = 4). (G) Adherent cells were isolated in culture from human NHO and induced to differentiate into the 3 classical mesenchymal lineages using specific inductive media (n = 4). Differentiation into osteoblasts, adipocytes, and chondrocytes was evaluated by Alizarin Red S, Oil Red O, and Alcian blue staining, respectively. (H) Western blot showing Runx2 and BSPII protein expression in NHO-MSC cell lysates with (OB) or without (control [CT]) osteoblastic differentiation medium (day 3 and day 21, respectively). Ratios correspond to RUNX2/actin or BSPII/actin. Original magnification, ×4 (B, left); ×10 (B, right; D; and G).
Figure 3
Figure 3. Human NHO-MSCs support in vitro and in vivo hematopoiesis.
(A) Transcriptome gene set enrichment analysis performed with the Charbord et al. expression profile (46) was compatible with a hematopoietic niche support and applied to the expression differential between neurogenic heterotopic ossification (NHO; n = 7) and bone marrow (BM; n = 9) mesenchymal stromal cells (MSCs). (B) Heatmap representing hematopoiesis-supporting genes upregulated in NHO-MSCs versus BM-MSCs; each column represents the transcriptome of MSCs from individual patients (NHO-MSCs) or healthy donor controls (BM-MSCs). (C) Unsupervised principal component analysis performed with genes supporting hematopoiesis discriminated NHO-MSCs from BM-MSCs (P value calculated by correlation of the group variable to the first principal axis). (D) Bar plot representing functional enrichment analysis (WikiPathway database) showing hematopoiesis supporting genes overexpressed in NHO-MSCs (bars represent negative logarithm base 10 of the enrichment P value). (E) Number of colonies formed from human BM hematopoietic cells cocultured with NHO-MSCs (n = 3) for 5 weeks. Results are expressed as the mean number of colonies for the total number of cells obtained after each weeks of culture ± SEM. (F) Identification of CD45+CD34+ side population (SP) cells obtained after a 4-day coculture of lineage-negative cells from peripheral blood with or without human NHO-MSCs. (G) Scaffolds with human NHO-MSCs implanted into nude mice (H&E). Representative section 10 weeks after implantation in mice (n ≥ 4); yellow arrows indicate the presence of megakaryocytes. Scale bar: 500 μm (left); 50 μm (right). (H) Specific human lamin A/C staining; blue arrows indicate human osteocytes positive for lamin A/C, and black arrows indicate murine cells. Scale bar: 50 μm.
Figure 4
Figure 4. Spinal cord injury imprinting of human NHO-MSCs.
(A) Transcriptome heatmap performed with bone marrow niche functionality–related genes differentially expressed between neurogenic heterotopic ossification (NHO) and bone marrow (BM) mesenchymal stromal cells (MSCs); unsupervised classification was performed with Euclidean distances. Dual-color scale from blue to red is correlated with mRNA level expression. (B) Principal component analysis performed with bone marrow niche–related genes differentially expressed between NHO-MSCs and BM-MSCs (P value of group discrimination was calculated with Pearson correlation of the group variable to the first principal component). (C) WikiPathway functional enrichment of BM niche–related genes upregulated in NHO-MSCs as compared with BM-MSCs (P = 0.0006, P value were estimated by Fisher exact test with Enrichr application). (D) Box plot of genes modulated after spinal cord injury and found upregulated in NHO-MSCs as compared with BM-MSCs (P value was calculated with 2-tailed Student’s t test). The box-and-whisker plot shows median, 25th and 75th percentile, minimum and maximum values.
Figure 5
Figure 5. Osteogenic potential of human NHO-MDSCs in response to proinflammatory stimuli.
(A) Neurogenic heterotopic ossification muscle-derived stromal cells (NHO-MDSCs) were isolated, cultured, and then subsequently induced to differentiate into 3 mesenchymal lineages using specific media. Differentiation into osteoblasts, adipocytes, and chondrocytes was evaluated by Alizarin Red S, Oil Red O, and Alcian blue staining, respectively. Original magnification, ×10. (B) NHO-MDSCs express classical mesenchymal markers, as shown by flow cytometry. (C) NHO-MDSCs were cultured in control medium (CT) or osteogenic medium alone (OB) or were supplemented with LPS (100 ng/ml) (OB + LPS) or TNF-α (100 ng/ml) (OB + TNF-α) for 3 weeks. Cells were then stained with Alizarin Red S. Calcium mineralization was quantified and expressed as mean ± SEM (n = 4). For statistical analysis, 1-way ANOVA followed by Dunnett’s post-hoc test were used (*P ≤ 0.05, between experimental conditions). (D) Runx2 and BSPII protein expression by Western blot of NHO-MDSC cell lysates with (OB) or without (control [CT]) osteoblastic differentiation medium (day 3 and day 21, respectively). Ratios correspond to RUNX2/actin or BSPII/actin.
Figure 6
Figure 6. Activated macrophages contribute to the osteogenic differentiation of human NHO-MDSCs.
(A) CD34+ cells from human neurogenic heterotopic ossification (NHO) were isolated using immunomagnetic cell separation and induced to differentiate into macrophages for 2 weeks in specific medium. Cells were then analyzed by flow cytometry for expression of myeloid marker CD11b, monocyte/macrophage marker CD14, and M2 macrophage activation marker CD163 and CD206. (B) Activated macrophages derived in vitro from NHO CD34+ cells stimulate NHO muscle–derived stromal cells (NHO-MDSCs). NHO-MDSCs were cultured in control medium (CT) or osteogenic medium alone (OB) or were supplemented with LPS (100 ng/ml, OB LPS) with or without the addition of monocytes/macrophages (mac; 2.105/well/500 μl) differentiated from NHO CD34+ cells (NHOmac). After 3 weeks, cells were then stained with Alizarin Red S. Calcium mineralization was quantified and expressed as mean ± SEM (n = 6). (C) Mononuclear cells from human NHO marrows were analyzed by flow cytometry for mac markers, as in A. (D) Medium conditioned by activated macrophages from human NHO stimulate NHO-MDSC mineralization. In that purpose, CD14+ monocytes/macrophages from human NHO were isolated using immunomagnetic cell separation and cultured with or without LPS (100 ng/ml) for 3 days. Conditioned media with (NHOmac CM+) or without LPS (NHOmac CM) were recovered and added to cultures of NHO-MDSCs. NHO-MDSCs were cultured in control medium (CT) or osteogenic medium alone (OB) or supplemented with NHOmac CM or NHOmac CM+ (diluted at 1:10) for 3 weeks. Cells were then stained with Alizarin Red S. Calcium mineralization was quantified and expressed as mean ± SEM (n ≥ 3). For statistical analysis, 1-way ANOVA followed by Dunnett’s post-hoc test were used (*P ≤ 0.05 and ***P ≤ 0.001).
Figure 7
Figure 7. Macrophage-derived OSM is involved in human NHO formation.
(A) CD68 and oncostatin M (OSM) staining on neurogenic heterotopic ossification (NHO) serial sections. Blue arrows indicate OSM or CD68 dark blue staining. Scale bar: 50 μm. (B) OSM concentrations measured by ELISA in blood plasma from healthy donors (HD) or NHO patients. Each dot represents a different donor/patient, and the box-and-whisker plot shows median, 25th and 75th percentile, minimum and maximum values (n = 18–24; **P ≤ 0.01, nonparametric Mann-Whitney test). (C) NHO CD14+ monocytes/macrophages cultured with or without LPS (100 ng/ml) for 3 days. OSM concentrations were measured in control (CT) or LPS-stimulated conditioned medium (LPS). Each dot is from a different donor (n = 4–8; **P ≤ 0.01, nonparametric Mann-Whitney test). (D) Expression of OSM receptor (OSMR) and CD130 (gp130) on NHO muscle–derived stromal cells (NHO-MDSCs) by flow cytometry. Light gray curves represent isotype-matched control antibodies. (E) NHO-MDSCs were cultured in control medium (CT) or osteogenic medium alone (OB) or supplemented with OSM (100 ng/ml, OB + OSM). Cells were then stained with Alizarin Red S. Calcium mineralization was quantified and expressed as mean ± SEM (n = 4). (F) Western blots show Runx2 and osteocalcin (OC) protein expression in NHO-MDSC lysates stimulated or not with OSM and with (OB) or without (control [CT]) osteoblastic differentiation medium (day 3 and day 21, respectively). (G) Human NHO CD14+ monocytes/macrophages (mac) were cultured with LPS (100 ng/ml) for 3 days and conditioned media (NHOmac CM+) were recovered. NHO-MDSCs were cultured in osteogenic medium supplemented with NHOmac CM+ alone (NHOmac CM+) or in the presence of control IgG2a (NHOmac CM+ + IgG2a) or anti-OSM (NHOmac CM+ + anti-OSM) antibody for 12 days. Cells were then stained with Alizarin Red S. Calcium mineralization was expressed as mean ± SEM (n = 4–5). Ratios correspond to RUNX2/actin or OC/actin. For statistical analysis, 1-way ANOVA followed by Dunnett’s post-hoc test were used (E and G) (**P ≤ 0.01).
Figure 8
Figure 8. Oncostatin M is expressed at sites of NHO following SCI in mice.
(A) Oncostatin M (Osm) mRNA expression is significantly increased in injured muscle after spinal cord injury (SCI). Total RNA was extracted from right hamstring muscle from mice at days 2 and 4 after SCI or sham surgery and intramuscular cardiotoxin (CDTX) or PBS injection (n = 3/4 mice/group, 1 experiment). Results show qRT-PCR quantification of Osm mRNA (relative to β-actin) with a significant increase in Osm mRNA in muscle 4 days after SCI+CDTX compared with SHAM+PBS mice (**P < 0.01 Kruskal-Wallis test). (B) Representative IHC images of hind limbs from mice that underwent sham or SCI surgery with an intramuscular injection of CDTX. At 21 days after surgery in SHAM+CDTX mice, no neurogenic heterotopic ossification (NHO) is noted in the hamstrings, with few macrophages and absence of osterix or OSM expression. In SCI+CDTX mice, collagen type 1+ (Coll1+) bone foci were noted within the muscle (asterisks); surrounding this NHO are numerous F4/80+ macrophages (arrowheads). IHC for OSM confirmed expression of OSM around areas of NHO, with OSM expression noted in areas of macrophage accumulation (circled area) and osterix+ osteoblasts (arrows). Specificity of staining was confirmed with matched isotype controls (first RabbitIgG: Coll1, RatIgG2b:F4/80, GoatIgG:OSM, and second RabbitIgG:Osterix). Data in A are represented as mean ± SD. Original magnification: ×40. Scale bar: 50 μm.
Figure 9
Figure 9. Deletion of the Osmr gene reduces NHO following SCI in mice.
(A) μCT analysis of neurogenic heterotopic ossification (NHO) development 7–14 days following spinal cord injury (SCI) and intramuscular cardiotoxin (CDTX) injection in oncostatin M receptor null (Osmr–/–) mice compared with wild-type C57BL/6 control mice. Each dot represents an individual mouse, and the box-and-whisker plot shows median, 25th and 75 percentile, and minimum and maximum values. Statistical significance was confirmed using a Mann-Whitney test (P = 0.0038, 16 mice/group, experiment repeated twice). (B) Representative 3D reconstructed images of NHO in C57BL/6 and Osmr–/– mice 7 days after surgery. (C) Recombinant mouse oncostatin M (OSM) enhances in vitro osteogenic differentiation. Muscle interstitial cells, satellite cells, and bone marrow mesenchymal stromal cells (BM-MSCs) sorted from naive C57BL/6 mice were cultured for 10 days in control medium, osteogenic medium, or osteogenic medium plus mouse OSM (25 ng/ml). Quantification of Alizarin Red S staining via absorbance at 562 nm confirmed enhanced calcium deposition in interstitial cells (***P < 0.01), satellite cells (*P < 0.05), and BM-MSCs (****P < 0.001) in the presence of osteogenic media alone and significantly enhanced calcium deposition in both interstitial cells and satellite cells in the presence of osteogenic media plus OSM (****P < 0.001). Results are the mean and SDs of 2 separate experiments (n = 3 control media and n = 3–6 osteogenic media ± OSM/each experiment).

References

    1. Shore EM, et al. A recurrent mutation in the BMP type I receptor ACVR1 causes inherited and sporadic fibrodysplasia ossificans progressiva. Nat Genet. 2006;38(5):525–527. doi: 10.1038/ng1783. - DOI - PubMed
    1. Fukuda T, et al. Constitutively activated ALK2 and increased SMAD1/5 cooperatively induce bone morphogenetic protein signaling in fibrodysplasia ossificans progressiva. J Biol Chem. 2009;284(11):7149–7156. doi: 10.1074/jbc.M801681200. - DOI - PMC - PubMed
    1. van Dinther M, et al. ALK2 R206H mutation linked to fibrodysplasia ossificans progressiva confers constitutive activity to the BMP type I receptor and sensitizes mesenchymal cells to BMP-induced osteoblast differentiation and bone formation. J Bone Miner Res. 2010;25(6):1208–1215. - PubMed
    1. Chakkalakal SA, et al. An Acvr1 R206H knock-in mouse has fibrodysplasia ossificans progressiva. J Bone Miner Res. 2012;27(8):1746–1756. doi: 10.1002/jbmr.1637. - DOI - PMC - PubMed
    1. Pek CH, Lim MC, Yong R, Wong HP. Neurogenic heterotopic ossification after a stroke: diagnostic and radiological challenges. Singapore Med J. 2014;55(8):e119–e122. doi: 10.11622/smedj.2014107. - DOI - PMC - PubMed

Publication types

MeSH terms